| Param | Original file | Final file |
|---|---|---|
| Filename | modeM0/AS1A09_002T01_9000005810_42544cztM0_level2.fits | modeM0/AS1A09_002T01_9000005810_42544cztM0_level2_quad_clean.evt |
| Size (bytes) | 340,214,400 | 89,982,720 |
| Size | 324.5 MB | 85.8 MB |
| Events in quadrant A | 3,060,252 | 609,135 |
| Events in quadrant B | 2,457,848 | 623,218 |
| Events in quadrant C | 2,620,810 | 593,603 |
| Events in quadrant D | 4,025,907 | 513,496 |
| Mode M0 | |||
|---|---|---|---|
| Quadrant | BADHDUFLAG | Total packets | Discarded packets |
| A | 0 | 12417 | 2 |
| B | 0 | 11290 | 2 |
| C | 0 | 11321 | 2 |
| D | 0 | 16117 | 2 |
| Mode M9 | |||
|---|---|---|---|
| Quadrant | BADHDUFLAG | Total packets | Discarded packets |
| A | 0 | 32 | 0 |
| B | 0 | 32 | 0 |
| C | 0 | 32 | 0 |
| D | 0 | 32 | 0 |
| Mode SS | |||
|---|---|---|---|
| Quadrant | BADHDUFLAG | Total packets | Discarded packets |
| A | 0 | 114 | 0 |
| B | 0 | 114 | 0 |
| C | 0 | 114 | 0 |
| D | 0 | 114 | 0 |
| Quadrant | Total seconds | Saturated seconds | Saturation percentage |
|---|---|---|---|
| A | 5503 | 58 | 1.053971% |
| B | 5504 | 23 | 0.417878% |
| C | 5504 | 11 | 0.199855% |
| D | 5504 | 404 | 7.340116% |
Noise dominated data is calculated using 1-second bins in cleaned event files. If a bin has >2000 counts, and if more than 50% of those come from <1% of pixels, then it is considered to be noise-dominated and hence unusable.
| Quadrant | # 1 sec bins | Bins with >0 counts | Bins with >2000 counts | High rate bins dominated by noise | Noise dominated (total time) | Noise dominated (detector-on time) | Marked lightcurve |
|---|---|---|---|---|---|---|---|
| A | 8728 | 5505 | 43 | 43 | 0.49% | 0.78% | 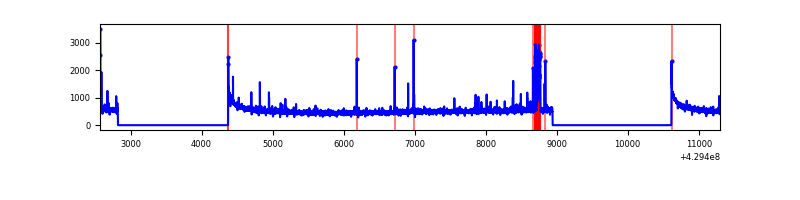 |
| B | 8729 | 5506 | 14 | 14 | 0.16% | 0.25% | 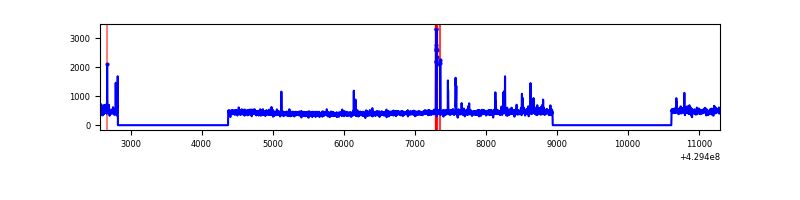 |
| C | 8729 | 5506 | 7 | 7 | 0.08% | 0.13% | 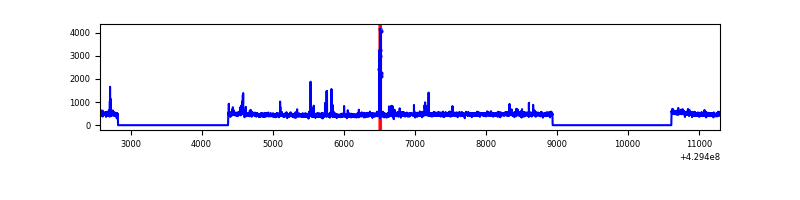 |
| D | 8729 | 5506 | 346 | 346 | 3.96% | 6.28% | 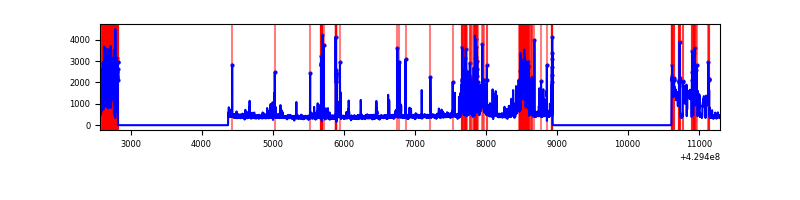 |
Top three noisy pixels from each quadrant. If the there are fewer than three noisy pixels in the level2.evt file, extra rows are filled as -1
| Pixel properties | Quadrant properties | ||||||
|---|---|---|---|---|---|---|---|
| Quadrant | DetID | PixID | Counts | Sigma | Mean | Median | Sigma |
| A | 10 | 83 | 559950 | 4604.67 | 594 | 583 | 121.5 |
| A | 2 | 79 | 178581 | 1465.27 | 594 | 583 | 121.5 |
| A | 13 | 248 | 16298 | 129.36 | 594 | 583 | 121.5 |
| B | 5 | 172 | 56067 | 493.87 | 590 | 575 | 112.4 |
| B | 0 | 245 | 45862 | 403.05 | 590 | 575 | 112.4 |
| B | 5 | 255 | 24846 | 216.01 | 590 | 575 | 112.4 |
| C | 15 | 214 | 230633 | 1707.21 | 581 | 586 | 134.8 |
| C | 15 | 111 | 44284 | 324.29 | 581 | 586 | 134.8 |
| C | 14 | 254 | 39398 | 288.03 | 581 | 586 | 134.8 |
| D | 2 | 249 | 725669 | 5264.17 | 564 | 548 | 137.7 |
| D | 2 | 16 | 402135 | 2915.41 | 564 | 548 | 137.7 |
| D | 12 | 233 | 386606 | 2802.67 | 564 | 548 | 137.7 |
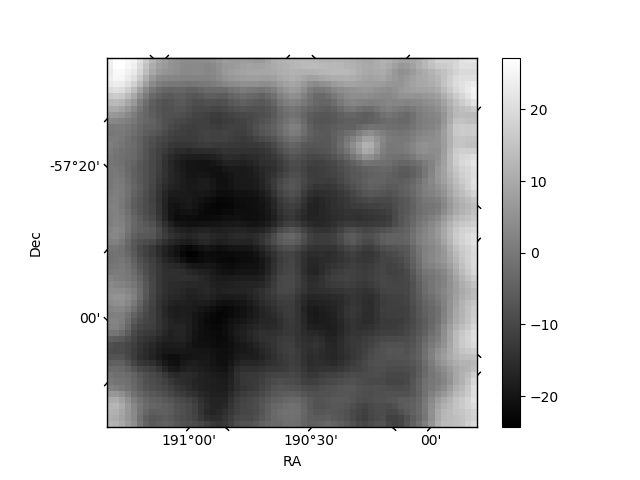
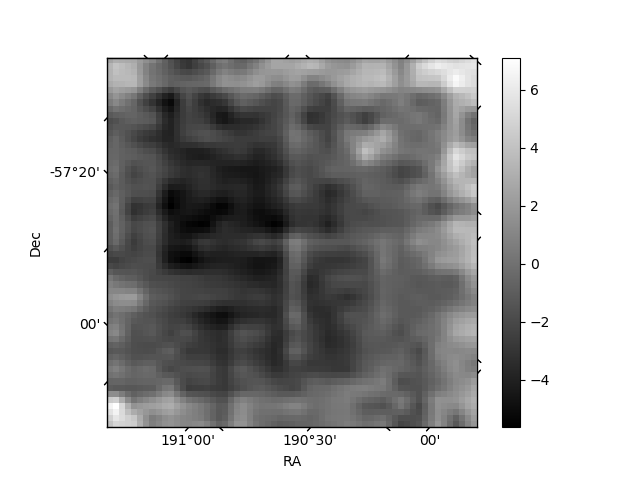
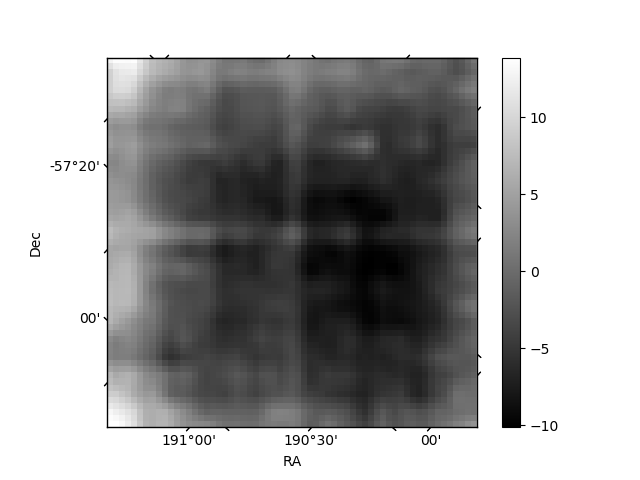
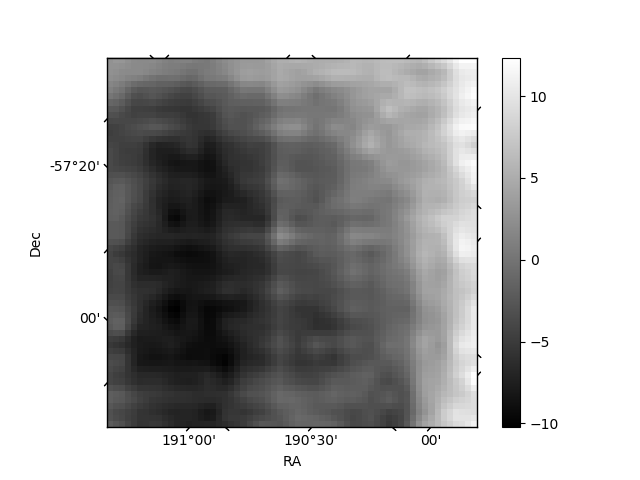
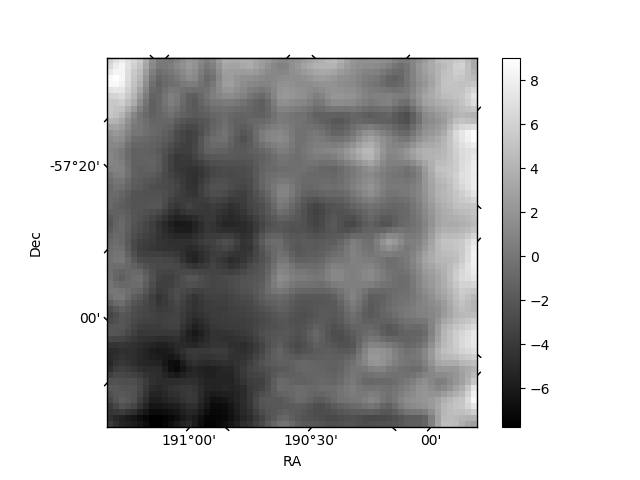
Histogram calculated using DETX and DETY for each event in the final _common_clean file
| Quadrant A | 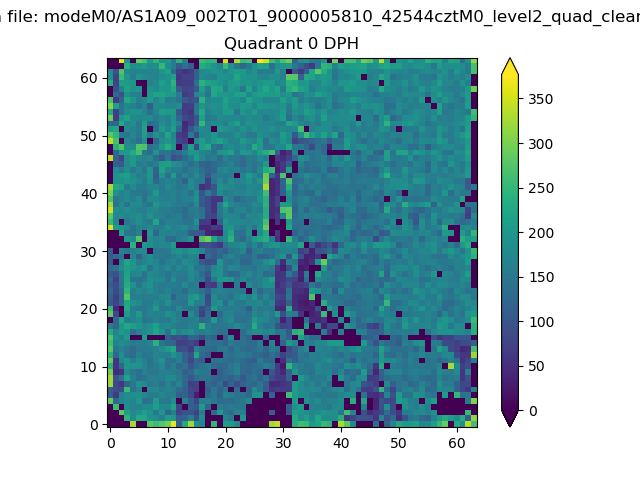 |
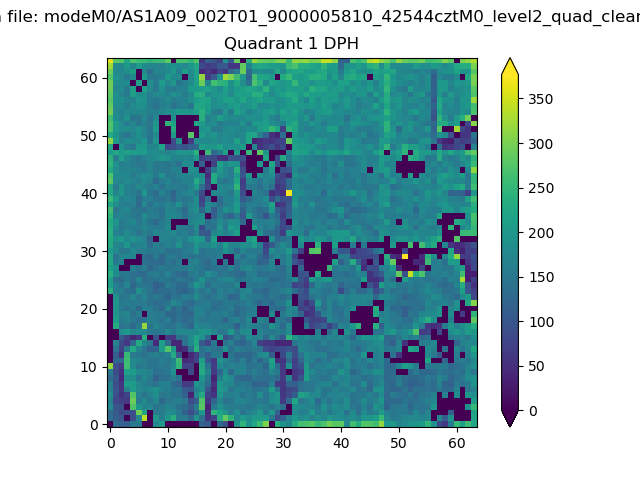 |
Quadrant B |
|---|---|---|---|
| Quadrant D |  |
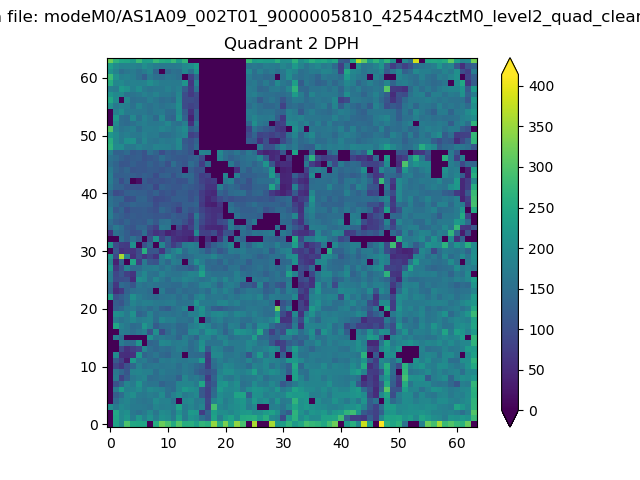 |
Quadrant C |
| Plot type | Count rate plots | Images |
|---|---|---|
| Comparison with Poisson distribution Blue bars denote a histogram of data divided into 1 sec bins. Red curve is a Poisson curve with rate = median count rate of data. |
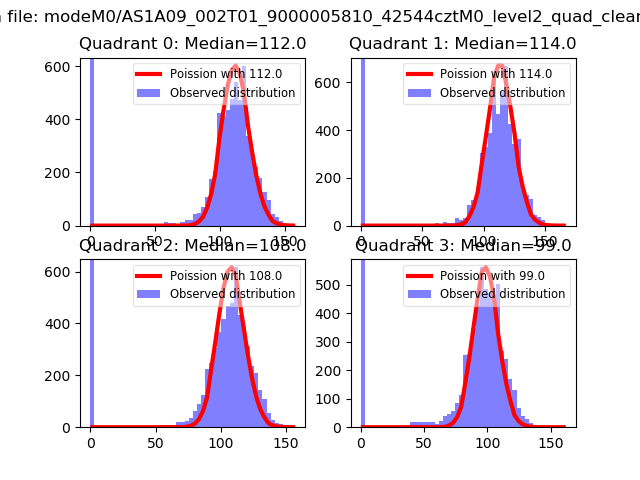 |
 |
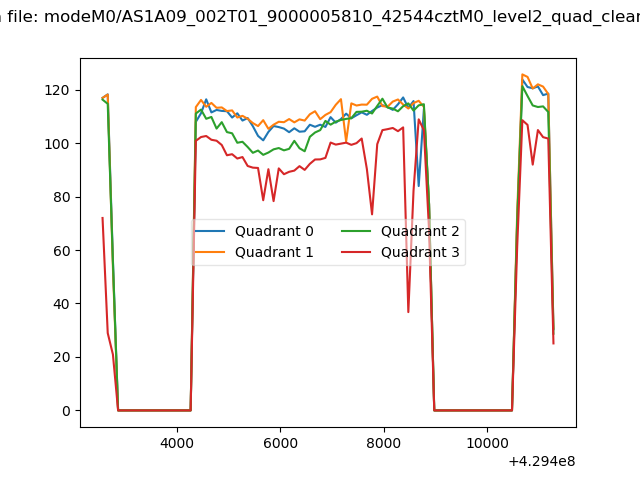
| Quadrant-wise count rates Data is divided into 100 sec bins |
 |
|
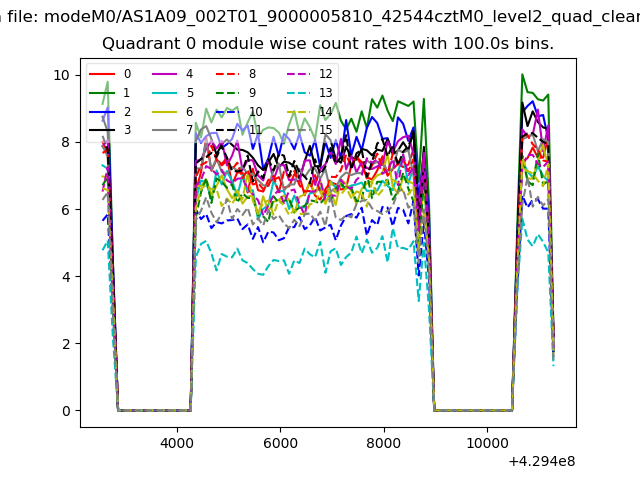
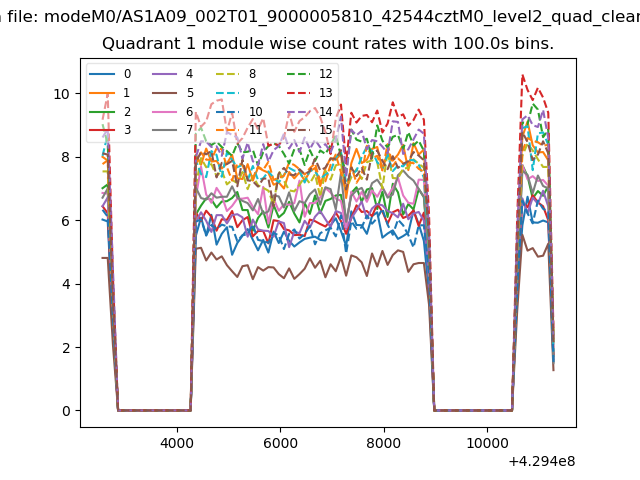
| Module-wise count rates for Quadrant A Data is divided into 100 sec bins |
 |
 |
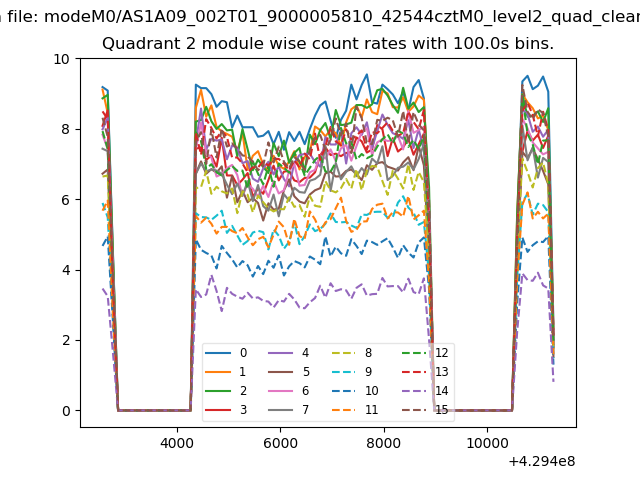
| Module-wise count rates for Quadrant B Data is divided into 100 sec bins |
 |
 |
| Module-wise count rates for Quadrant C Data is divided into 100 sec bins |
 |
 |
| Module-wise count rates for Quadrant D Data is divided into 100 sec bins |
 |
 |
| Parameter | Plot |
|---|---|
| CZT HV Monitor | 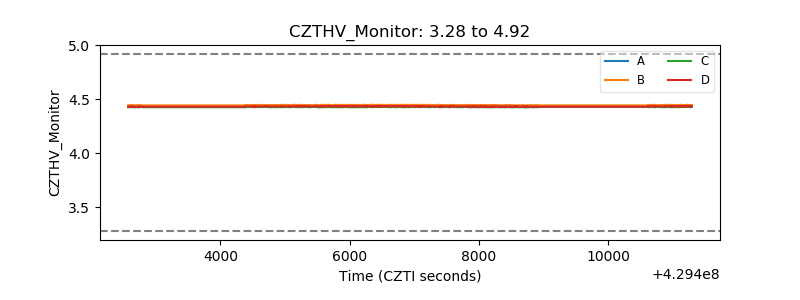 |
| D_VDD | 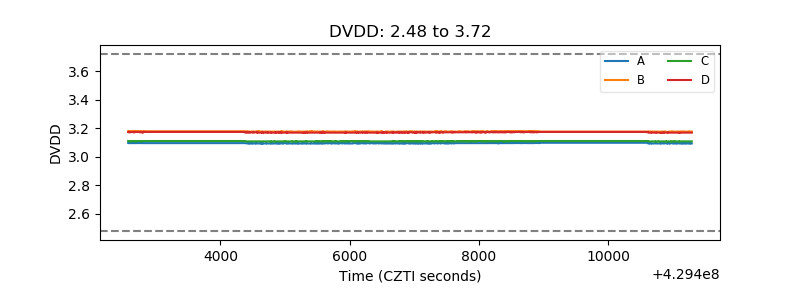 |
| Temperature 1 | 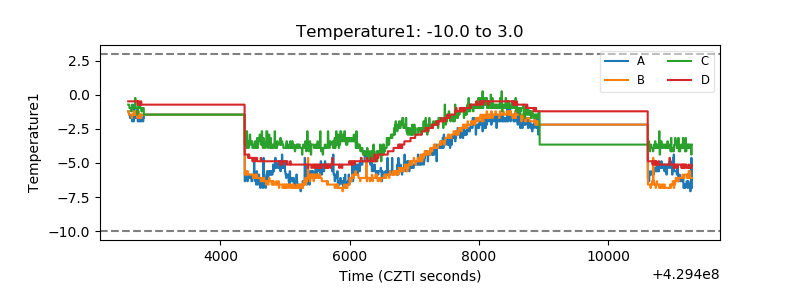 |
| Veto HV Monitor | 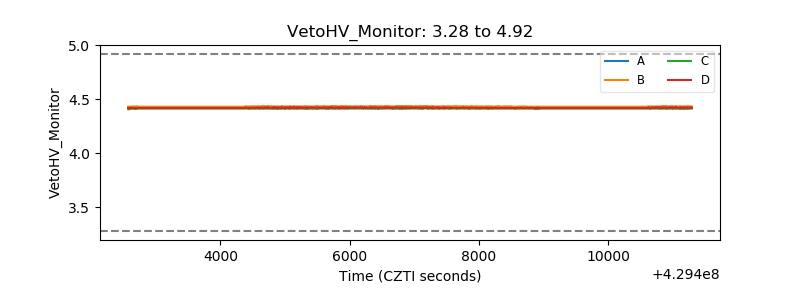 |
| Veto LLD | 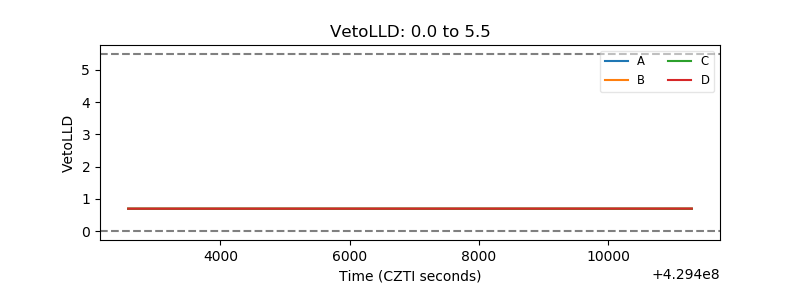 |
| Alpha Counter | 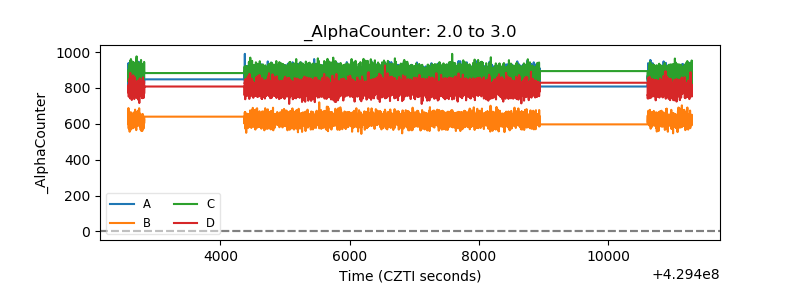 |
| _CPM_Rate | 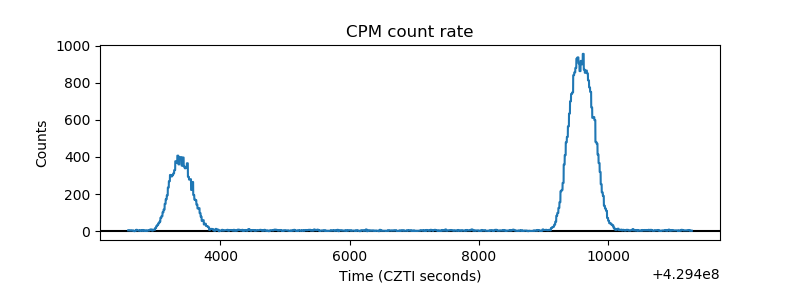 |
| CZT Counter | 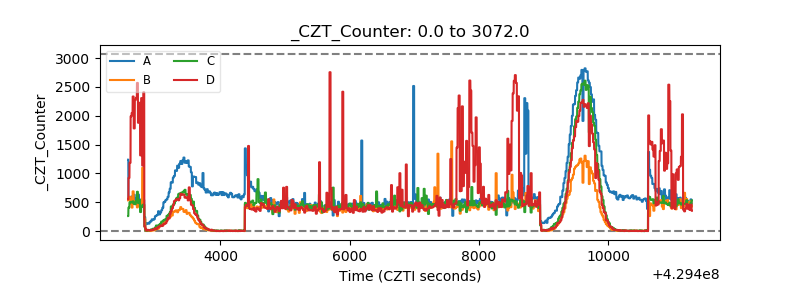 |
| +2.5 Volts monitor | 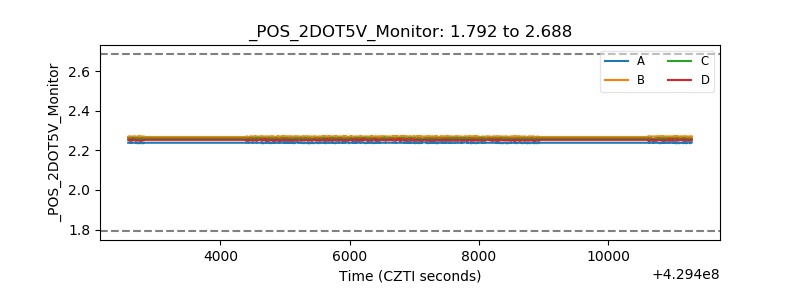 |
| +5 Volts monitor | 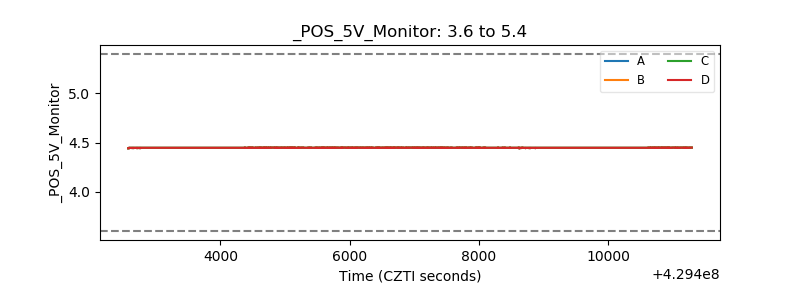 |
| _ROLL_ROT | 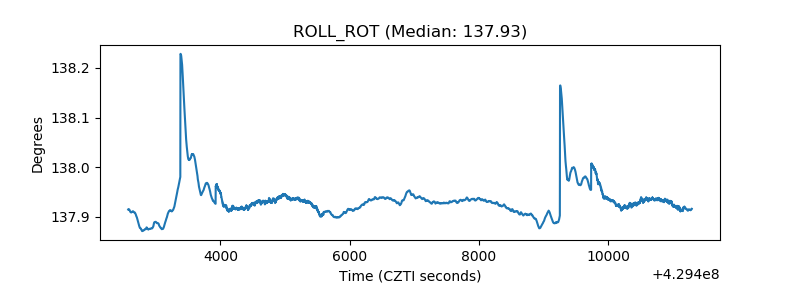 |
| _Roll_DEC | 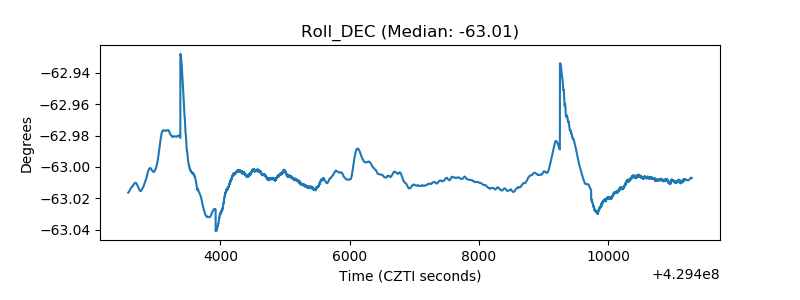 |
| _Roll_RA | 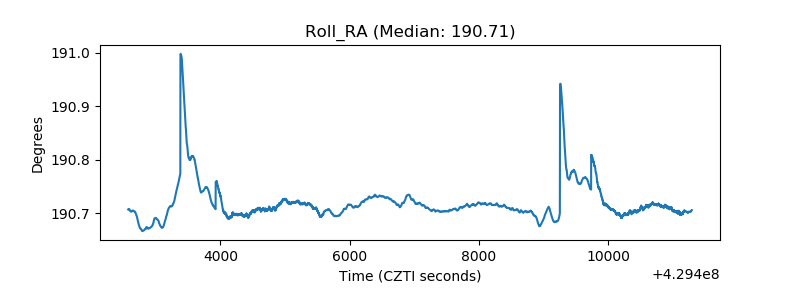 |
| Veto Counter | 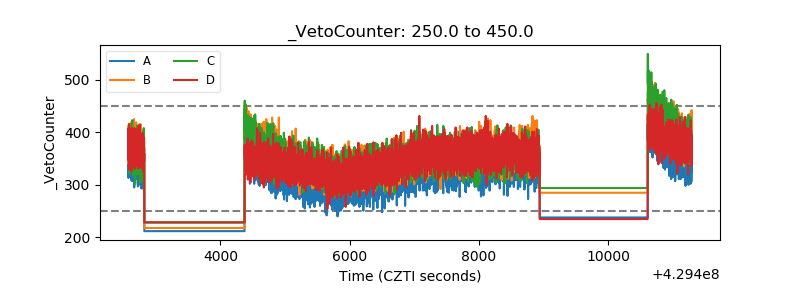 |