| Param | Original file | Final file |
|---|---|---|
| Filename | modeM0/AS1A12_102T01_9000005812_42545cztM0_level2.fits | modeM0/AS1A12_102T01_9000005812_42545cztM0_level2_quad_clean.evt |
| Size (bytes) | 291,041,280 | 91,555,200 |
| Size | 277.6 MB | 87.3 MB |
| Events in quadrant A | 2,861,106 | 611,787 |
| Events in quadrant B | 2,389,707 | 633,131 |
| Events in quadrant C | 2,447,583 | 600,242 |
| Events in quadrant D | 2,656,572 | 551,588 |
| Mode M0 | |||
|---|---|---|---|
| Quadrant | BADHDUFLAG | Total packets | Discarded packets |
| A | 0 | 11696 | 2 |
| B | 0 | 10950 | 2 |
| C | 0 | 10774 | 2 |
| D | 0 | 11895 | 2 |
| Mode M9 | |||
|---|---|---|---|
| Quadrant | BADHDUFLAG | Total packets | Discarded packets |
| A | 0 | 19 | 0 |
| B | 0 | 19 | 0 |
| C | 0 | 19 | 0 |
| D | 0 | 19 | 0 |
| Mode SS | |||
|---|---|---|---|
| Quadrant | BADHDUFLAG | Total packets | Discarded packets |
| A | 0 | 110 | 0 |
| B | 0 | 110 | 0 |
| C | 0 | 110 | 0 |
| D | 0 | 110 | 0 |
| Quadrant | Total seconds | Saturated seconds | Saturation percentage |
|---|---|---|---|
| A | 5362 | 13 | 0.242447% |
| B | 5363 | 11 | 0.205109% |
| C | 5363 | 1 | 0.018646% |
| D | 5363 | 48 | 0.895021% |
Noise dominated data is calculated using 1-second bins in cleaned event files. If a bin has >2000 counts, and if more than 50% of those come from <1% of pixels, then it is considered to be noise-dominated and hence unusable.
| Quadrant | # 1 sec bins | Bins with >0 counts | Bins with >2000 counts | High rate bins dominated by noise | Noise dominated (total time) | Noise dominated (detector-on time) | Marked lightcurve |
|---|---|---|---|---|---|---|---|
| A | 7305 | 5363 | 4 | 4 | 0.05% | 0.07% | 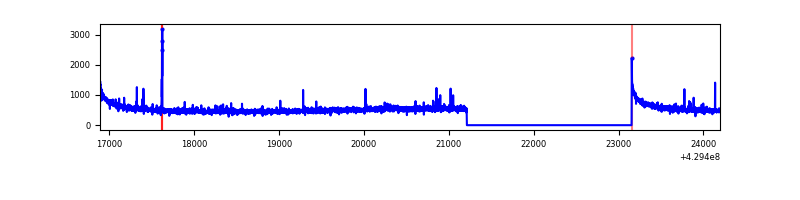 |
| B | 7306 | 5364 | 4 | 4 | 0.05% | 0.07% | 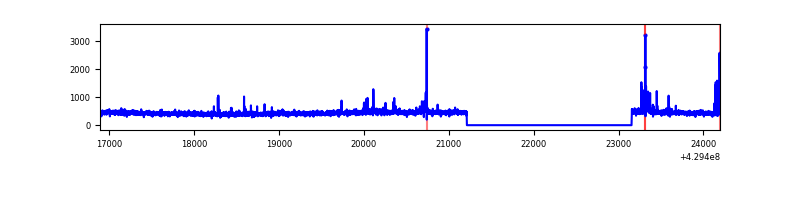 |
| C | 7306 | 5364 | 0 | 0 | 0.00% | 0.00% | 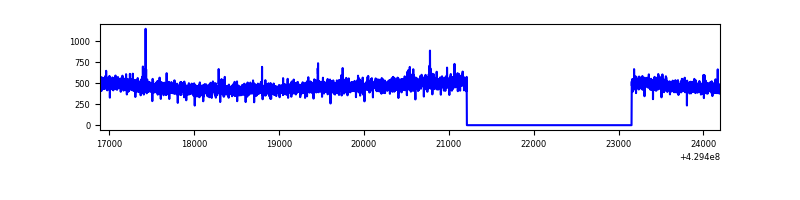 |
| D | 7306 | 5364 | 40 | 40 | 0.55% | 0.75% | 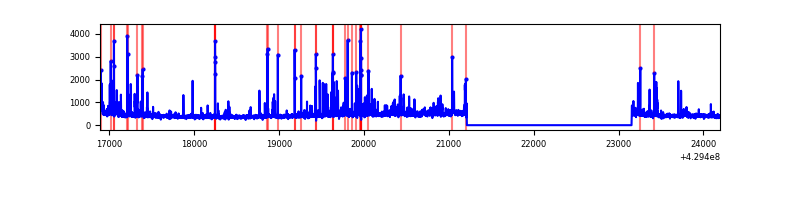 |
Top three noisy pixels from each quadrant. If the there are fewer than three noisy pixels in the level2.evt file, extra rows are filled as -1
| Pixel properties | Quadrant properties | ||||||
|---|---|---|---|---|---|---|---|
| Quadrant | DetID | PixID | Counts | Sigma | Mean | Median | Sigma |
| A | 10 | 83 | 534995 | 4458.77 | 587 | 575 | 119.9 |
| A | 2 | 79 | 33786 | 277.09 | 587 | 575 | 119.9 |
| A | 13 | 248 | 11654 | 92.43 | 587 | 575 | 119.9 |
| B | 5 | 172 | 59272 | 523.89 | 582 | 568 | 112.1 |
| B | 0 | 245 | 22712 | 197.62 | 582 | 568 | 112.1 |
| B | 15 | 85 | 14639 | 125.57 | 582 | 568 | 112.1 |
| C | 15 | 214 | 226273 | 1713.43 | 566 | 569 | 131.7 |
| C | 14 | 254 | 5226 | 35.35 | 566 | 569 | 131.7 |
| C | 3 | 233 | 4843 | 32.45 | 566 | 569 | 131.7 |
| D | 1 | 52 | 243640 | 1764.25 | 564 | 546 | 137.8 |
| D | 12 | 6 | 105451 | 761.34 | 564 | 546 | 137.8 |
| D | 13 | 249 | 43198 | 309.55 | 564 | 546 | 137.8 |
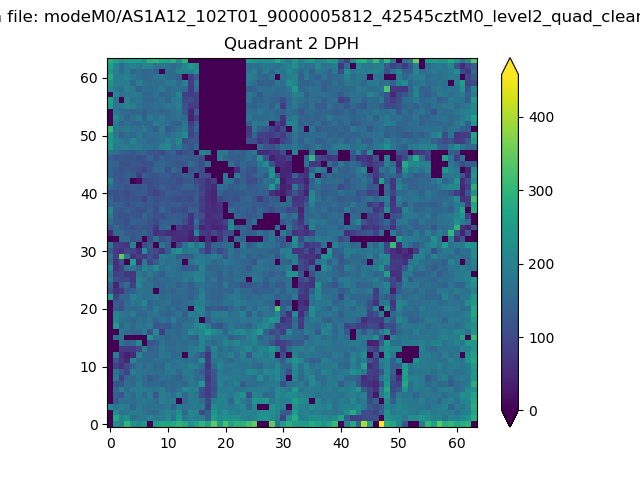
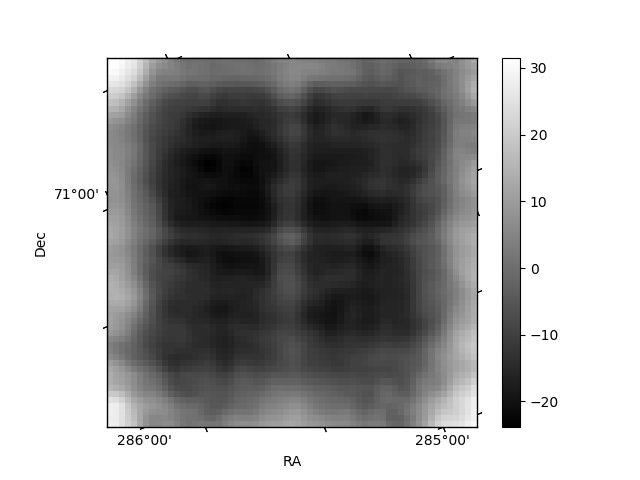
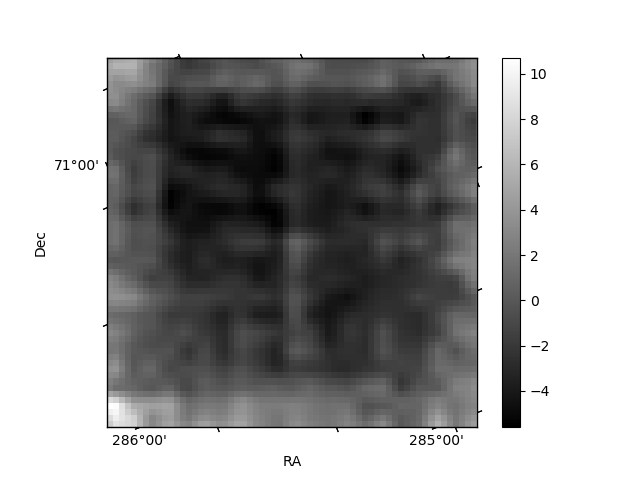
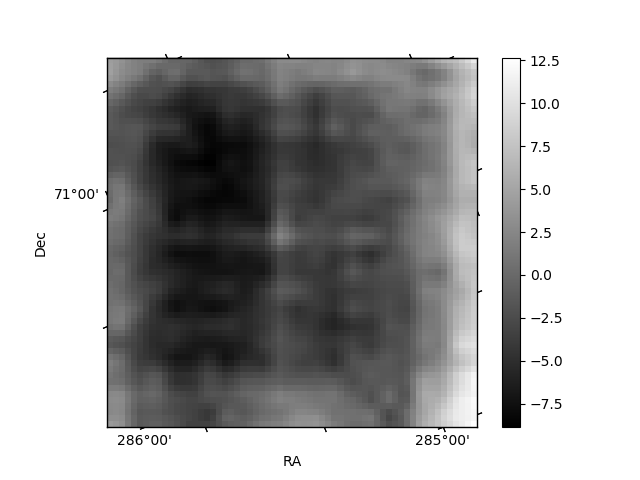
Histogram calculated using DETX and DETY for each event in the final _common_clean file
| Quadrant A | 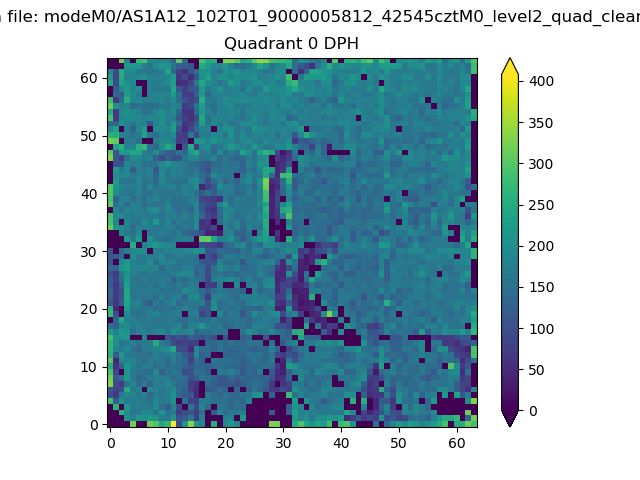 |
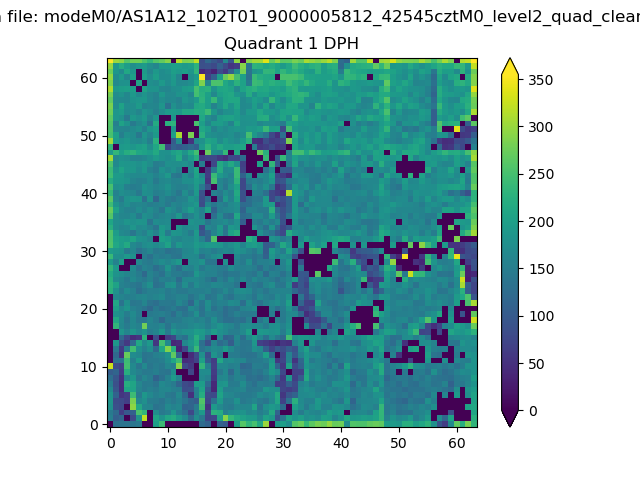 |
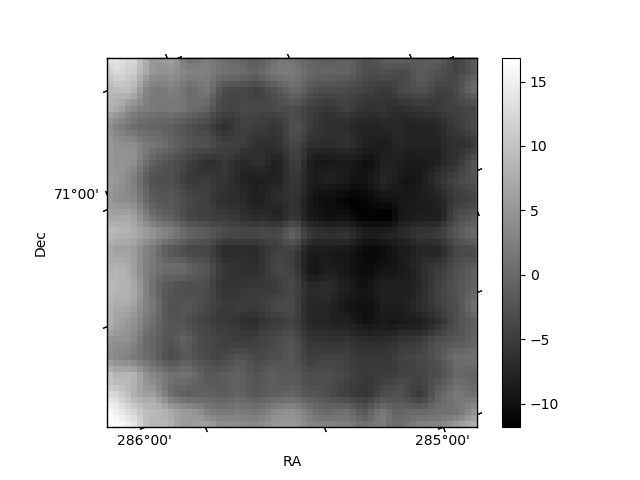
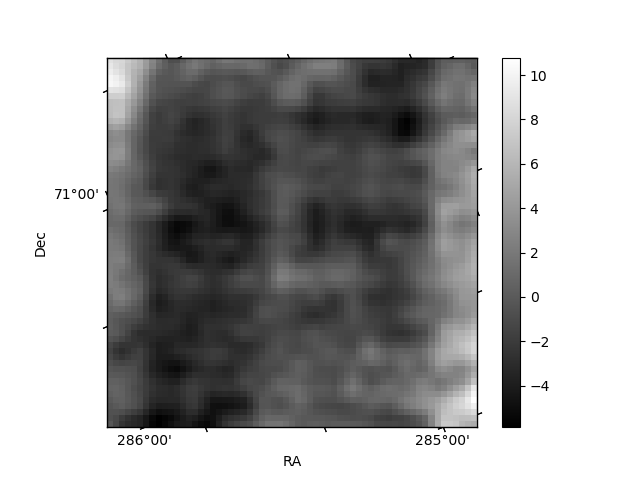
Quadrant B |
|---|---|---|---|
| Quadrant D | 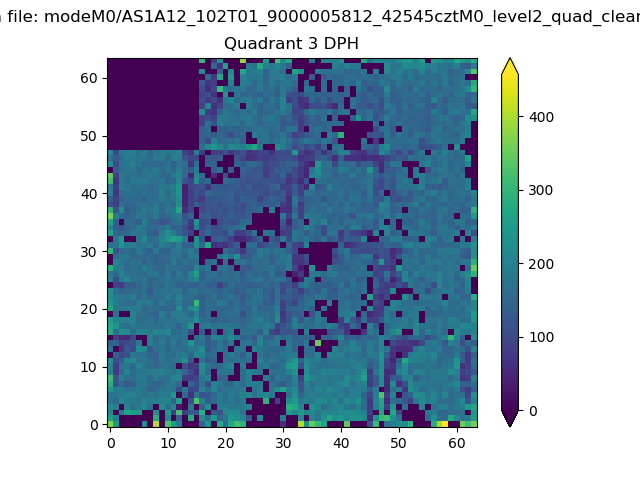 |
 |
Quadrant C |
| Plot type | Count rate plots | Images |
|---|---|---|
| Comparison with Poisson distribution Blue bars denote a histogram of data divided into 1 sec bins. Red curve is a Poisson curve with rate = median count rate of data. |
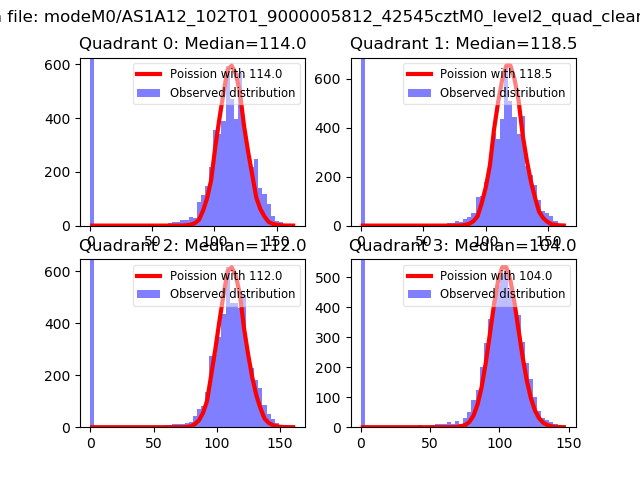 |
 |
| Quadrant-wise count rates Data is divided into 100 sec bins |
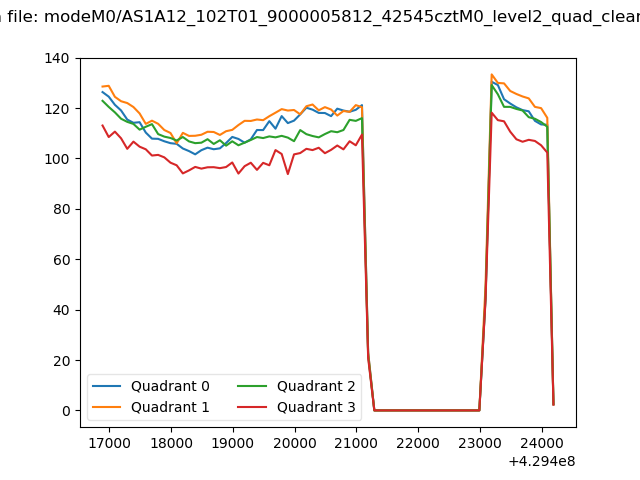 |
|
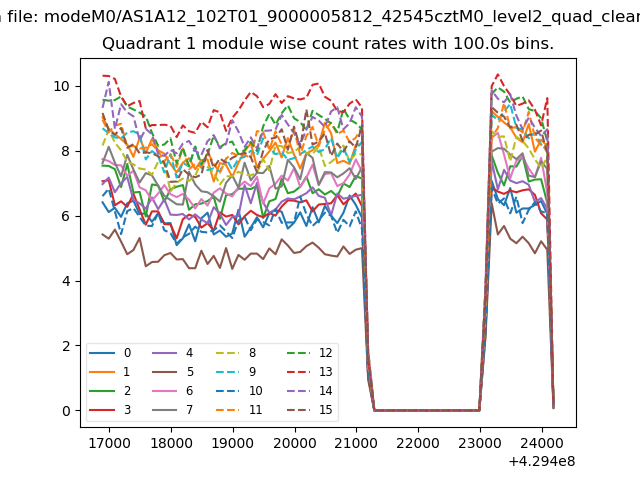
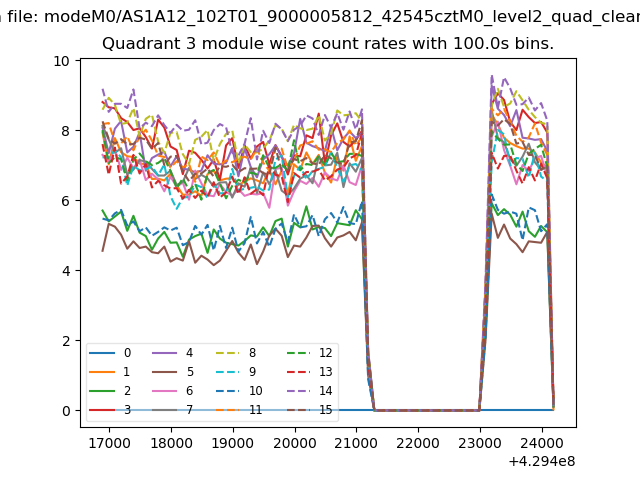
| Module-wise count rates for Quadrant A Data is divided into 100 sec bins |
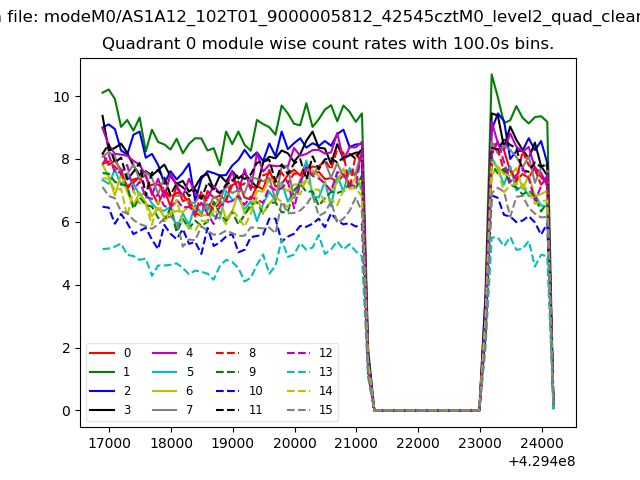 |
 |
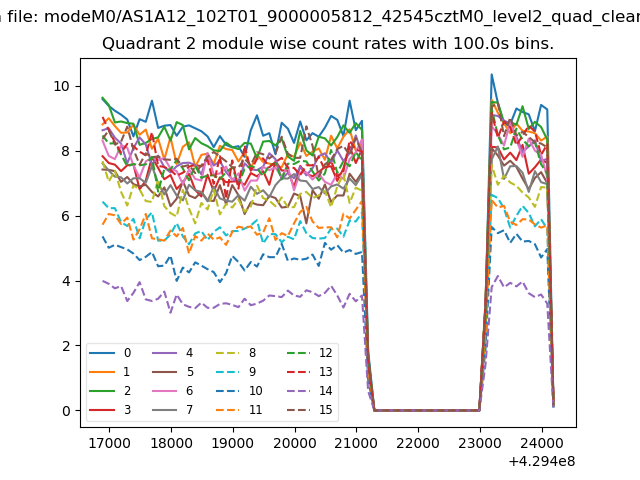
| Module-wise count rates for Quadrant B Data is divided into 100 sec bins |
 |
 |
| Module-wise count rates for Quadrant C Data is divided into 100 sec bins |
 |
 |
| Module-wise count rates for Quadrant D Data is divided into 100 sec bins |
 |
 |
| Parameter | Plot |
|---|---|
| CZT HV Monitor | 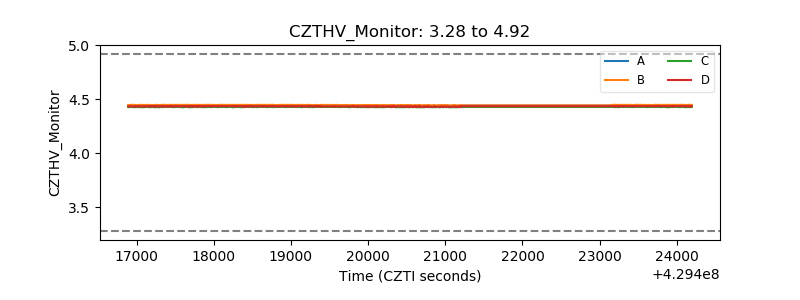 |
| D_VDD | 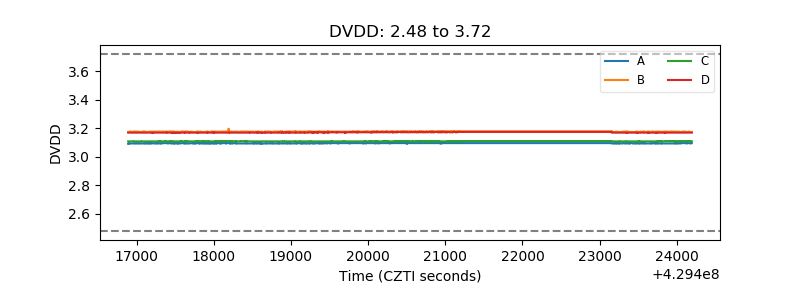 |
| Temperature 1 | 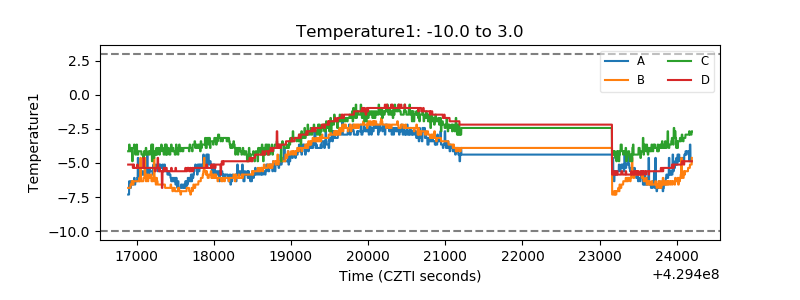 |
| Veto HV Monitor | 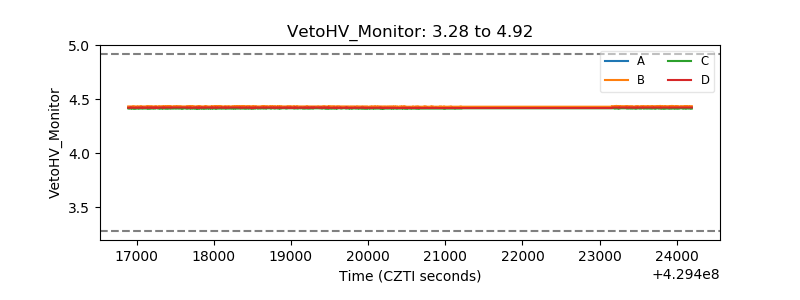 |
| Veto LLD | 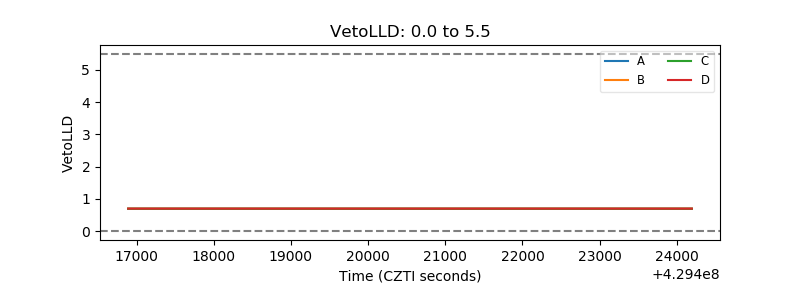 |
| Alpha Counter | 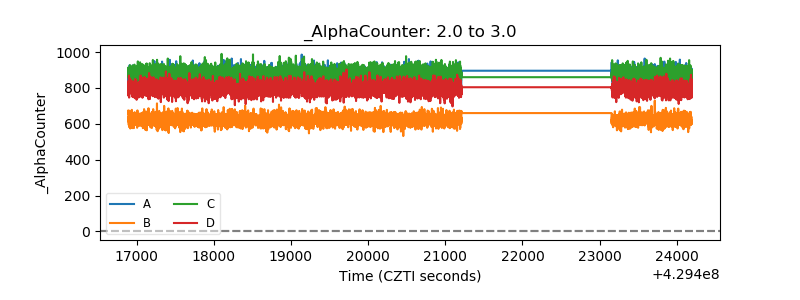 |
| _CPM_Rate | 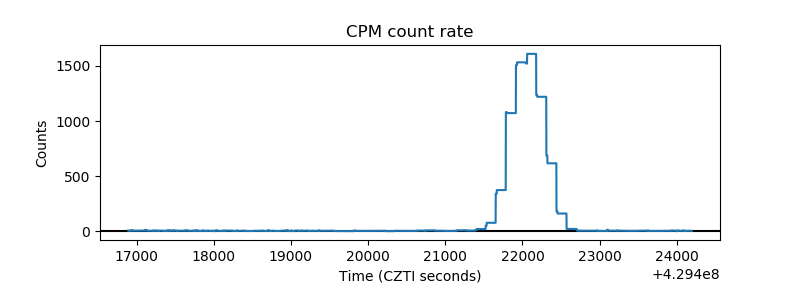 |
| CZT Counter | 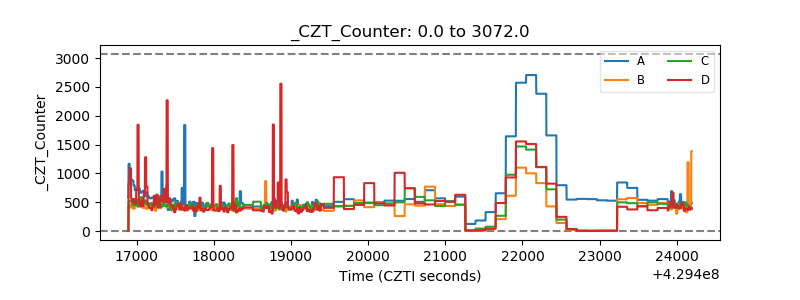 |
| +2.5 Volts monitor | 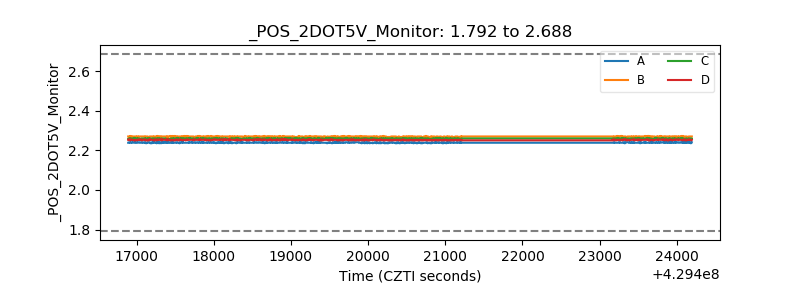 |
| +5 Volts monitor |  |
| _ROLL_ROT |  |
| _Roll_DEC | 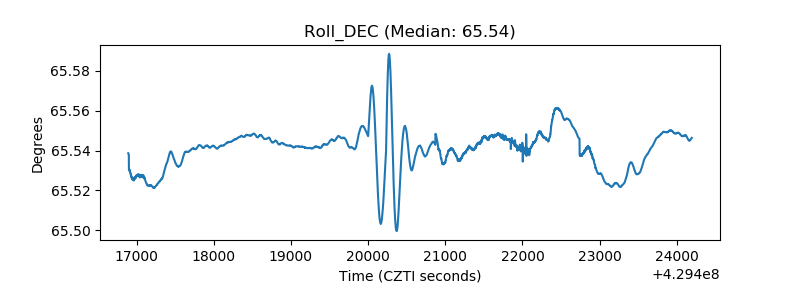 |
| _Roll_RA | 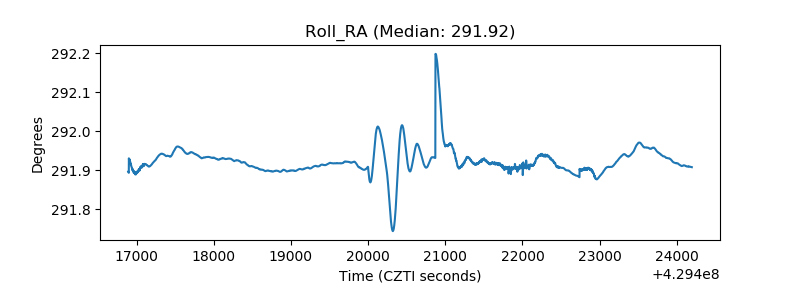 |
| Veto Counter | 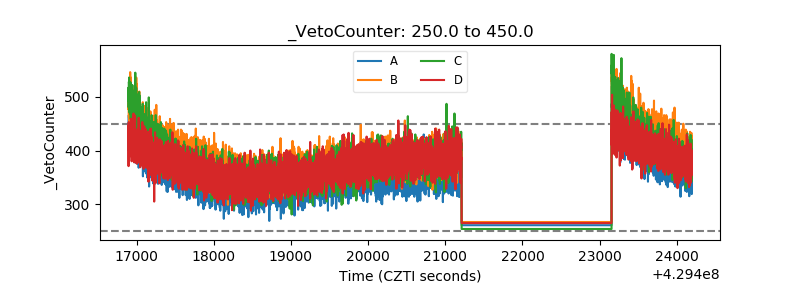 |