| Param | Original file | Final file |
|---|---|---|
| Filename | modeM0/AS1A12_102T01_9000005812_42546cztM0_level2.fits | modeM0/AS1A12_102T01_9000005812_42546cztM0_level2_quad_clean.evt |
| Size (bytes) | 306,547,200 | 88,171,200 |
| Size | 292.3 MB | 84.1 MB |
| Events in quadrant A | 2,808,017 | 599,589 |
| Events in quadrant B | 2,786,916 | 607,054 |
| Events in quadrant C | 2,391,701 | 581,939 |
| Events in quadrant D | 2,965,422 | 526,168 |
| Mode M0 | |||
|---|---|---|---|
| Quadrant | BADHDUFLAG | Total packets | Discarded packets |
| A | 0 | 11278 | 2 |
| B | 0 | 11713 | 2 |
| C | 0 | 10321 | 2 |
| D | 0 | 12463 | 2 |
| Mode M9 | |||
|---|---|---|---|
| Quadrant | BADHDUFLAG | Total packets | Discarded packets |
| A | 0 | 21 | 0 |
| B | 0 | 22 | 0 |
| C | 0 | 22 | 0 |
| D | 0 | 22 | 0 |
| Mode SS | |||
|---|---|---|---|
| Quadrant | BADHDUFLAG | Total packets | Discarded packets |
| A | 0 | 102 | 0 |
| B | 0 | 102 | 0 |
| C | 0 | 102 | 0 |
| D | 0 | 102 | 0 |
| Quadrant | Total seconds | Saturated seconds | Saturation percentage |
|---|---|---|---|
| A | 5070 | 15 | 0.295858% |
| B | 5070 | 112 | 2.209073% |
| C | 5070 | 11 | 0.216963% |
| D | 5070 | 127 | 2.504931% |
Noise dominated data is calculated using 1-second bins in cleaned event files. If a bin has >2000 counts, and if more than 50% of those come from <1% of pixels, then it is considered to be noise-dominated and hence unusable.
| Quadrant | # 1 sec bins | Bins with >0 counts | Bins with >2000 counts | High rate bins dominated by noise | Noise dominated (total time) | Noise dominated (detector-on time) | Marked lightcurve |
|---|---|---|---|---|---|---|---|
| A | 7132 | 5071 | 3 | 3 | 0.04% | 0.06% | 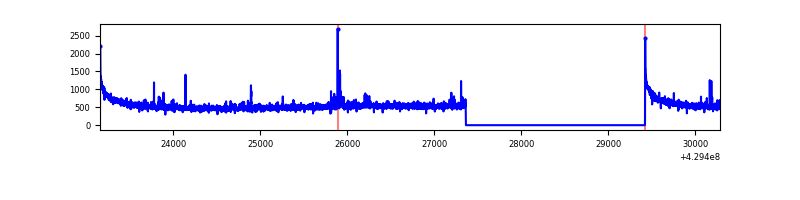 |
| B | 7132 | 5071 | 89 | 89 | 1.25% | 1.76% | 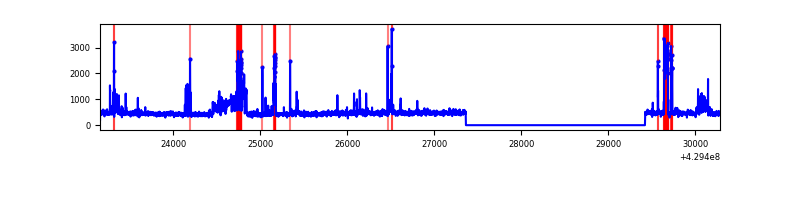 |
| C | 7132 | 5071 | 6 | 6 | 0.08% | 0.12% | 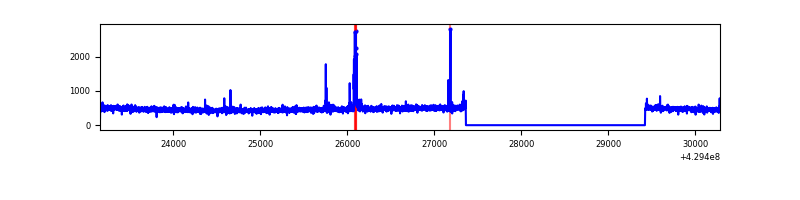 |
| D | 7132 | 5071 | 95 | 95 | 1.33% | 1.87% | 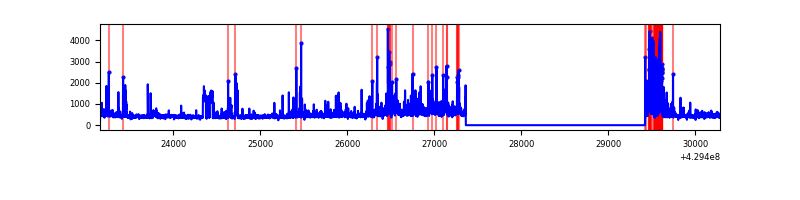 |
Top three noisy pixels from each quadrant. If the there are fewer than three noisy pixels in the level2.evt file, extra rows are filled as -1
| Pixel properties | Quadrant properties | ||||||
|---|---|---|---|---|---|---|---|
| Quadrant | DetID | PixID | Counts | Sigma | Mean | Median | Sigma |
| A | 10 | 83 | 536710 | 4658.18 | 568 | 557 | 115.1 |
| A | 2 | 79 | 29932 | 255.21 | 568 | 557 | 115.1 |
| A | 13 | 248 | 27102 | 230.63 | 568 | 557 | 115.1 |
| B | 5 | 172 | 546958 | 5145.28 | 559 | 545 | 106.2 |
| B | 0 | 245 | 25321 | 233.3 | 559 | 545 | 106.2 |
| B | 15 | 85 | 15478 | 140.62 | 559 | 545 | 106.2 |
| C | 15 | 214 | 212178 | 1663.5 | 545 | 549 | 127.2 |
| C | 14 | 254 | 38595 | 299.06 | 545 | 549 | 127.2 |
| C | 15 | 111 | 15871 | 120.44 | 545 | 549 | 127.2 |
| D | 1 | 52 | 413373 | 3146.36 | 541 | 525 | 131.2 |
| D | 13 | 249 | 220295 | 1674.89 | 541 | 525 | 131.2 |
| D | 2 | 16 | 81104 | 614.1 | 541 | 525 | 131.2 |
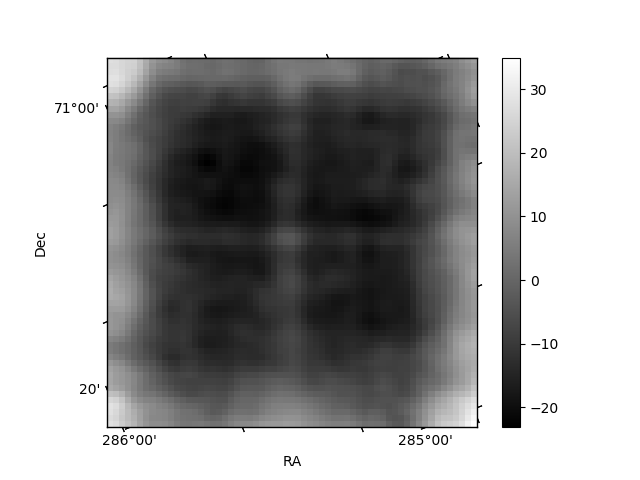
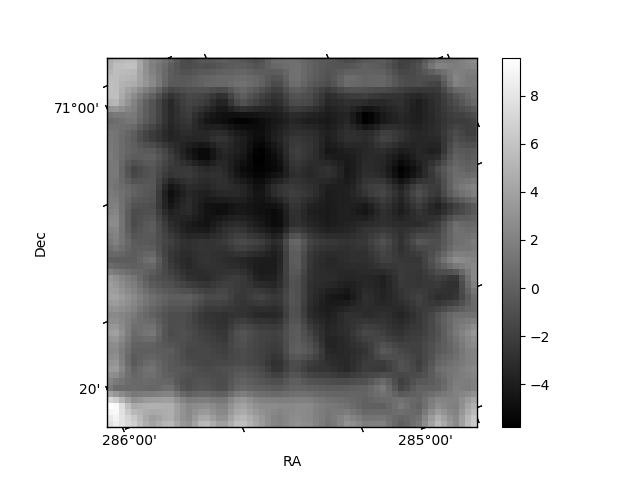
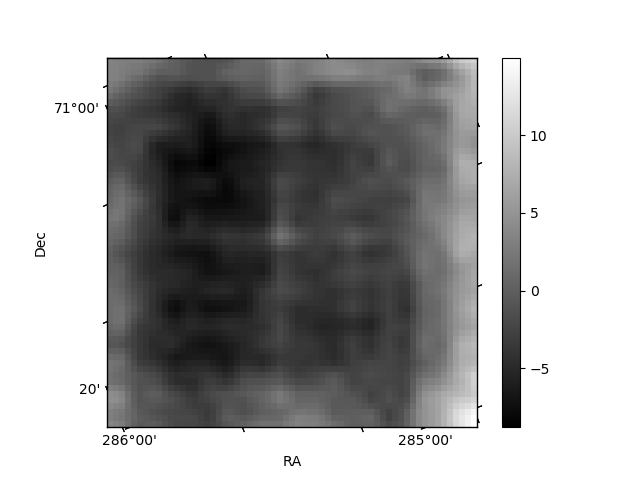
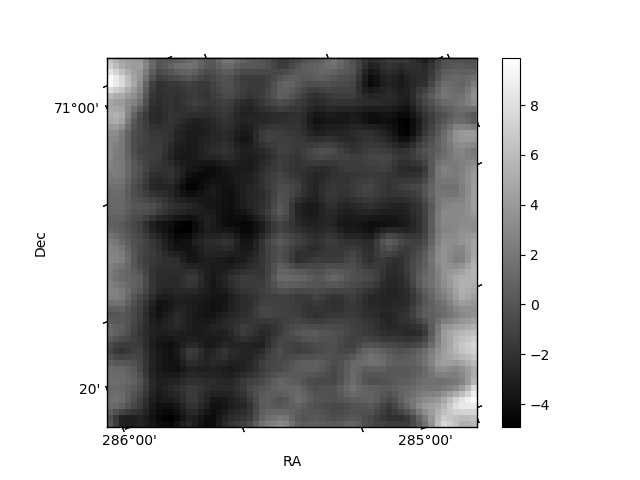
Histogram calculated using DETX and DETY for each event in the final _common_clean file
| Quadrant A | 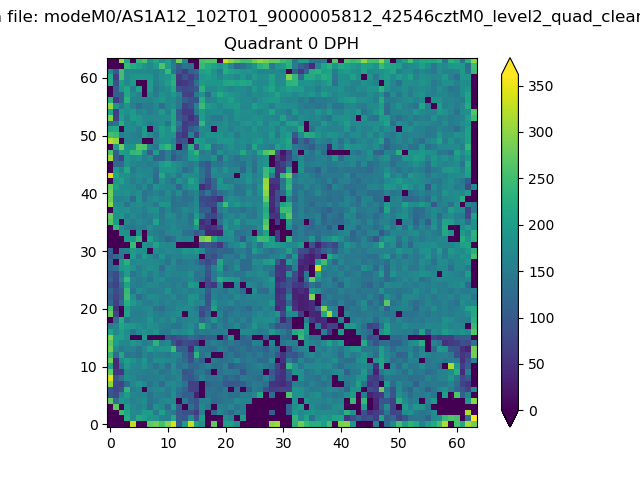 |
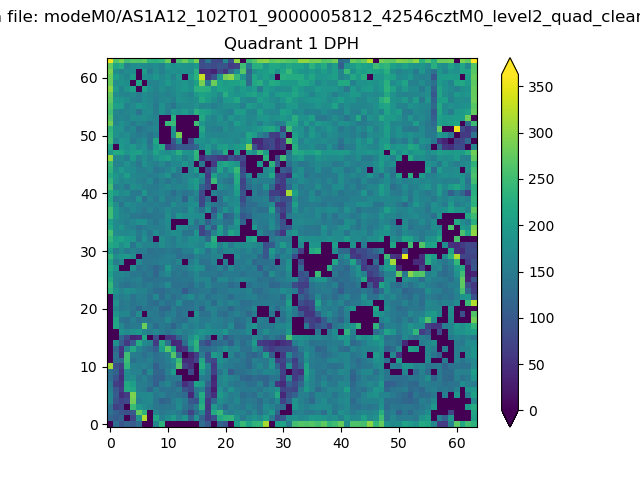 |
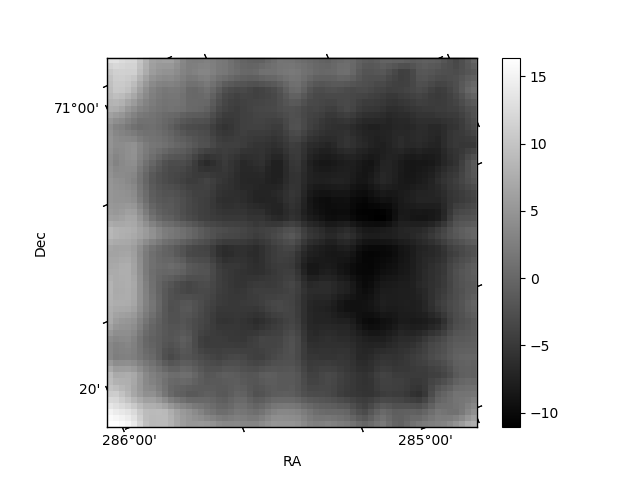
Quadrant B |
|---|---|---|---|
| Quadrant D | 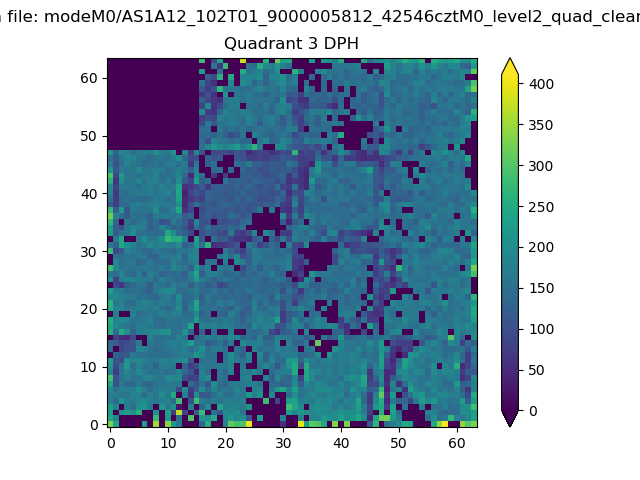 |
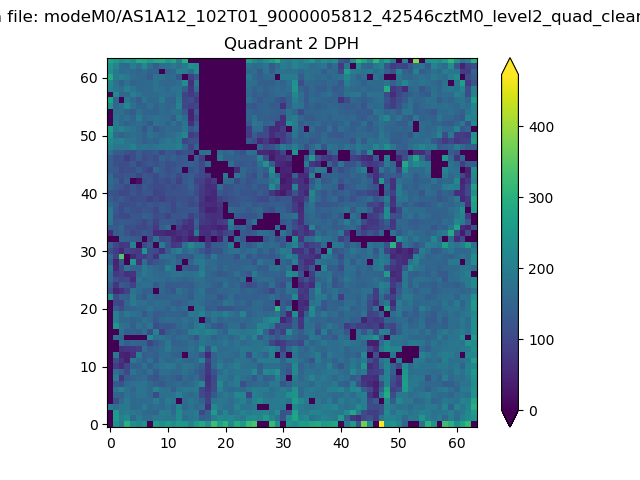 |
Quadrant C |
| Plot type | Count rate plots | Images |
|---|---|---|
| Comparison with Poisson distribution Blue bars denote a histogram of data divided into 1 sec bins. Red curve is a Poisson curve with rate = median count rate of data. |
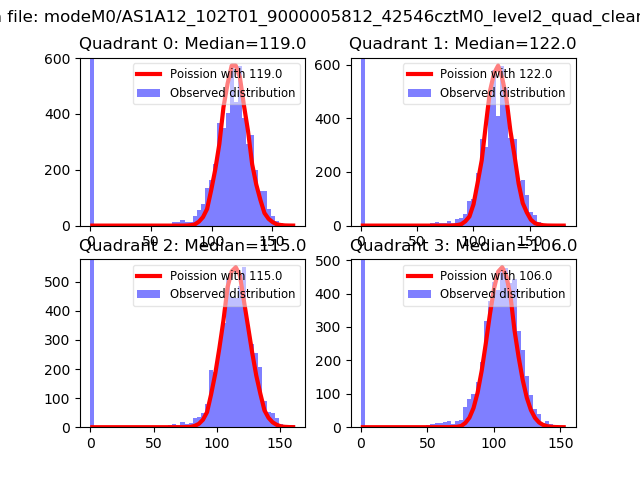 |
 |
| Quadrant-wise count rates Data is divided into 100 sec bins |
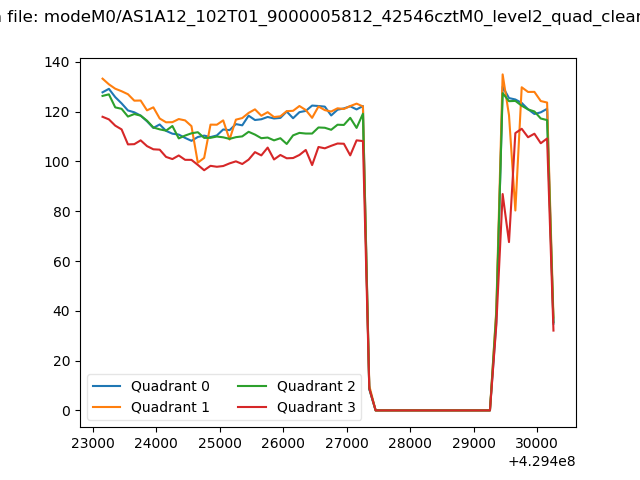 |
|
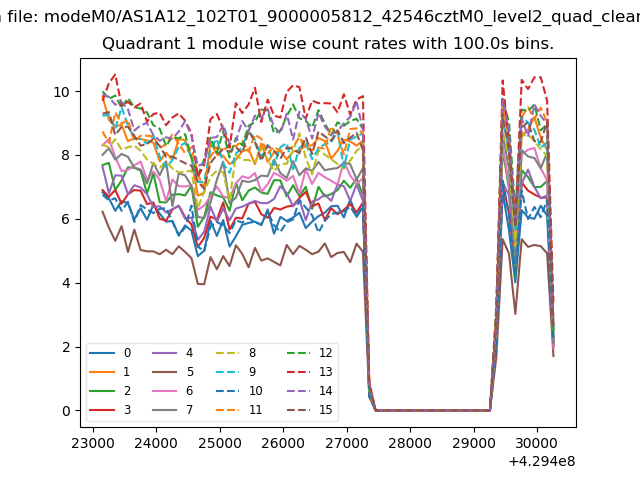
| Module-wise count rates for Quadrant A Data is divided into 100 sec bins |
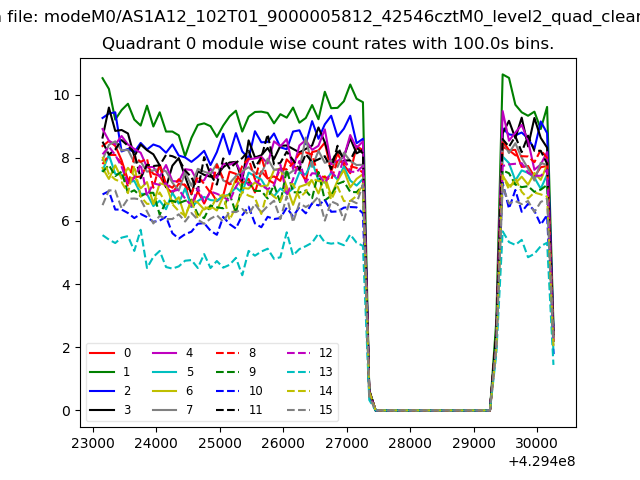 |
 |
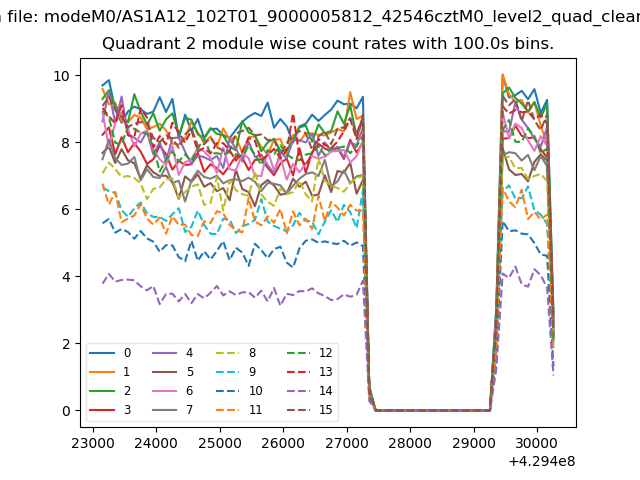
| Module-wise count rates for Quadrant B Data is divided into 100 sec bins |
 |
 |
| Module-wise count rates for Quadrant C Data is divided into 100 sec bins |
 |
 |
| Module-wise count rates for Quadrant D Data is divided into 100 sec bins |
 |
 |
| Parameter | Plot |
|---|---|
| CZT HV Monitor | 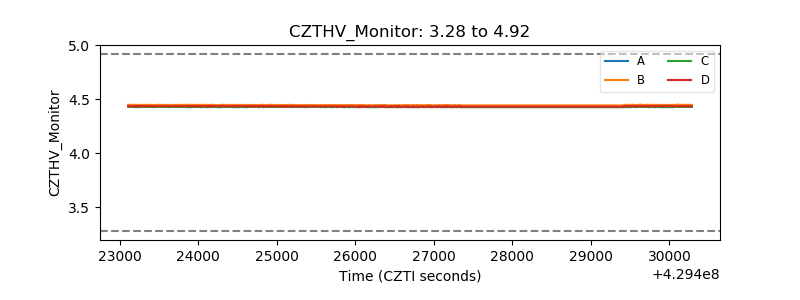 |
| D_VDD | 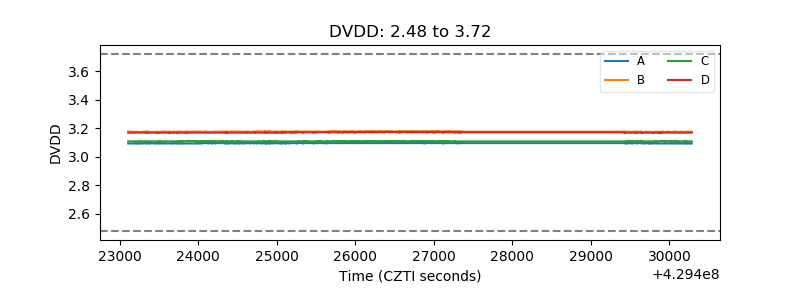 |
| Temperature 1 | 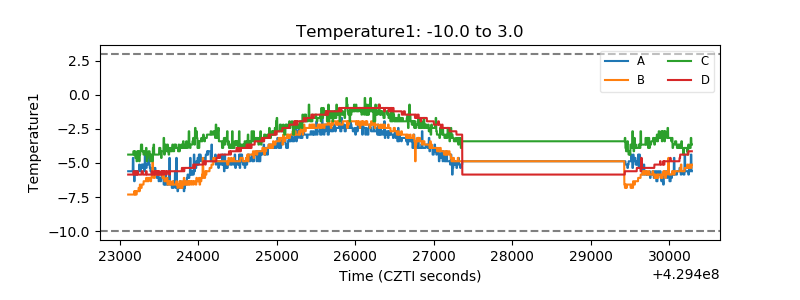 |
| Veto HV Monitor | 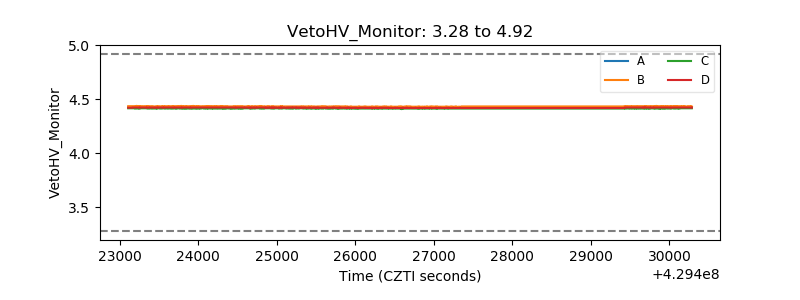 |
| Veto LLD | 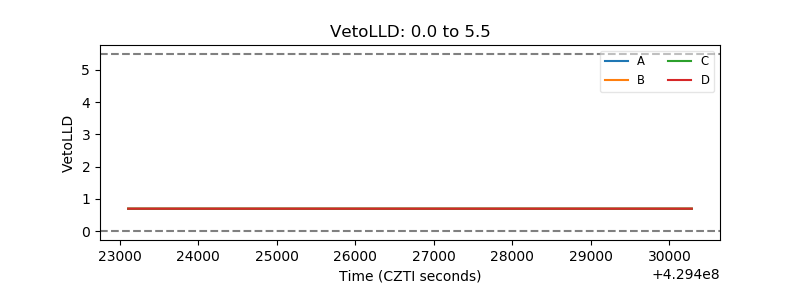 |
| Alpha Counter | 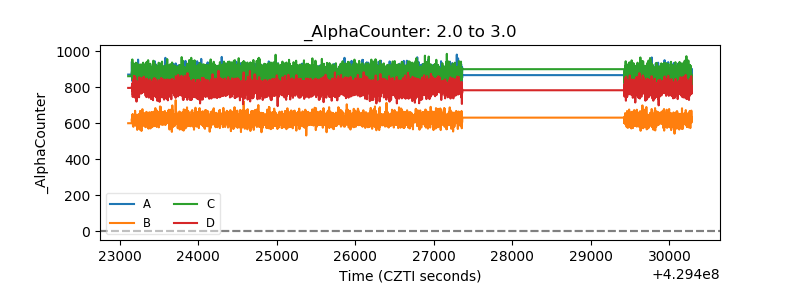 |
| _CPM_Rate | 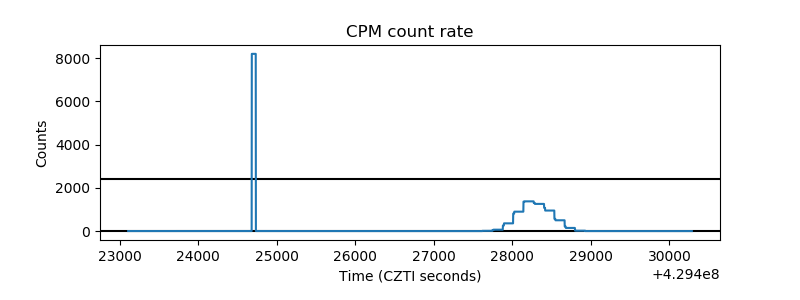 |
| CZT Counter | 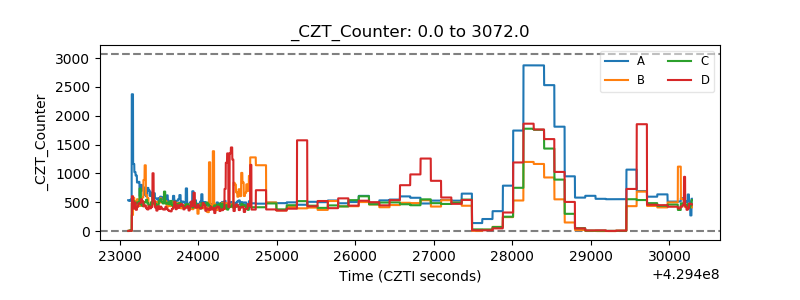 |
| +2.5 Volts monitor | 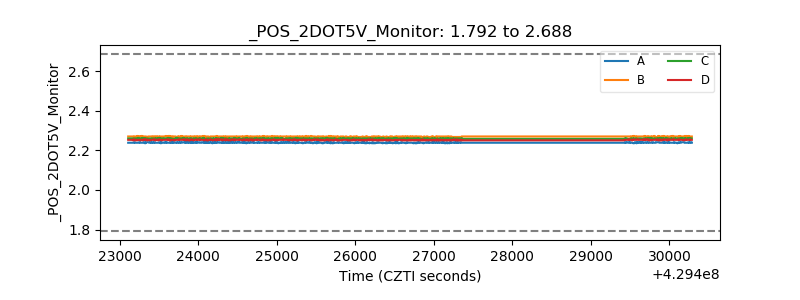 |
| +5 Volts monitor |  |
| _ROLL_ROT | 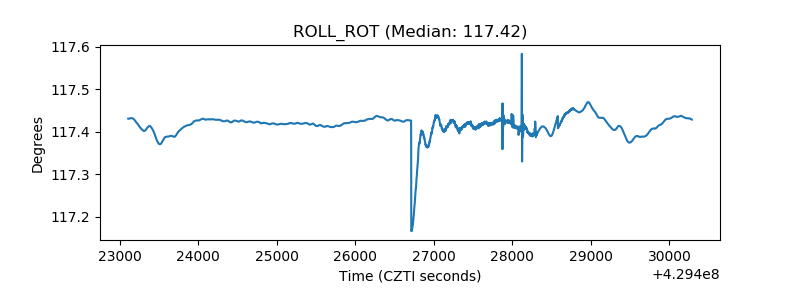 |
| _Roll_DEC | 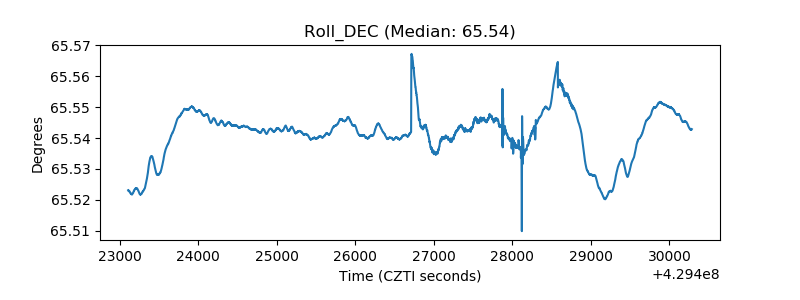 |
| _Roll_RA | 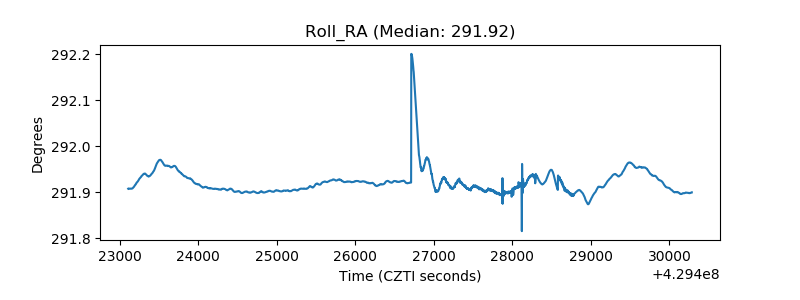 |
| Veto Counter | 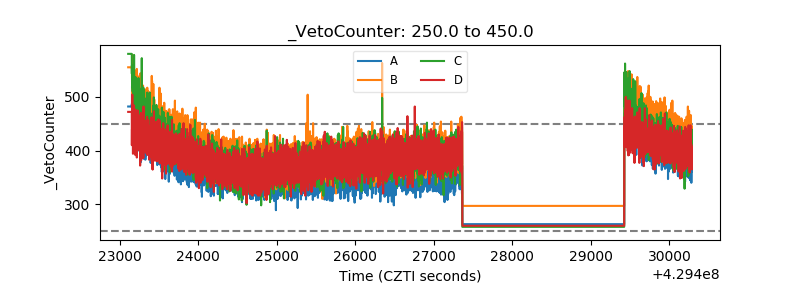 |