| Param | Original file | Final file |
|---|---|---|
| Filename | modeM0/AS1A12_102T01_9000005812_42548cztM0_level2.fits | modeM0/AS1A12_102T01_9000005812_42548cztM0_level2_quad_clean.evt |
| Size (bytes) | 305,196,480 | 84,692,160 |
| Size | 291.1 MB | 80.8 MB |
| Events in quadrant A | 2,737,999 | 577,758 |
| Events in quadrant B | 2,451,925 | 582,426 |
| Events in quadrant C | 2,282,685 | 556,808 |
| Events in quadrant D | 3,438,228 | 499,802 |
| Mode M0 | |||
|---|---|---|---|
| Quadrant | BADHDUFLAG | Total packets | Discarded packets |
| A | 0 | 10995 | 2 |
| B | 0 | 10769 | 2 |
| C | 0 | 9946 | 2 |
| D | 0 | 13565 | 2 |
| Mode M9 | |||
|---|---|---|---|
| Quadrant | BADHDUFLAG | Total packets | Discarded packets |
| A | 0 | 26 | 0 |
| B | 0 | 27 | 0 |
| C | 0 | 27 | 0 |
| D | 0 | 27 | 0 |
| Mode SS | |||
|---|---|---|---|
| Quadrant | BADHDUFLAG | Total packets | Discarded packets |
| A | 0 | 102 | 0 |
| B | 0 | 102 | 0 |
| C | 0 | 102 | 0 |
| D | 0 | 102 | 0 |
| Quadrant | Total seconds | Saturated seconds | Saturation percentage |
|---|---|---|---|
| A | 4956 | 11 | 0.221953% |
| B | 4956 | 109 | 2.199354% |
| C | 4956 | 2 | 0.040355% |
| D | 4956 | 213 | 4.297821% |
Noise dominated data is calculated using 1-second bins in cleaned event files. If a bin has >2000 counts, and if more than 50% of those come from <1% of pixels, then it is considered to be noise-dominated and hence unusable.
| Quadrant | # 1 sec bins | Bins with >0 counts | Bins with >2000 counts | High rate bins dominated by noise | Noise dominated (total time) | Noise dominated (detector-on time) | Marked lightcurve |
|---|---|---|---|---|---|---|---|
| A | 7078 | 4957 | 5 | 5 | 0.07% | 0.10% | 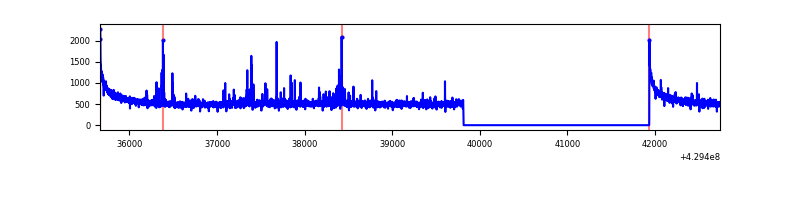 |
| B | 7078 | 4957 | 85 | 85 | 1.20% | 1.71% | 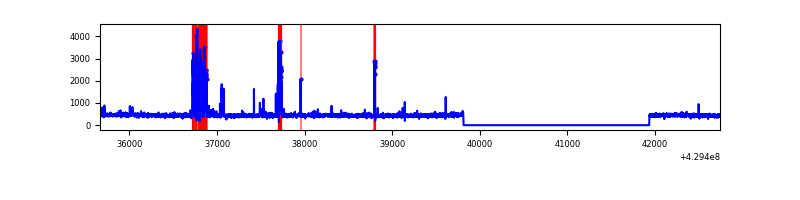 |
| C | 7078 | 4957 | 0 | 0 | 0.00% | 0.00% | 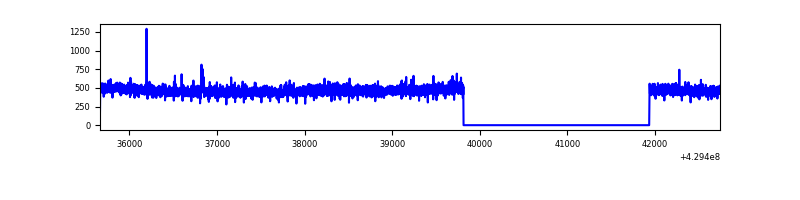 |
| D | 7078 | 4957 | 159 | 159 | 2.25% | 3.21% | 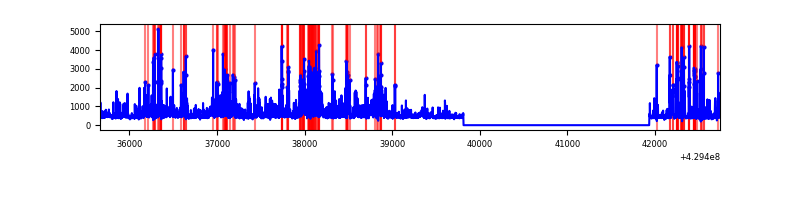 |
Top three noisy pixels from each quadrant. If the there are fewer than three noisy pixels in the level2.evt file, extra rows are filled as -1
| Pixel properties | Quadrant properties | ||||||
|---|---|---|---|---|---|---|---|
| Quadrant | DetID | PixID | Counts | Sigma | Mean | Median | Sigma |
| A | 10 | 83 | 524892 | 4709.03 | 549 | 537 | 111.4 |
| A | 2 | 79 | 51493 | 457.62 | 549 | 537 | 111.4 |
| A | 13 | 248 | 34083 | 301.26 | 549 | 537 | 111.4 |
| B | 5 | 172 | 242701 | 2352.22 | 538 | 524 | 103.0 |
| B | 5 | 255 | 70866 | 683.22 | 538 | 524 | 103.0 |
| B | 0 | 245 | 25278 | 240.43 | 538 | 524 | 103.0 |
| C | 15 | 214 | 211019 | 1717.15 | 529 | 531 | 122.6 |
| C | 14 | 254 | 10056 | 77.7 | 529 | 531 | 122.6 |
| C | 13 | 61 | 3427 | 23.63 | 529 | 531 | 122.6 |
| D | 1 | 52 | 779423 | 6103.77 | 524 | 508 | 127.6 |
| D | 13 | 249 | 215027 | 1681.02 | 524 | 508 | 127.6 |
| D | 12 | 233 | 192129 | 1501.59 | 524 | 508 | 127.6 |
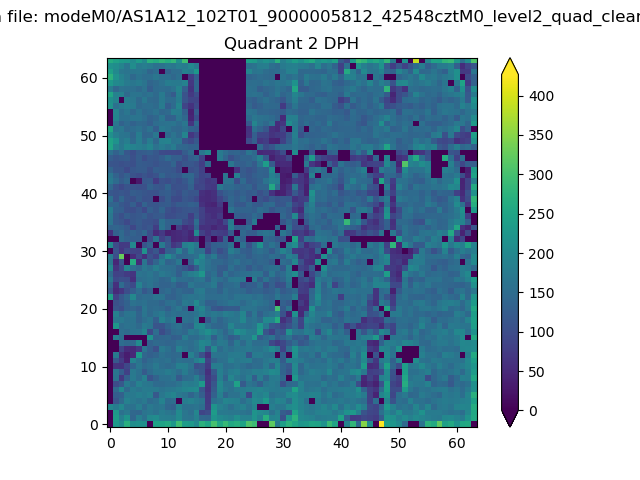
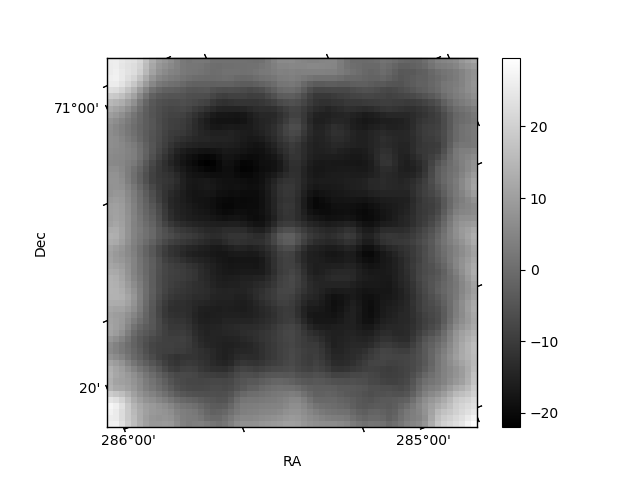
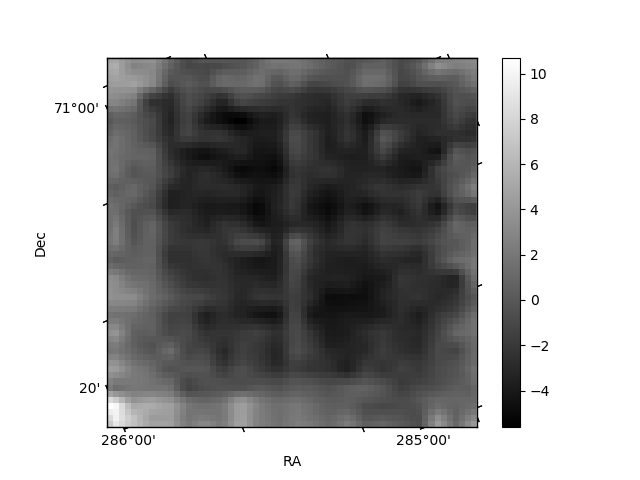
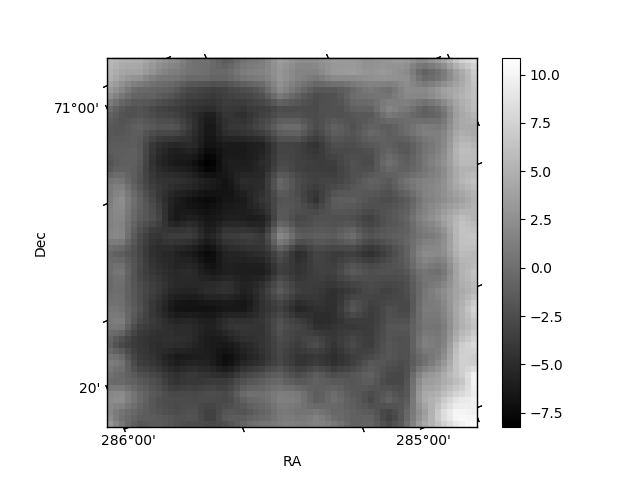
Histogram calculated using DETX and DETY for each event in the final _common_clean file
| Quadrant A | 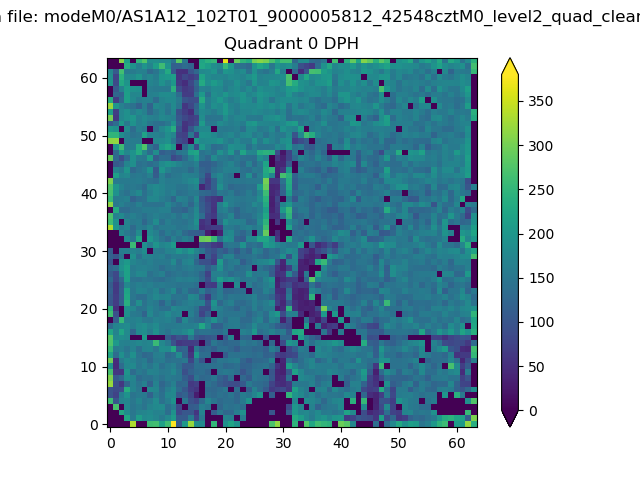 |
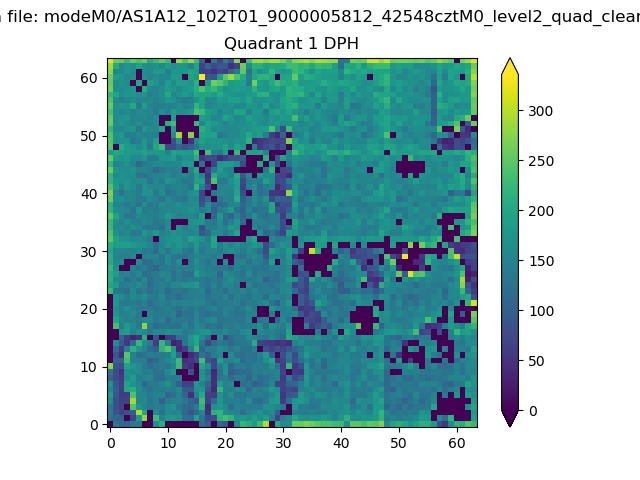 |
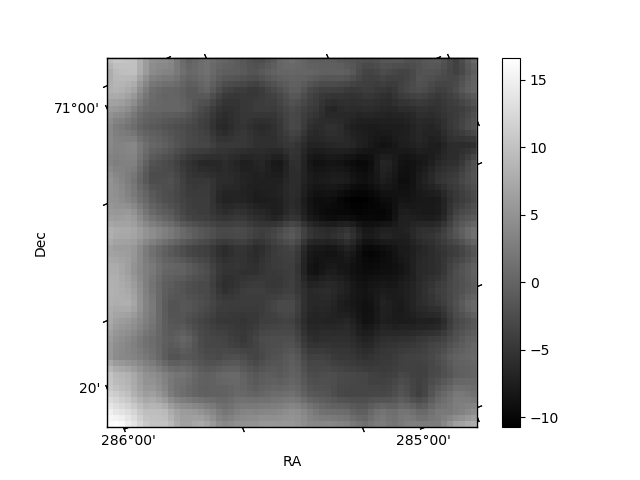
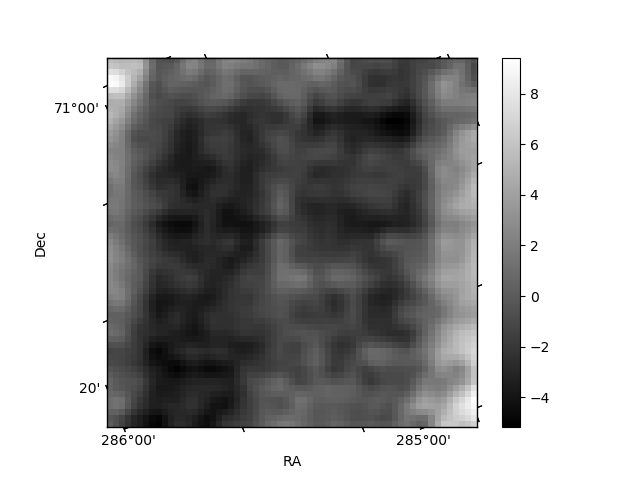
Quadrant B |
|---|---|---|---|
| Quadrant D | 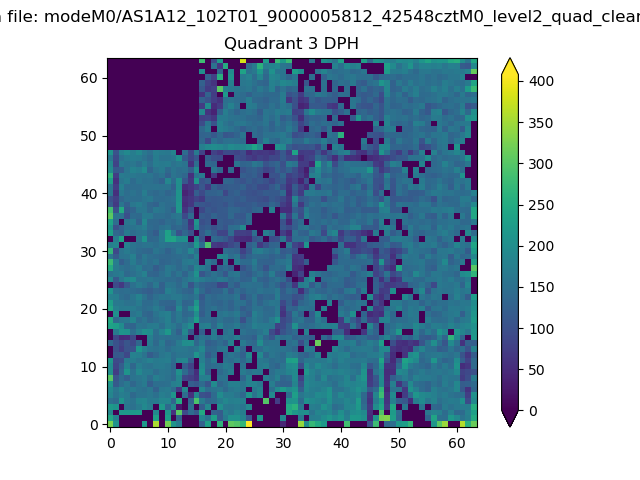 |
 |
Quadrant C |
| Plot type | Count rate plots | Images |
|---|---|---|
| Comparison with Poisson distribution Blue bars denote a histogram of data divided into 1 sec bins. Red curve is a Poisson curve with rate = median count rate of data. |
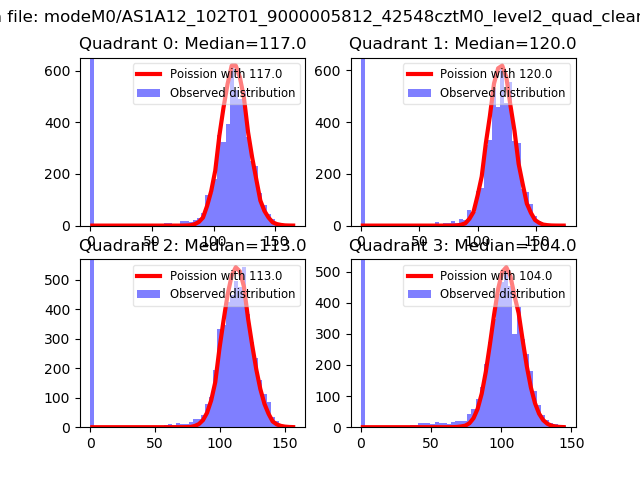 |
 |
| Quadrant-wise count rates Data is divided into 100 sec bins |
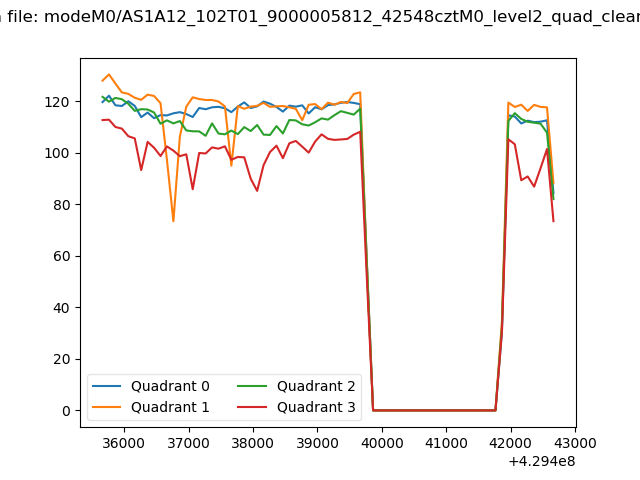 |
|
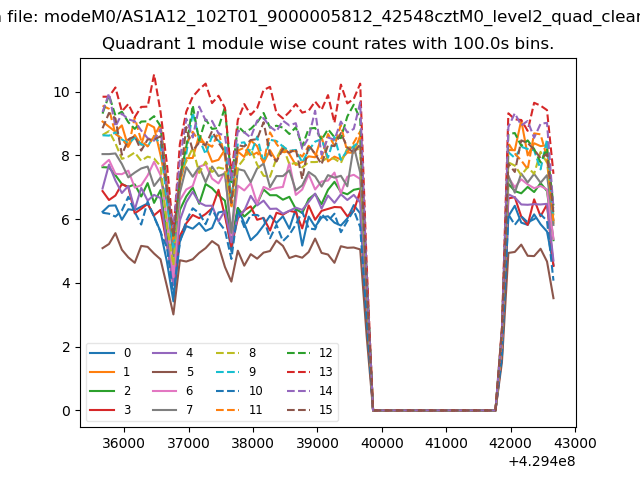
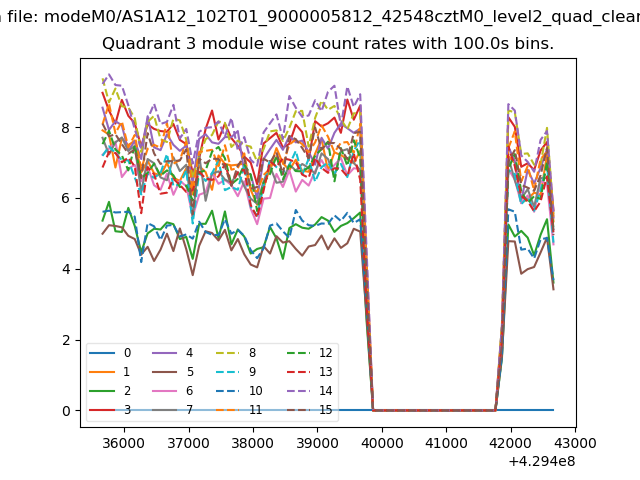
| Module-wise count rates for Quadrant A Data is divided into 100 sec bins |
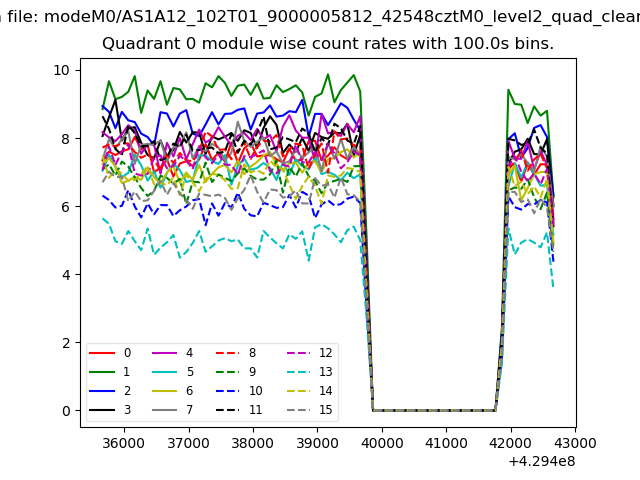 |
 |
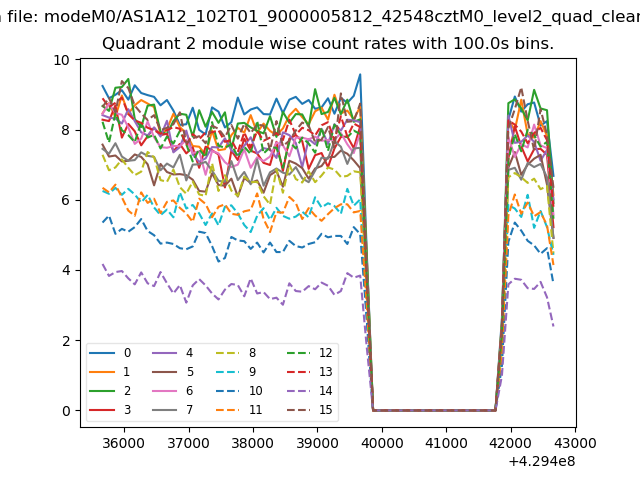
| Module-wise count rates for Quadrant B Data is divided into 100 sec bins |
 |
 |
| Module-wise count rates for Quadrant C Data is divided into 100 sec bins |
 |
 |
| Module-wise count rates for Quadrant D Data is divided into 100 sec bins |
 |
 |
| Parameter | Plot |
|---|---|
| CZT HV Monitor | 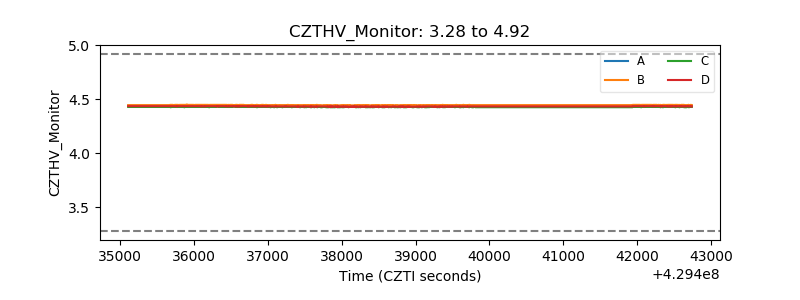 |
| D_VDD | 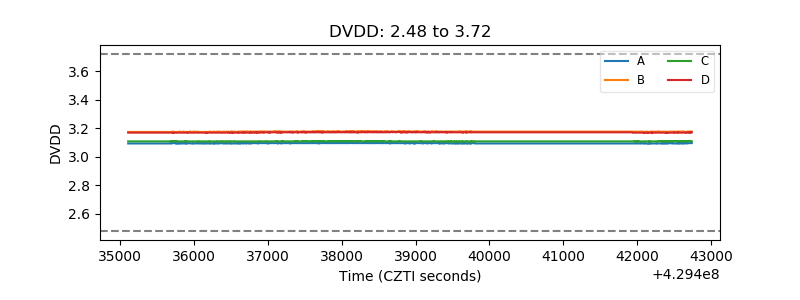 |
| Temperature 1 | 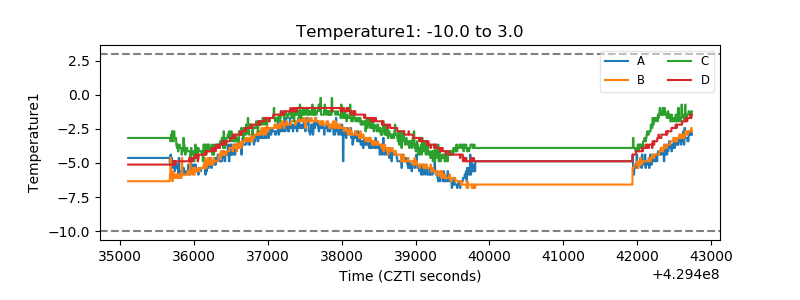 |
| Veto HV Monitor | 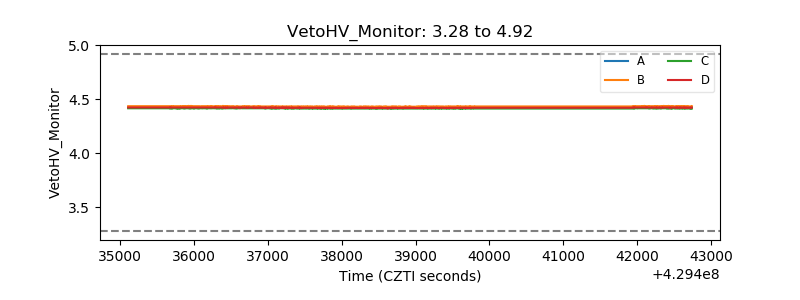 |
| Veto LLD | 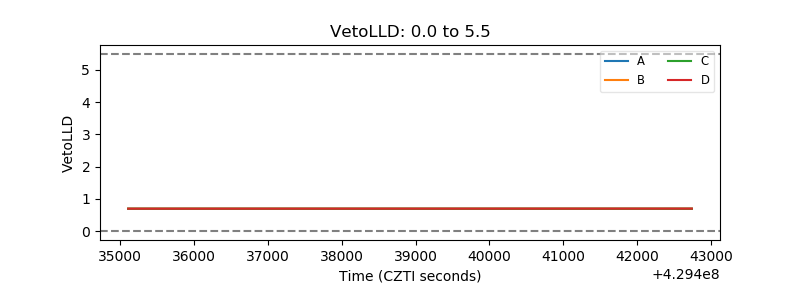 |
| Alpha Counter | 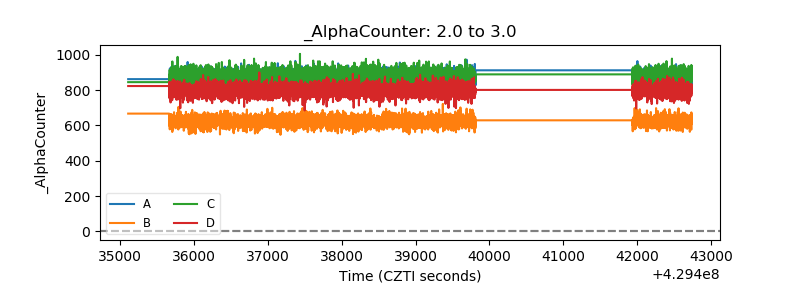 |
| _CPM_Rate | 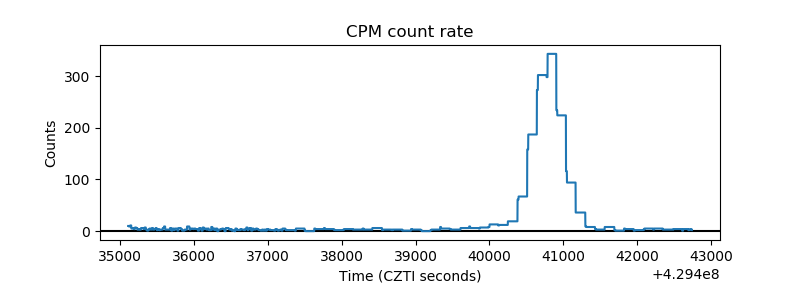 |
| CZT Counter | 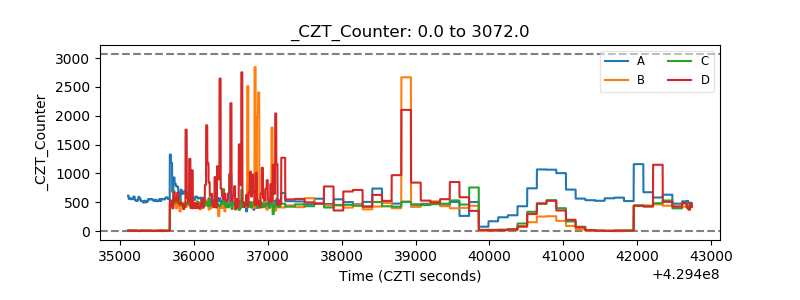 |
| +2.5 Volts monitor | 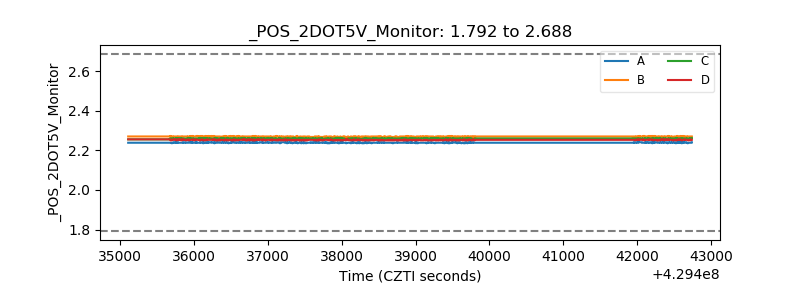 |
| +5 Volts monitor | 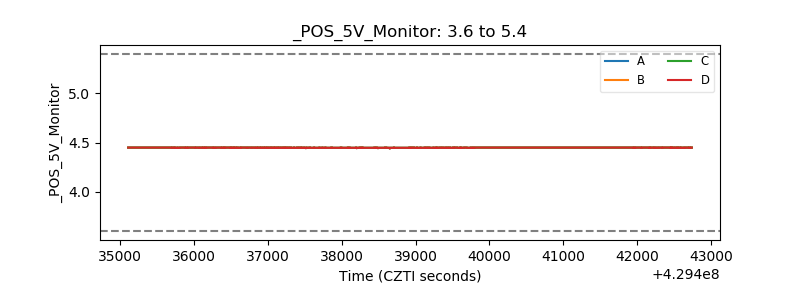 |
| _ROLL_ROT | 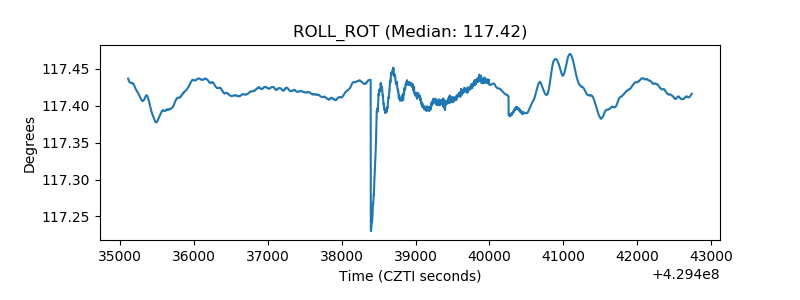 |
| _Roll_DEC | 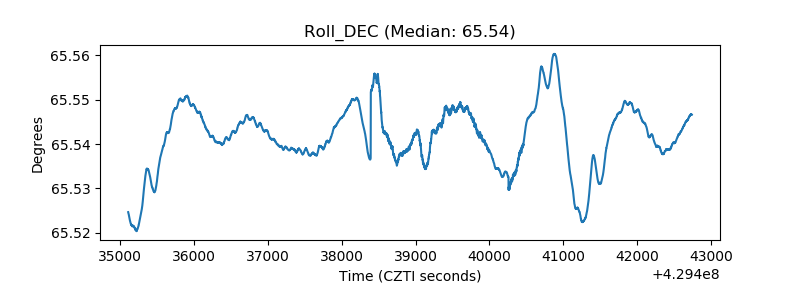 |
| _Roll_RA | 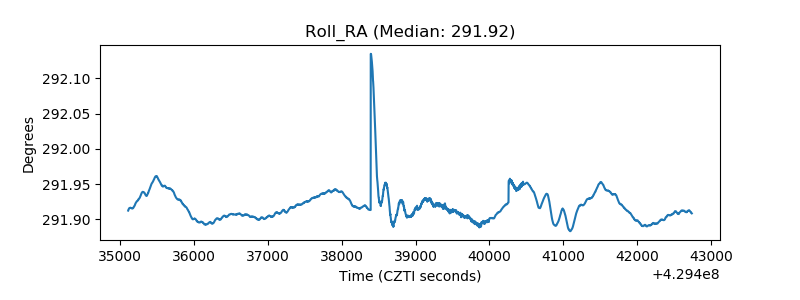 |
| Veto Counter | 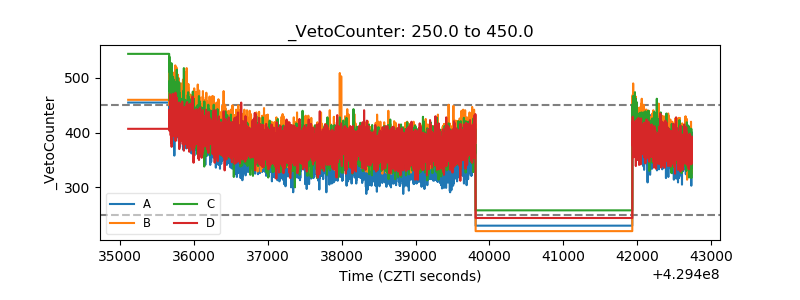 |