| Param | Original file | Final file |
|---|---|---|
| Filename | modeM0/AS1A12_102T01_9000005812_42549cztM0_level2.fits | modeM0/AS1A12_102T01_9000005812_42549cztM0_level2_quad_clean.evt |
| Size (bytes) | 332,968,320 | 83,367,360 |
| Size | 317.5 MB | 79.5 MB |
| Events in quadrant A | 2,718,101 | 568,817 |
| Events in quadrant B | 2,374,394 | 573,534 |
| Events in quadrant C | 2,283,304 | 542,808 |
| Events in quadrant D | 4,556,858 | 485,378 |
| Mode M0 | |||
|---|---|---|---|
| Quadrant | BADHDUFLAG | Total packets | Discarded packets |
| A | 0 | 11057 | 2 |
| B | 0 | 10662 | 2 |
| C | 0 | 10106 | 2 |
| D | 0 | 17035 | 2 |
| Mode M9 | |||
|---|---|---|---|
| Quadrant | BADHDUFLAG | Total packets | Discarded packets |
| A | 0 | 25 | 0 |
| B | 0 | 26 | 0 |
| C | 0 | 26 | 0 |
| D | 0 | 26 | 0 |
| Mode SS | |||
|---|---|---|---|
| Quadrant | BADHDUFLAG | Total packets | Discarded packets |
| A | 0 | 104 | 0 |
| B | 0 | 104 | 0 |
| C | 0 | 104 | 0 |
| D | 0 | 104 | 0 |
| Quadrant | Total seconds | Saturated seconds | Saturation percentage |
|---|---|---|---|
| A | 5042 | 11 | 0.218167% |
| B | 5042 | 57 | 1.130504% |
| C | 5042 | 2 | 0.039667% |
| D | 5042 | 334 | 6.624355% |
Noise dominated data is calculated using 1-second bins in cleaned event files. If a bin has >2000 counts, and if more than 50% of those come from <1% of pixels, then it is considered to be noise-dominated and hence unusable.
| Quadrant | # 1 sec bins | Bins with >0 counts | Bins with >2000 counts | High rate bins dominated by noise | Noise dominated (total time) | Noise dominated (detector-on time) | Marked lightcurve |
|---|---|---|---|---|---|---|---|
| A | 7075 | 5043 | 3 | 3 | 0.04% | 0.06% | 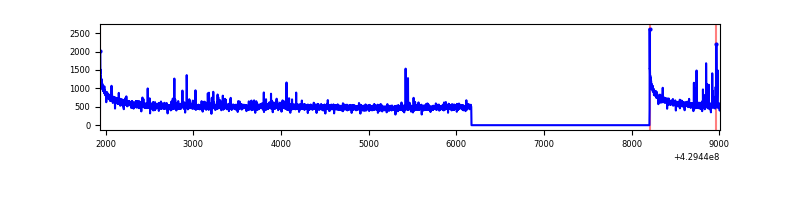 |
| B | 7075 | 5043 | 41 | 41 | 0.58% | 0.81% | 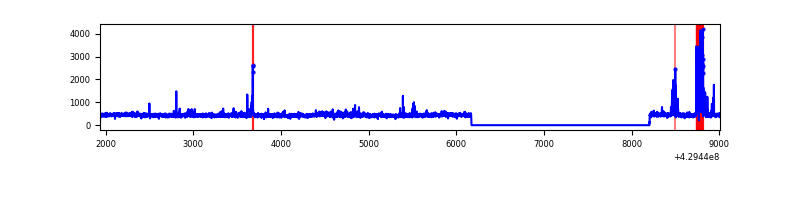 |
| C | 7075 | 5043 | 0 | 0 | 0.00% | 0.00% | 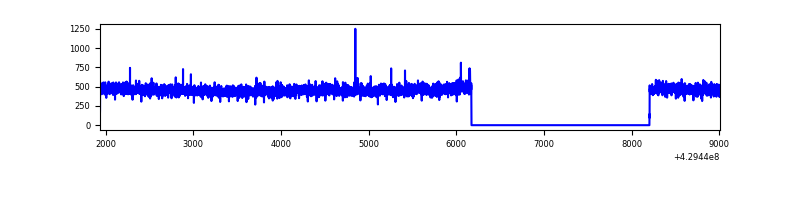 |
| D | 7075 | 5043 | 316 | 316 | 4.47% | 6.27% | 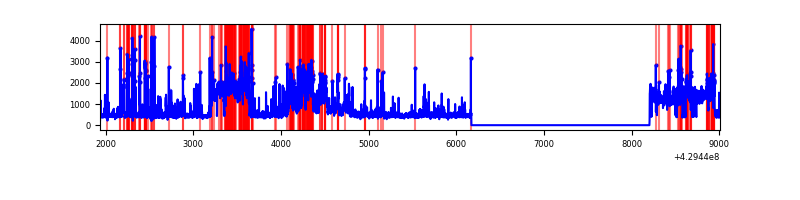 |
Top three noisy pixels from each quadrant. If the there are fewer than three noisy pixels in the level2.evt file, extra rows are filled as -1
| Pixel properties | Quadrant properties | ||||||
|---|---|---|---|---|---|---|---|
| Quadrant | DetID | PixID | Counts | Sigma | Mean | Median | Sigma |
| A | 10 | 83 | 538436 | 4872.58 | 544 | 534 | 110.4 |
| A | 2 | 79 | 39942 | 356.98 | 544 | 534 | 110.4 |
| A | 13 | 248 | 25105 | 222.58 | 544 | 534 | 110.4 |
| B | 5 | 172 | 180898 | 1749.09 | 537 | 523 | 103.1 |
| B | 0 | 245 | 51803 | 497.26 | 537 | 523 | 103.1 |
| B | 15 | 85 | 18594 | 175.23 | 537 | 523 | 103.1 |
| C | 15 | 214 | 216159 | 1763.76 | 528 | 530 | 122.3 |
| C | 14 | 254 | 6670 | 50.22 | 528 | 530 | 122.3 |
| C | 13 | 61 | 3559 | 24.78 | 528 | 530 | 122.3 |
| D | 2 | 16 | 1107309 | 8646.58 | 523 | 509 | 128.0 |
| D | 2 | 249 | 574159 | 4481.49 | 523 | 509 | 128.0 |
| D | 1 | 52 | 276715 | 2157.78 | 523 | 509 | 128.0 |
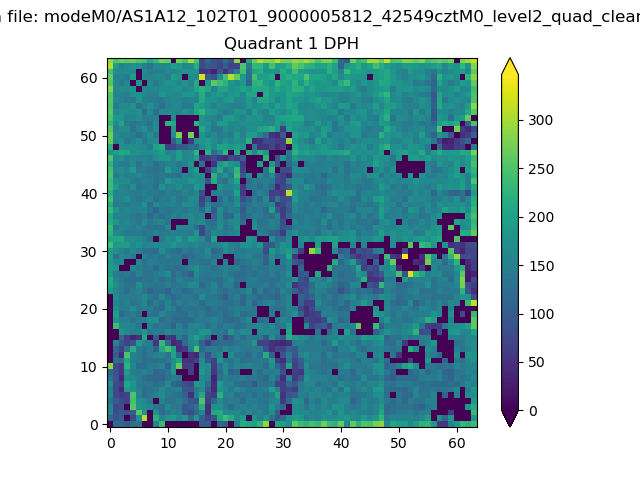
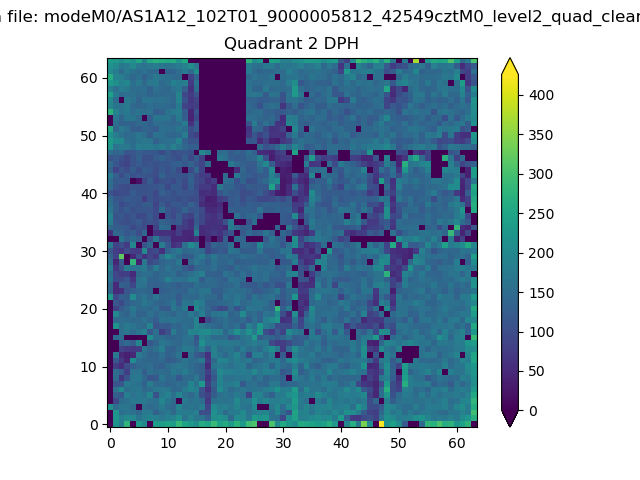
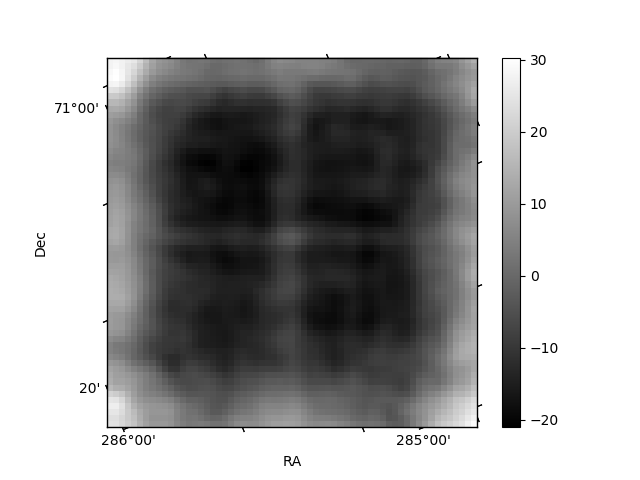
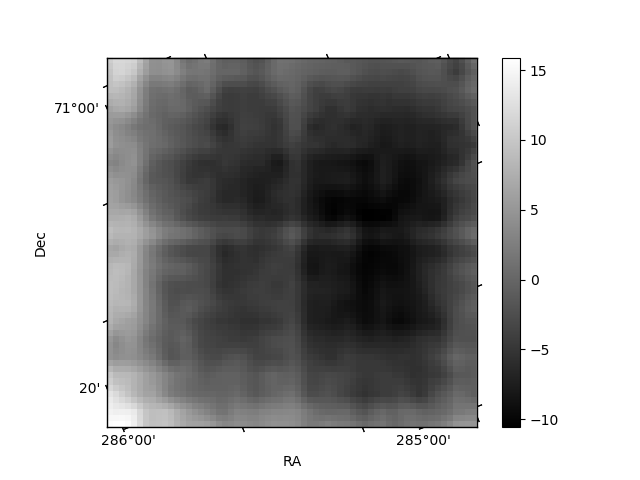
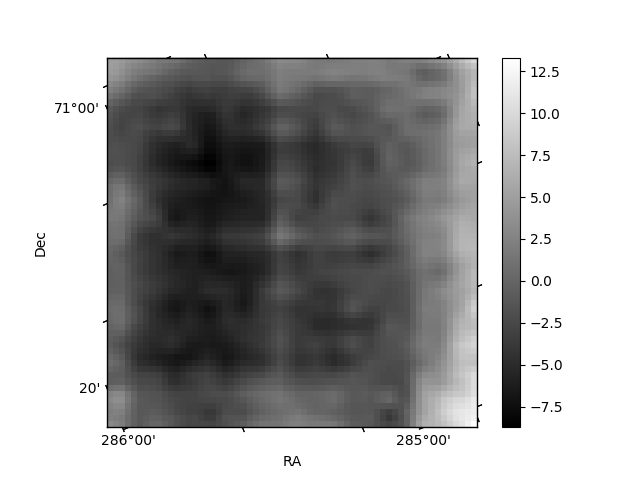
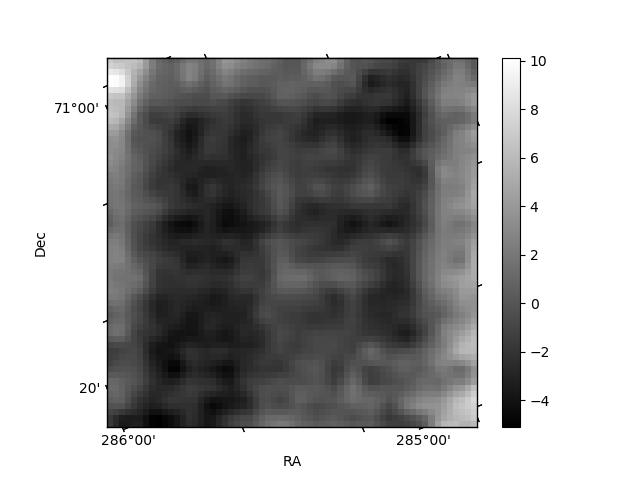
Histogram calculated using DETX and DETY for each event in the final _common_clean file
| Quadrant A |  |
 |
Quadrant B |
|---|---|---|---|
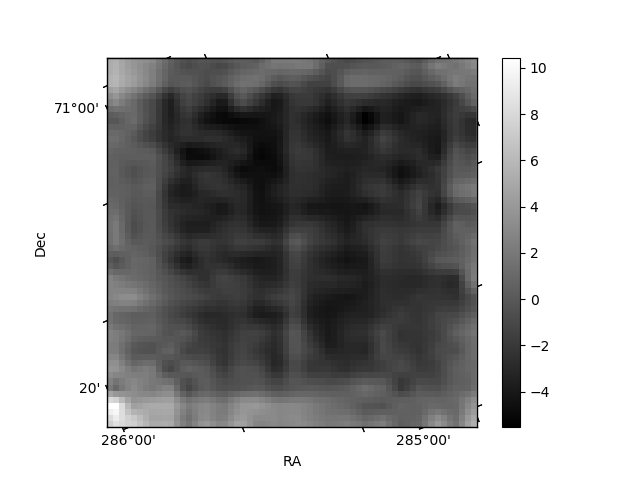
| Quadrant D | 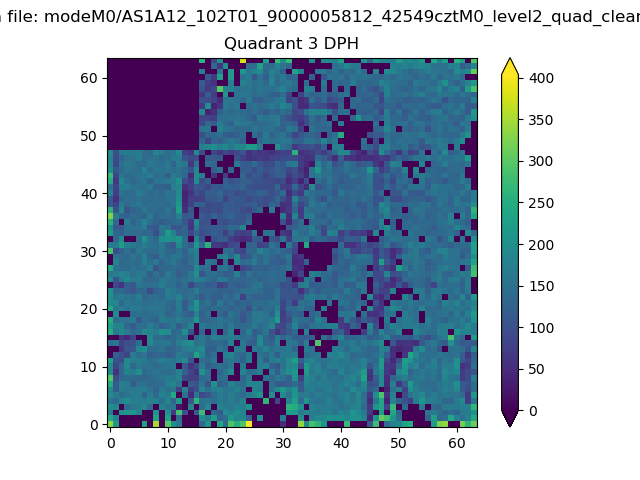 |
 |
Quadrant C |
| Plot type | Count rate plots | Images |
|---|---|---|
| Comparison with Poisson distribution Blue bars denote a histogram of data divided into 1 sec bins. Red curve is a Poisson curve with rate = median count rate of data. |
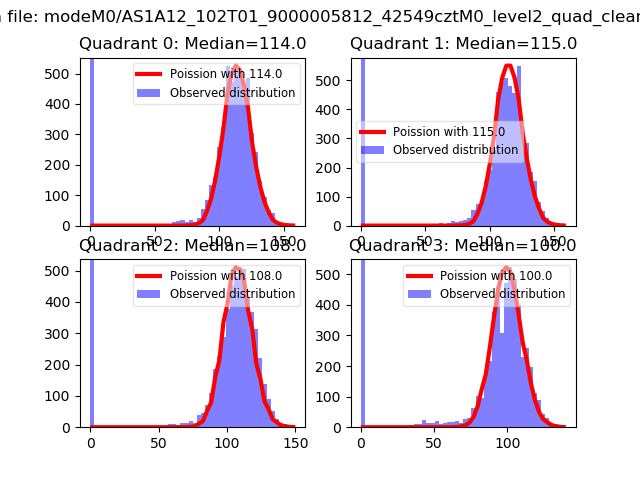 |
 |
| Quadrant-wise count rates Data is divided into 100 sec bins |
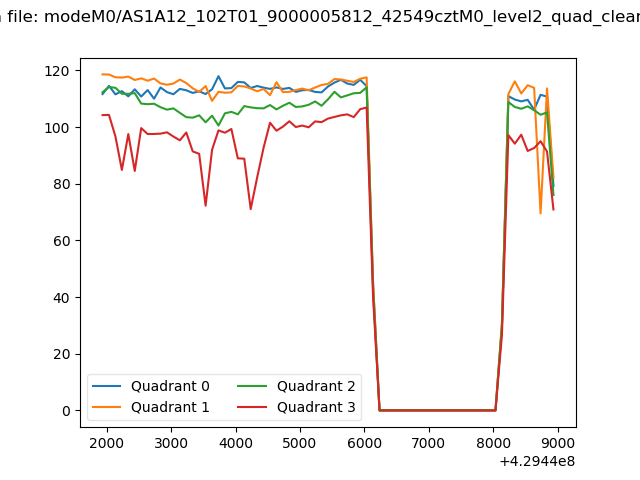 |
|
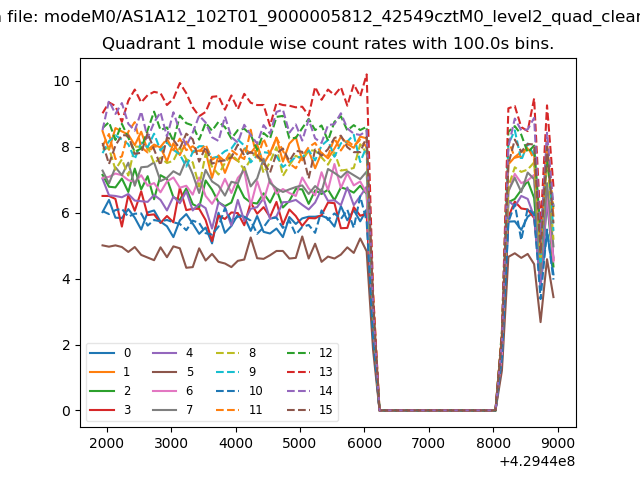
| Module-wise count rates for Quadrant A Data is divided into 100 sec bins |
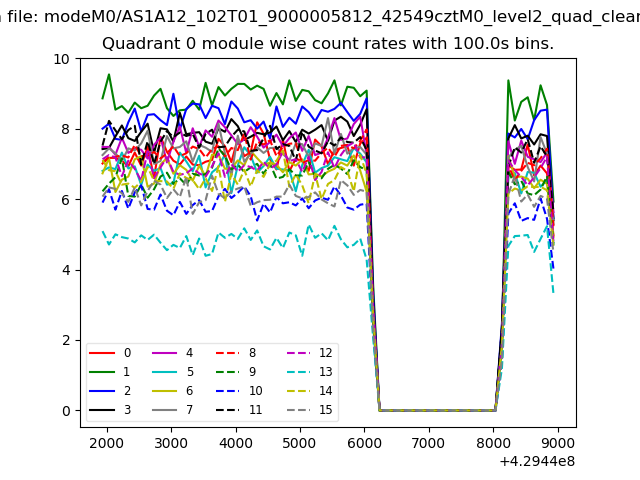 |
 |
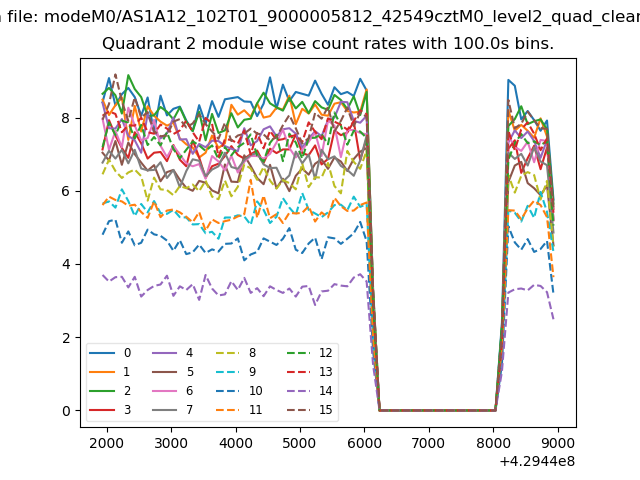
| Module-wise count rates for Quadrant B Data is divided into 100 sec bins |
 |
 |
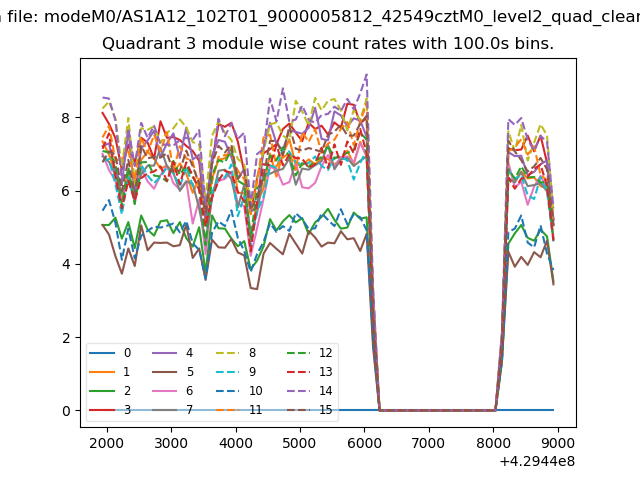
| Module-wise count rates for Quadrant C Data is divided into 100 sec bins |
 |
 |
| Module-wise count rates for Quadrant D Data is divided into 100 sec bins |
 |
 |
| Parameter | Plot |
|---|---|
| CZT HV Monitor | 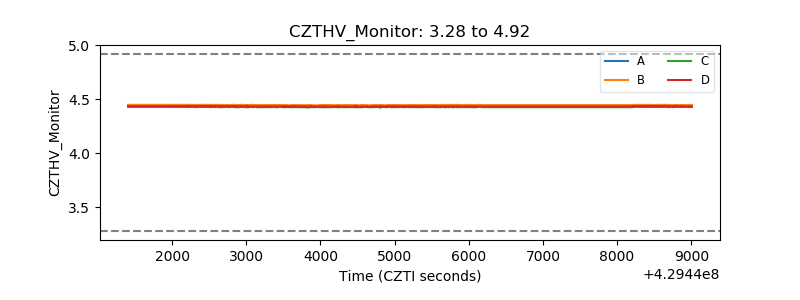 |
| D_VDD | 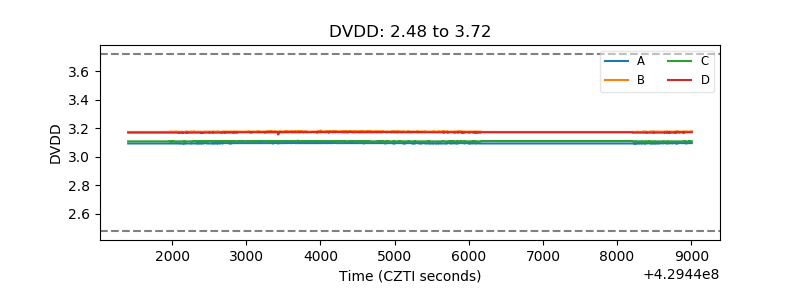 |
| Temperature 1 | 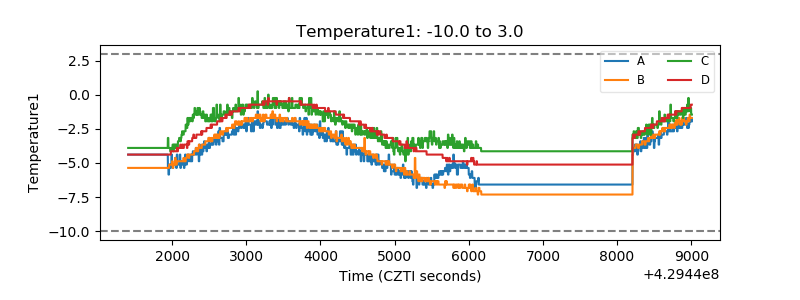 |
| Veto HV Monitor | 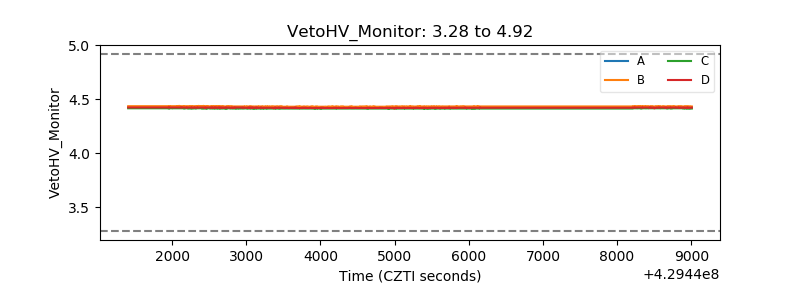 |
| Veto LLD | 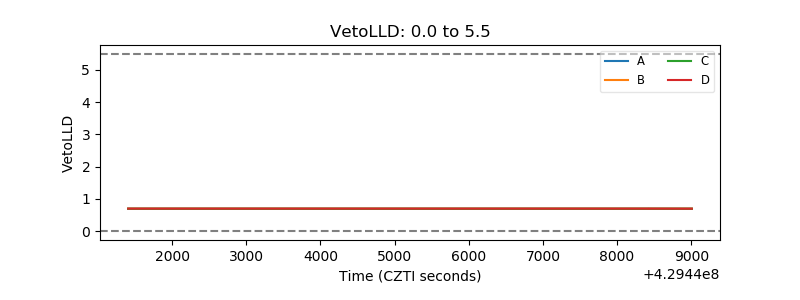 |
| Alpha Counter | 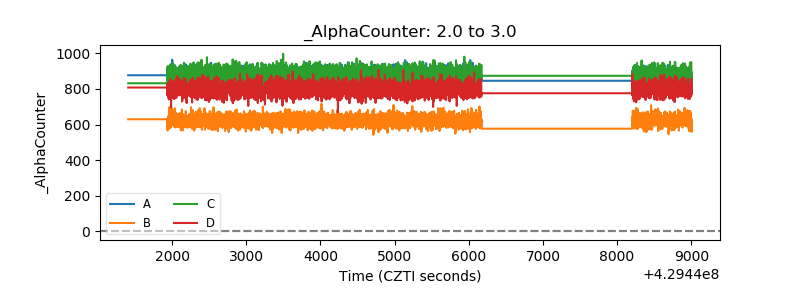 |
| _CPM_Rate | 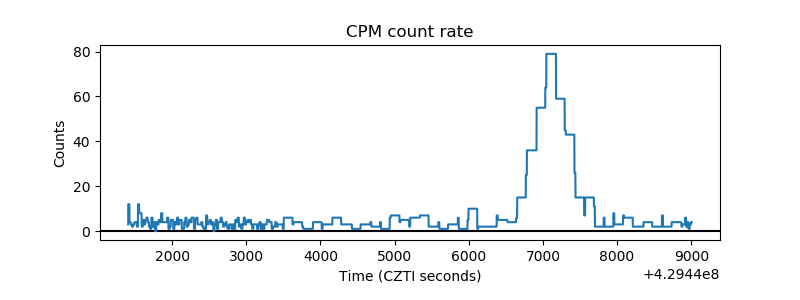 |
| CZT Counter | 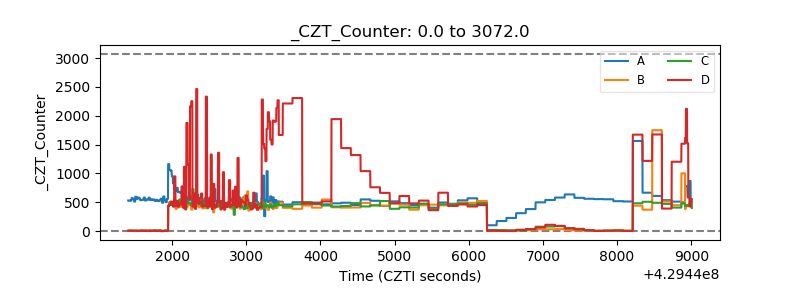 |
| +2.5 Volts monitor | 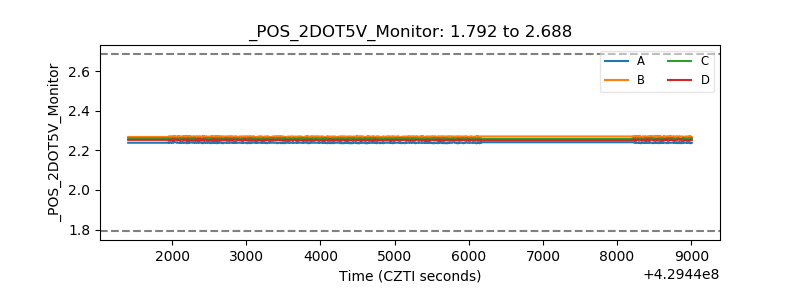 |
| +5 Volts monitor |  |
| _ROLL_ROT |  |
| _Roll_DEC | 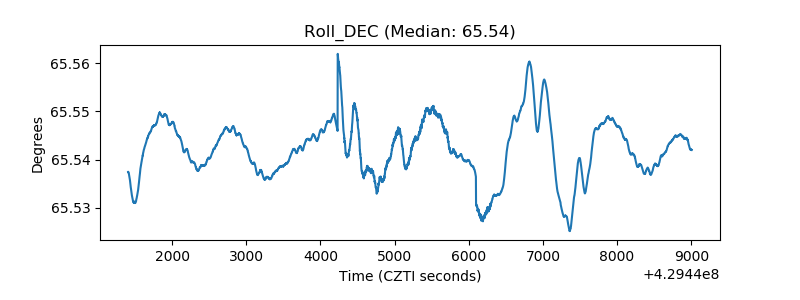 |
| _Roll_RA | 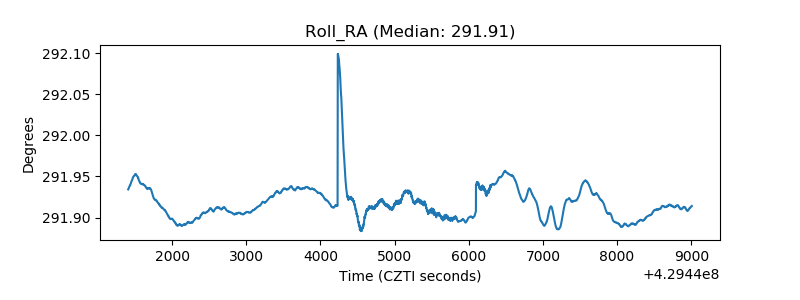 |
| Veto Counter | 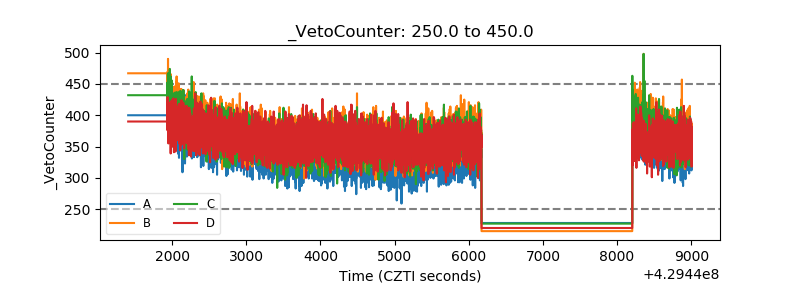 |