| Param | Original file | Final file |
|---|---|---|
| Filename | modeM0/AS1A12_102T01_9000005812_42550cztM0_level2.fits | modeM0/AS1A12_102T01_9000005812_42550cztM0_level2_quad_clean.evt |
| Size (bytes) | 329,996,160 | 90,933,120 |
| Size | 314.7 MB | 86.7 MB |
| Events in quadrant A | 3,077,320 | 612,246 |
| Events in quadrant B | 2,639,087 | 617,027 |
| Events in quadrant C | 2,497,512 | 585,783 |
| Events in quadrant D | 3,565,901 | 546,679 |
| Mode M0 | |||
|---|---|---|---|
| Quadrant | BADHDUFLAG | Total packets | Discarded packets |
| A | 0 | 12651 | 2 |
| B | 0 | 11923 | 2 |
| C | 0 | 11205 | 2 |
| D | 0 | 14550 | 2 |
| Mode M9 | |||
|---|---|---|---|
| Quadrant | BADHDUFLAG | Total packets | Discarded packets |
| A | 0 | 21 | 0 |
| B | 0 | 22 | 0 |
| C | 0 | 22 | 0 |
| D | 0 | 22 | 0 |
| Mode SS | |||
|---|---|---|---|
| Quadrant | BADHDUFLAG | Total packets | Discarded packets |
| A | 0 | 116 | 0 |
| B | 0 | 116 | 0 |
| C | 0 | 116 | 0 |
| D | 0 | 116 | 0 |
| Quadrant | Total seconds | Saturated seconds | Saturation percentage |
|---|---|---|---|
| A | 5590 | 21 | 0.375671% |
| B | 5590 | 67 | 1.198569% |
| C | 5590 | 3 | 0.053667% |
| D | 5590 | 77 | 1.377460% |
Noise dominated data is calculated using 1-second bins in cleaned event files. If a bin has >2000 counts, and if more than 50% of those come from <1% of pixels, then it is considered to be noise-dominated and hence unusable.
| Quadrant | # 1 sec bins | Bins with >0 counts | Bins with >2000 counts | High rate bins dominated by noise | Noise dominated (total time) | Noise dominated (detector-on time) | Marked lightcurve |
|---|---|---|---|---|---|---|---|
| A | 7324 | 5591 | 12 | 12 | 0.16% | 0.21% | 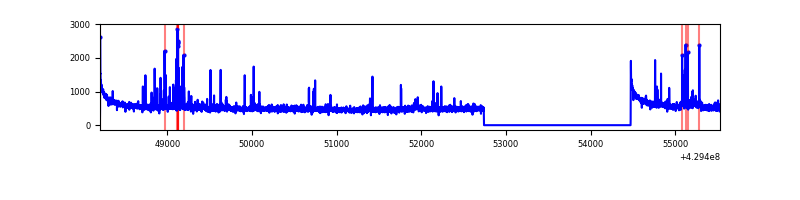 |
| B | 7324 | 5591 | 48 | 48 | 0.66% | 0.86% |  |
| C | 7324 | 5591 | 0 | 0 | 0.00% | 0.00% | 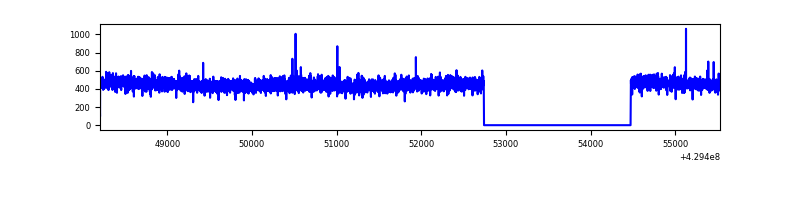 |
| D | 7324 | 5591 | 71 | 71 | 0.97% | 1.27% | 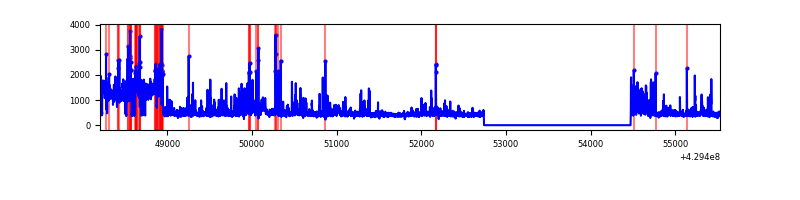 |
Top three noisy pixels from each quadrant. If the there are fewer than three noisy pixels in the level2.evt file, extra rows are filled as -1
| Pixel properties | Quadrant properties | ||||||
|---|---|---|---|---|---|---|---|
| Quadrant | DetID | PixID | Counts | Sigma | Mean | Median | Sigma |
| A | 10 | 83 | 585382 | 4818.56 | 593 | 580 | 121.4 |
| A | 2 | 79 | 115421 | 946.25 | 593 | 580 | 121.4 |
| A | 13 | 248 | 47653 | 387.86 | 593 | 580 | 121.4 |
| B | 5 | 172 | 225370 | 1980.55 | 586 | 570 | 113.5 |
| B | 0 | 245 | 41901 | 364.14 | 586 | 570 | 113.5 |
| B | 0 | 186 | 26024 | 224.26 | 586 | 570 | 113.5 |
| C | 15 | 214 | 236910 | 1763.34 | 578 | 581 | 134.0 |
| C | 14 | 254 | 4160 | 26.7 | 578 | 581 | 134.0 |
| C | 12 | 249 | 4084 | 26.14 | 578 | 581 | 134.0 |
| D | 2 | 16 | 596798 | 4262.32 | 579 | 563 | 139.9 |
| D | 1 | 52 | 444721 | 3175.16 | 579 | 563 | 139.9 |
| D | 2 | 249 | 85429 | 606.68 | 579 | 563 | 139.9 |
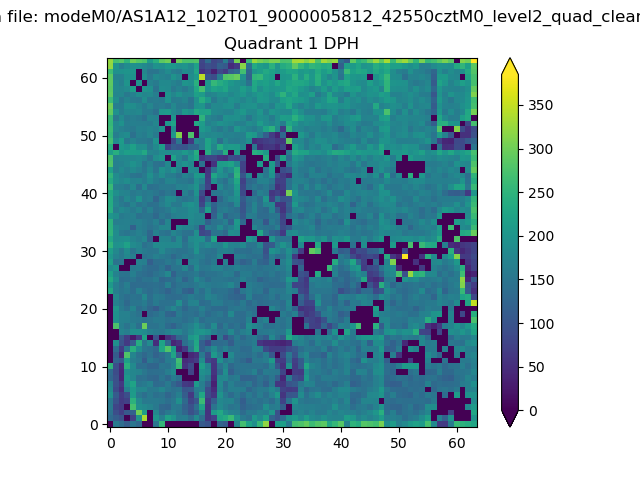
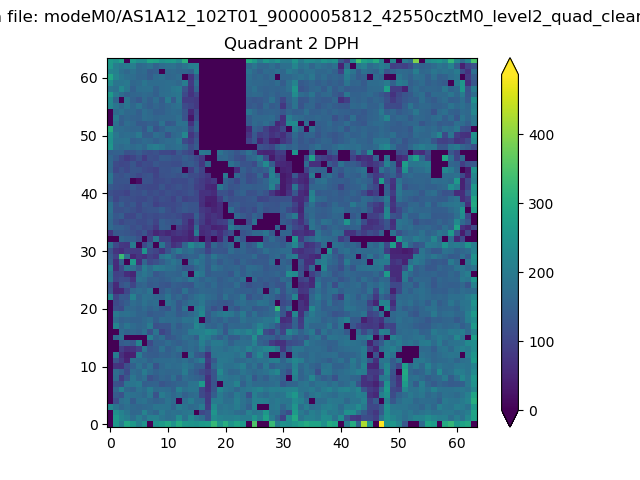
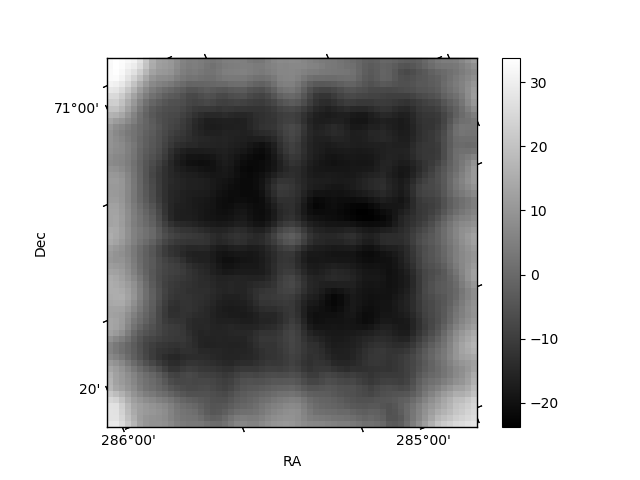
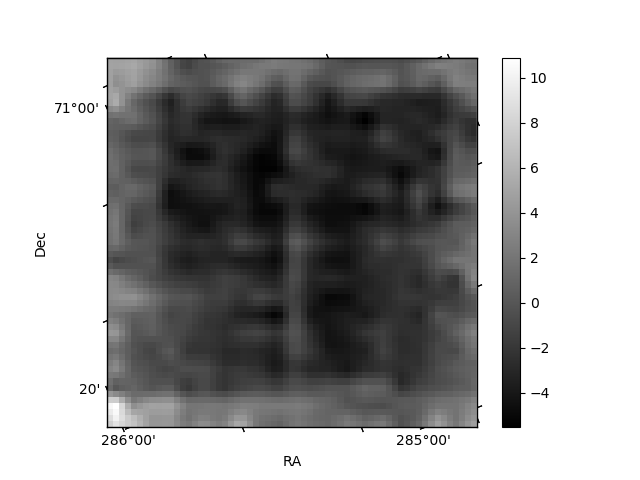
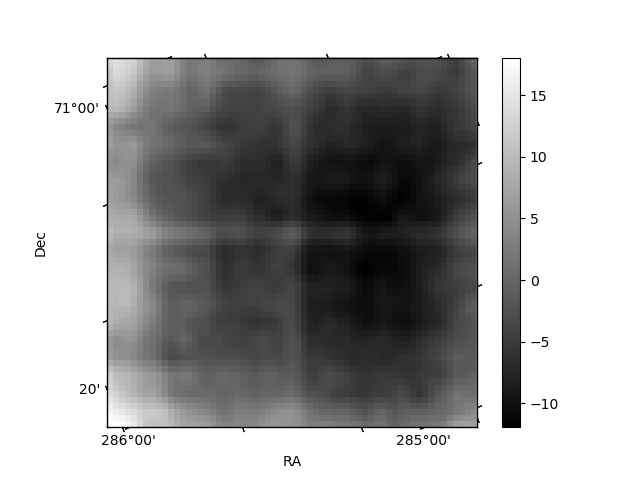
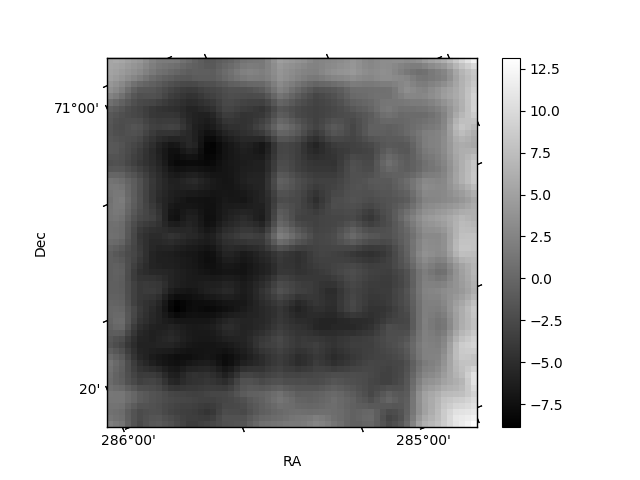
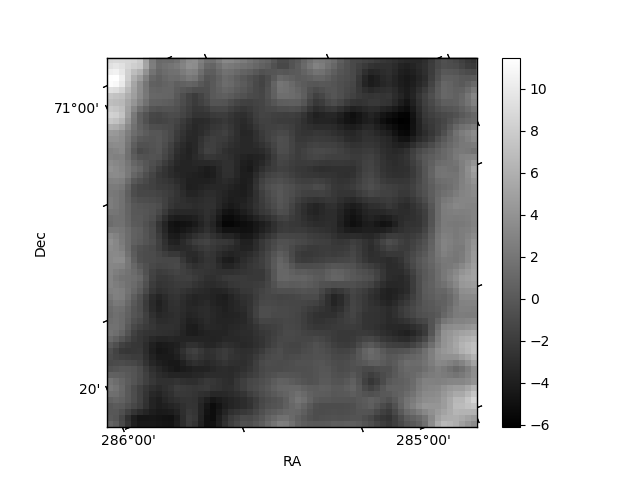
Histogram calculated using DETX and DETY for each event in the final _common_clean file
| Quadrant A | 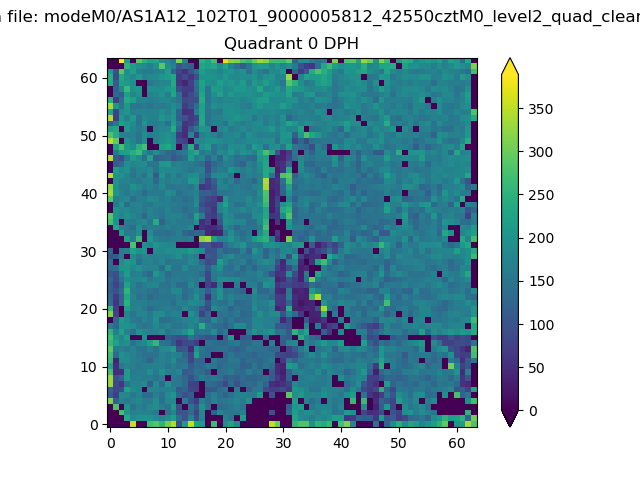 |
 |
Quadrant B |
|---|---|---|---|
| Quadrant D | 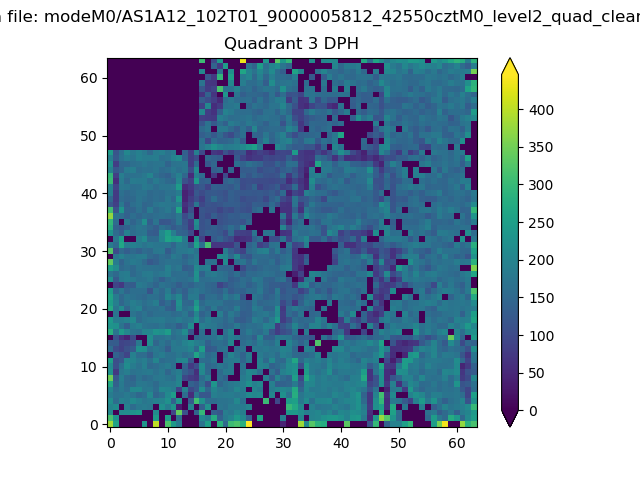 |
 |
Quadrant C |
| Plot type | Count rate plots | Images |
|---|---|---|
| Comparison with Poisson distribution Blue bars denote a histogram of data divided into 1 sec bins. Red curve is a Poisson curve with rate = median count rate of data. |
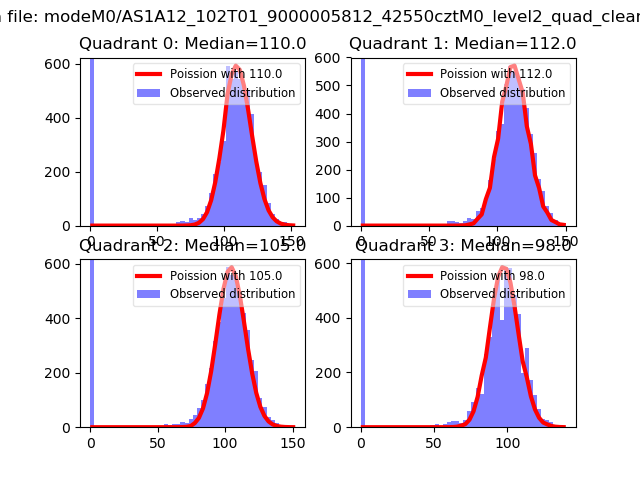 |
 |
| Quadrant-wise count rates Data is divided into 100 sec bins |
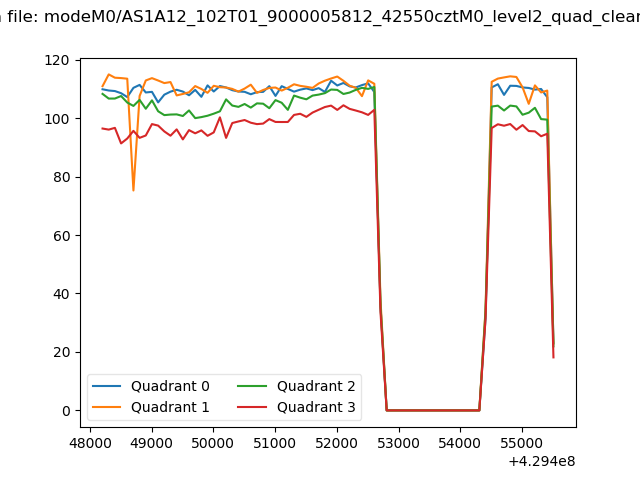 |
|
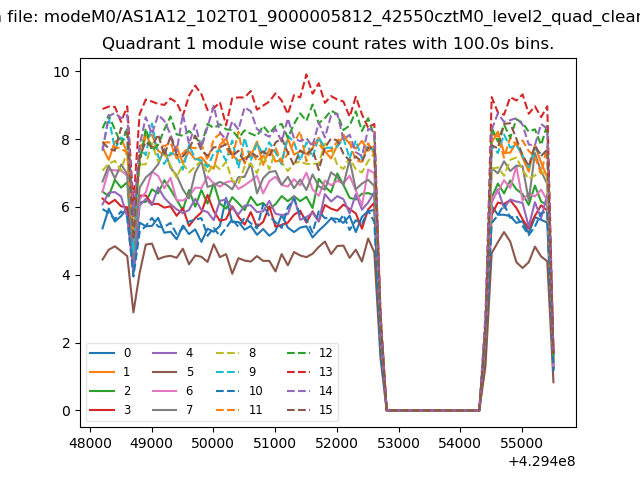
| Module-wise count rates for Quadrant A Data is divided into 100 sec bins |
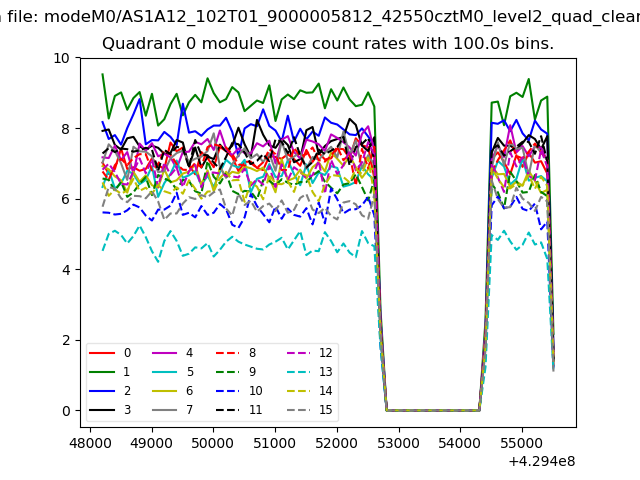 |
 |
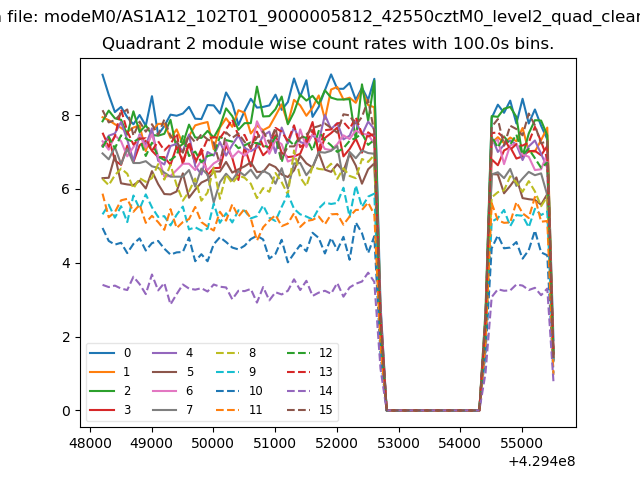
| Module-wise count rates for Quadrant B Data is divided into 100 sec bins |
 |
 |
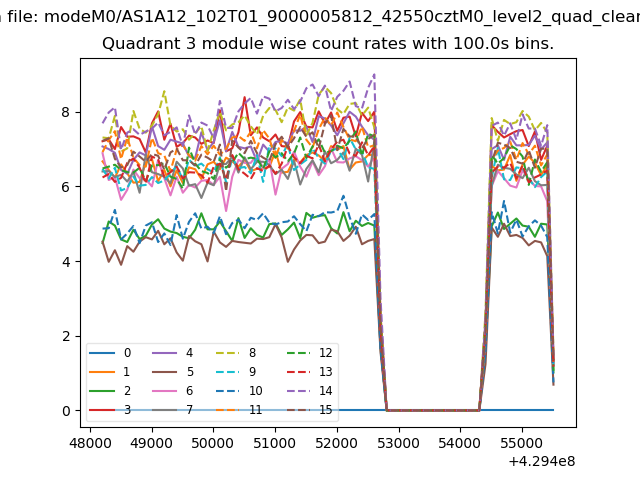
| Module-wise count rates for Quadrant C Data is divided into 100 sec bins |
 |
 |
| Module-wise count rates for Quadrant D Data is divided into 100 sec bins |
 |
 |
| Parameter | Plot |
|---|---|
| CZT HV Monitor | 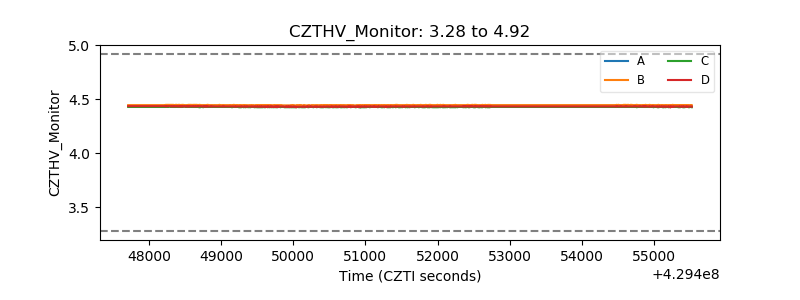 |
| D_VDD | 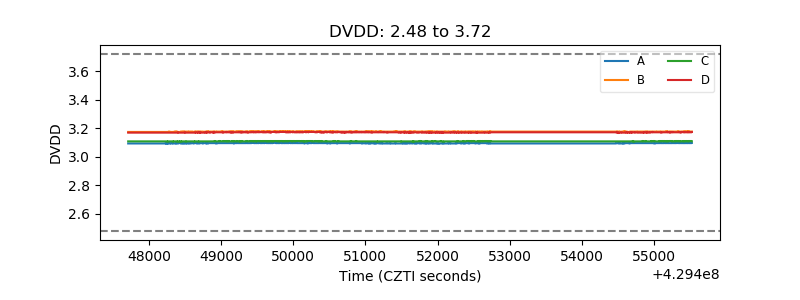 |
| Temperature 1 | 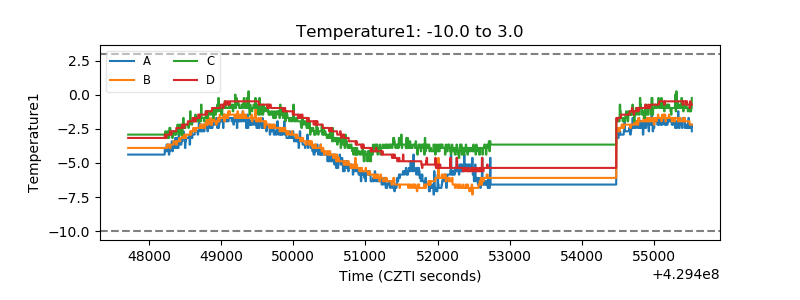 |
| Veto HV Monitor | 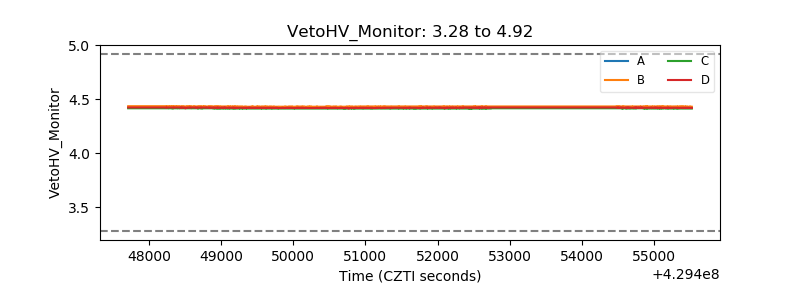 |
| Veto LLD | 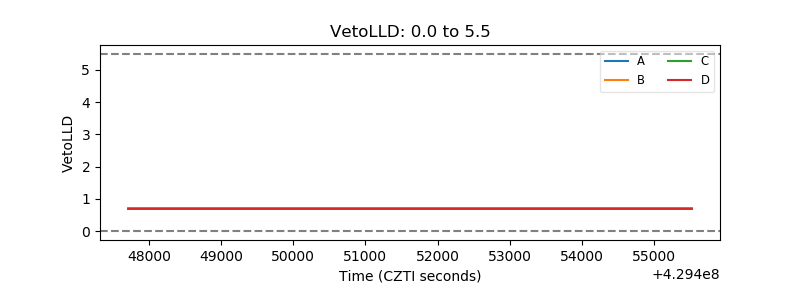 |
| Alpha Counter | 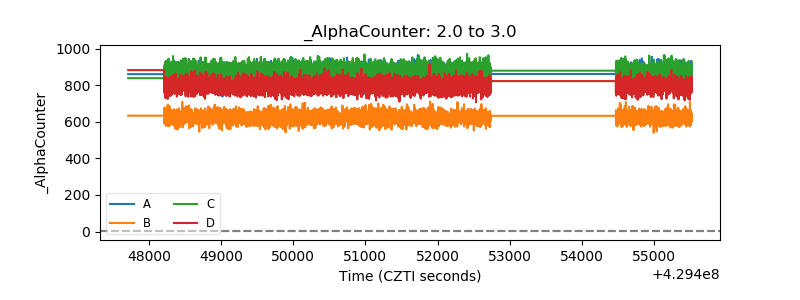 |
| _CPM_Rate | 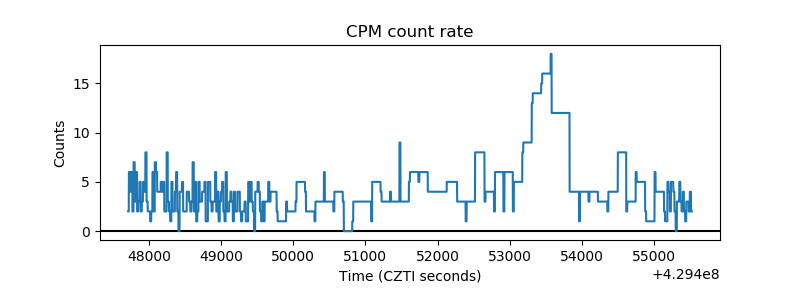 |
| CZT Counter | 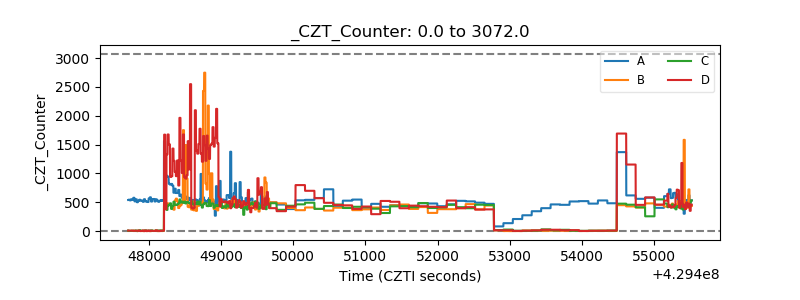 |
| +2.5 Volts monitor | 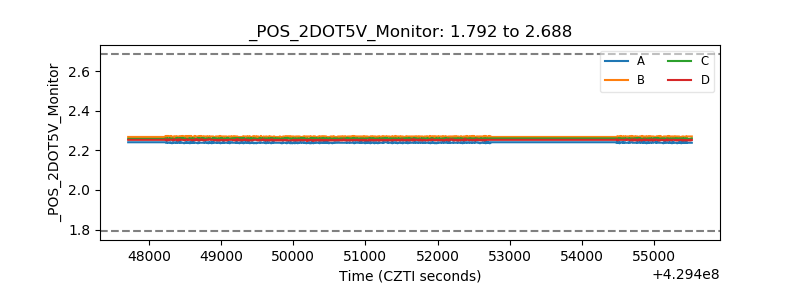 |
| +5 Volts monitor |  |
| _ROLL_ROT | 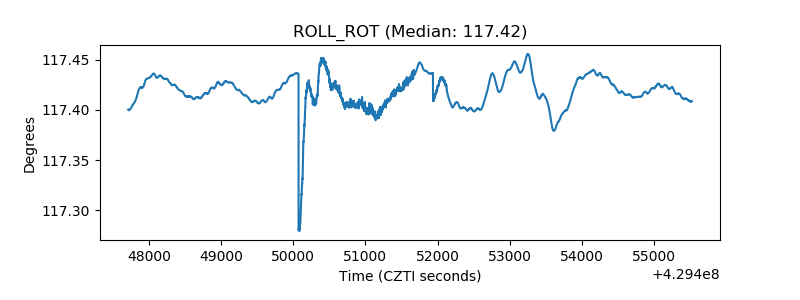 |
| _Roll_DEC | 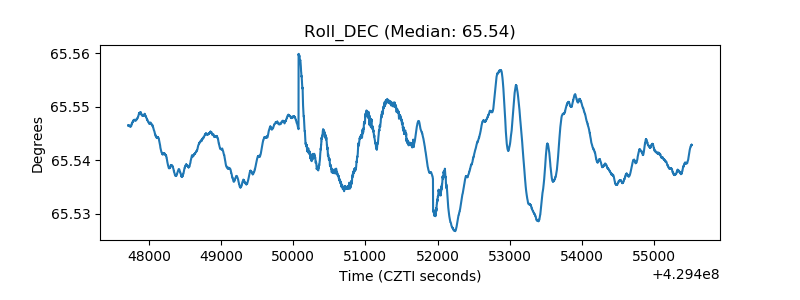 |
| _Roll_RA | 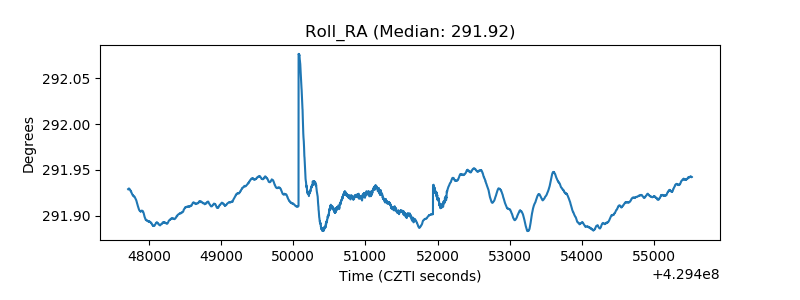 |
| Veto Counter | 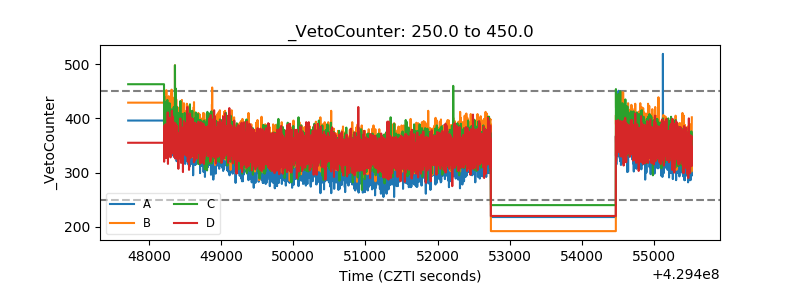 |