| Param | Original file | Final file |
|---|---|---|
| Filename | modeM0/AS1A12_102T01_9000005812_42551cztM0_level2.fits | modeM0/AS1A12_102T01_9000005812_42551cztM0_level2_quad_clean.evt |
| Size (bytes) | 317,681,280 | 91,641,600 |
| Size | 303.0 MB | 87.4 MB |
| Events in quadrant A | 3,047,105 | 616,177 |
| Events in quadrant B | 2,504,057 | 622,807 |
| Events in quadrant C | 2,555,252 | 591,511 |
| Events in quadrant D | 3,210,153 | 546,748 |
| Mode M0 | |||
|---|---|---|---|
| Quadrant | BADHDUFLAG | Total packets | Discarded packets |
| A | 0 | 12665 | 2 |
| B | 0 | 11667 | 2 |
| C | 0 | 11425 | 2 |
| D | 0 | 13764 | 2 |
| Mode M9 | |||
|---|---|---|---|
| Quadrant | BADHDUFLAG | Total packets | Discarded packets |
| A | 0 | 18 | 0 |
| B | 0 | 18 | 0 |
| C | 0 | 19 | 0 |
| D | 0 | 19 | 0 |
| Mode SS | |||
|---|---|---|---|
| Quadrant | BADHDUFLAG | Total packets | Discarded packets |
| A | 0 | 116 | 0 |
| B | 0 | 116 | 0 |
| C | 0 | 116 | 0 |
| D | 0 | 116 | 0 |
| Quadrant | Total seconds | Saturated seconds | Saturation percentage |
|---|---|---|---|
| A | 5684 | 16 | 0.281492% |
| B | 5684 | 27 | 0.475018% |
| C | 5683 | 3 | 0.052789% |
| D | 5683 | 83 | 1.460496% |
Noise dominated data is calculated using 1-second bins in cleaned event files. If a bin has >2000 counts, and if more than 50% of those come from <1% of pixels, then it is considered to be noise-dominated and hence unusable.
| Quadrant | # 1 sec bins | Bins with >0 counts | Bins with >2000 counts | High rate bins dominated by noise | Noise dominated (total time) | Noise dominated (detector-on time) | Marked lightcurve |
|---|---|---|---|---|---|---|---|
| A | 7118 | 5685 | 7 | 7 | 0.10% | 0.12% | 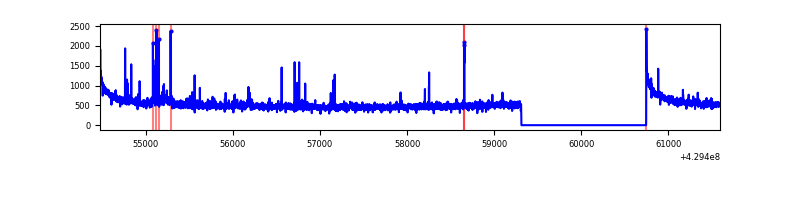 |
| B | 7118 | 5685 | 10 | 10 | 0.14% | 0.18% | 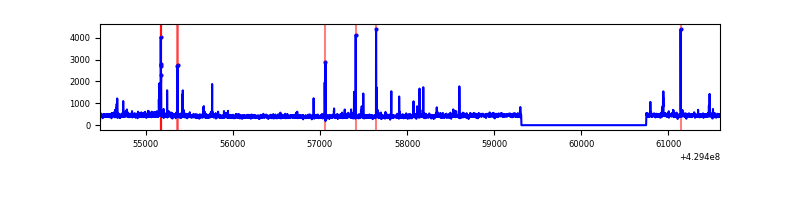 |
| C | 7117 | 5684 | 0 | 0 | 0.00% | 0.00% | 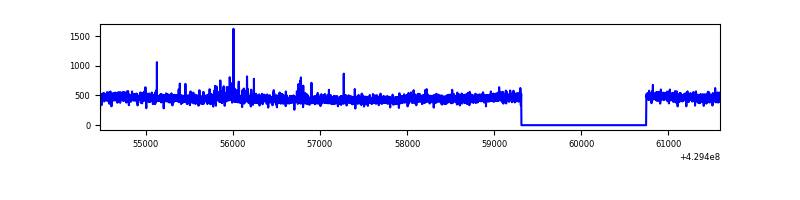 |
| D | 7117 | 5684 | 66 | 66 | 0.93% | 1.16% | 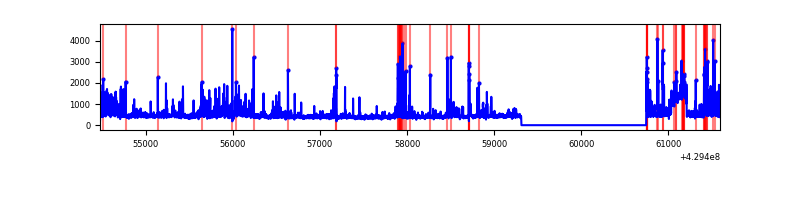 |
Top three noisy pixels from each quadrant. If the there are fewer than three noisy pixels in the level2.evt file, extra rows are filled as -1
| Pixel properties | Quadrant properties | ||||||
|---|---|---|---|---|---|---|---|
| Quadrant | DetID | PixID | Counts | Sigma | Mean | Median | Sigma |
| A | 10 | 83 | 591244 | 4777.56 | 602 | 589 | 123.6 |
| A | 2 | 79 | 73019 | 585.86 | 602 | 589 | 123.6 |
| A | 0 | 247 | 18269 | 143.01 | 602 | 589 | 123.6 |
| B | 5 | 172 | 66459 | 565.89 | 596 | 579 | 116.4 |
| B | 0 | 245 | 36818 | 311.28 | 596 | 579 | 116.4 |
| B | 5 | 255 | 26923 | 226.29 | 596 | 579 | 116.4 |
| C | 15 | 214 | 238662 | 1750.82 | 586 | 588 | 136.0 |
| C | 14 | 254 | 24953 | 179.18 | 586 | 588 | 136.0 |
| C | 12 | 249 | 5354 | 35.05 | 586 | 588 | 136.0 |
| D | 1 | 52 | 176146 | 1228.8 | 585 | 566 | 142.9 |
| D | 2 | 16 | 155580 | 1084.87 | 585 | 566 | 142.9 |
| D | 12 | 233 | 145867 | 1016.89 | 585 | 566 | 142.9 |
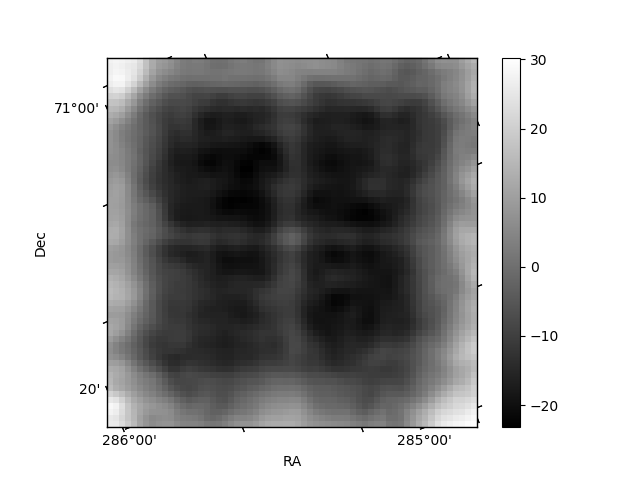
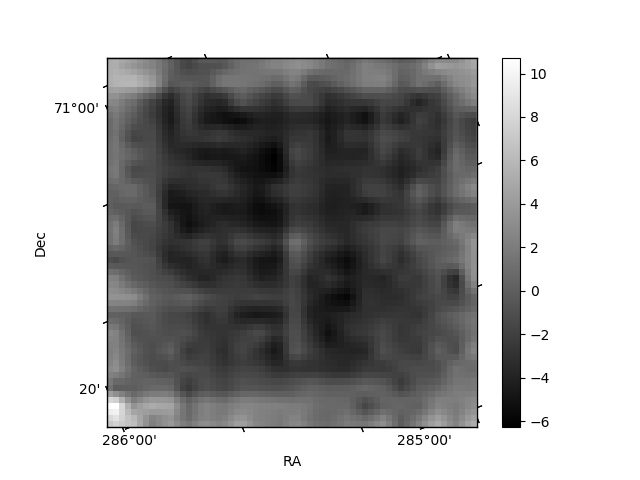
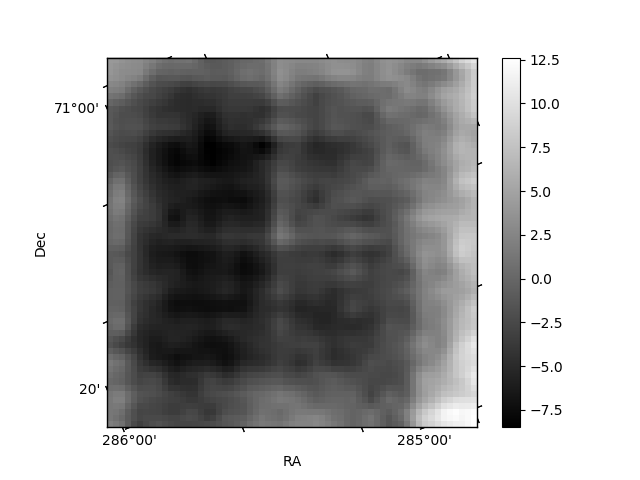
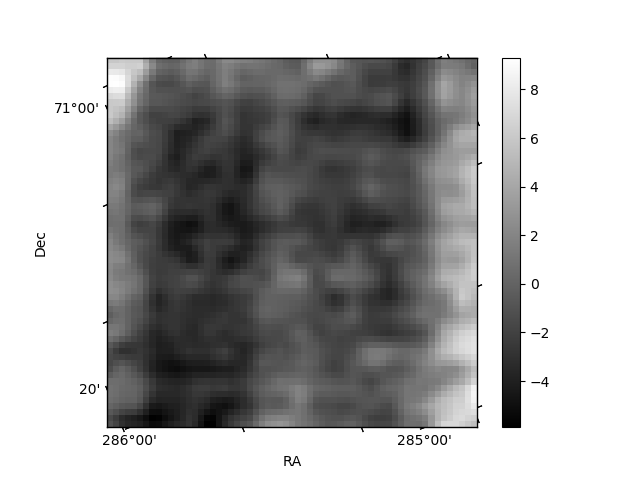
Histogram calculated using DETX and DETY for each event in the final _common_clean file
| Quadrant A | 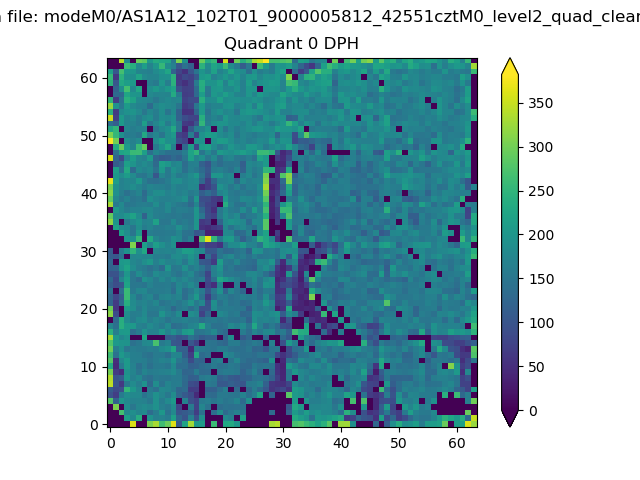 |
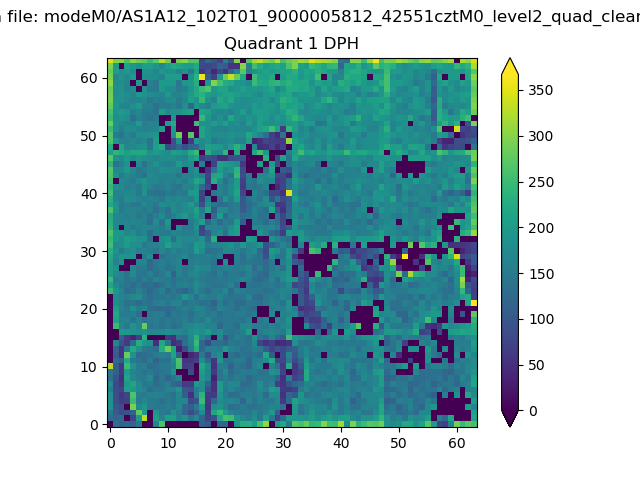 |
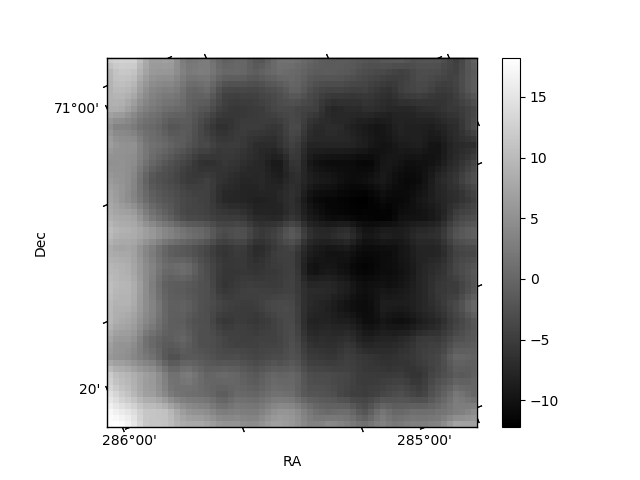
Quadrant B |
|---|---|---|---|
| Quadrant D | 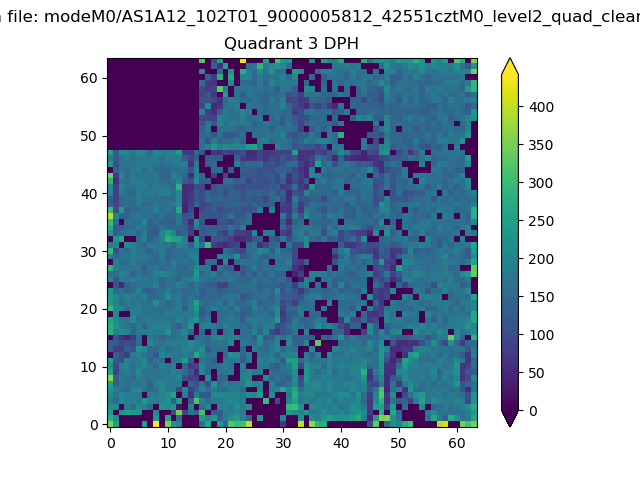 |
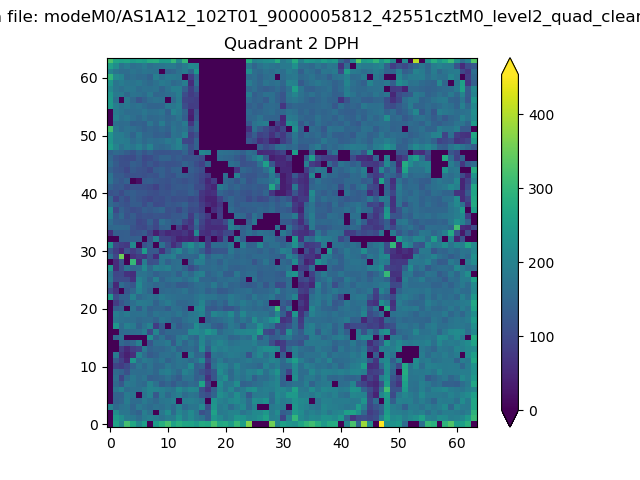 |
Quadrant C |
| Plot type | Count rate plots | Images |
|---|---|---|
| Comparison with Poisson distribution Blue bars denote a histogram of data divided into 1 sec bins. Red curve is a Poisson curve with rate = median count rate of data. |
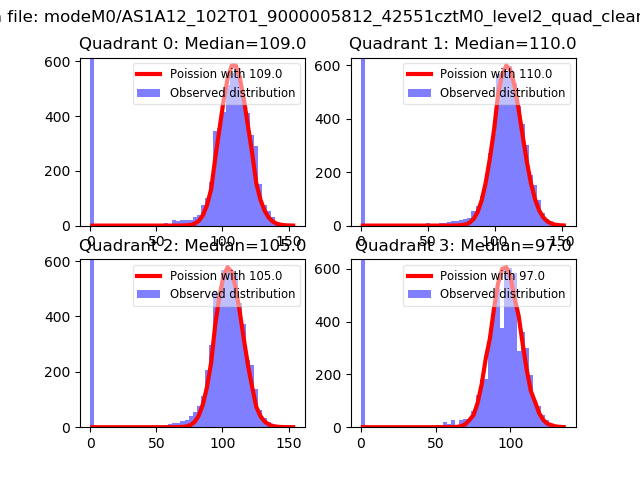 |
 |
| Quadrant-wise count rates Data is divided into 100 sec bins |
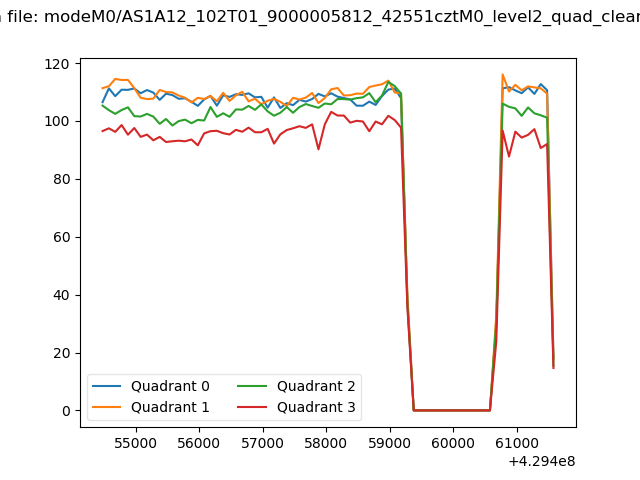 |
|
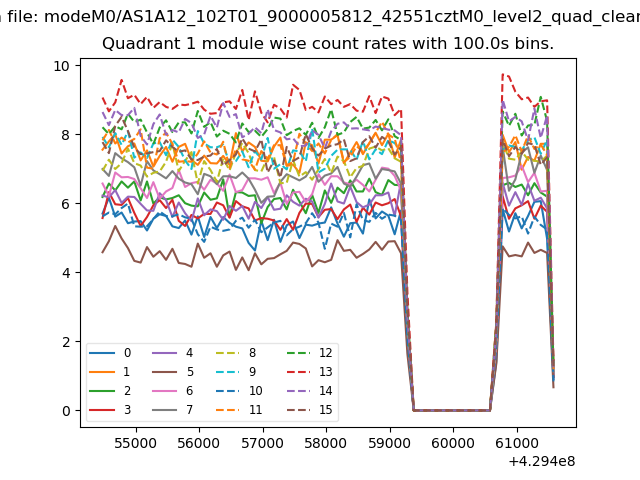
| Module-wise count rates for Quadrant A Data is divided into 100 sec bins |
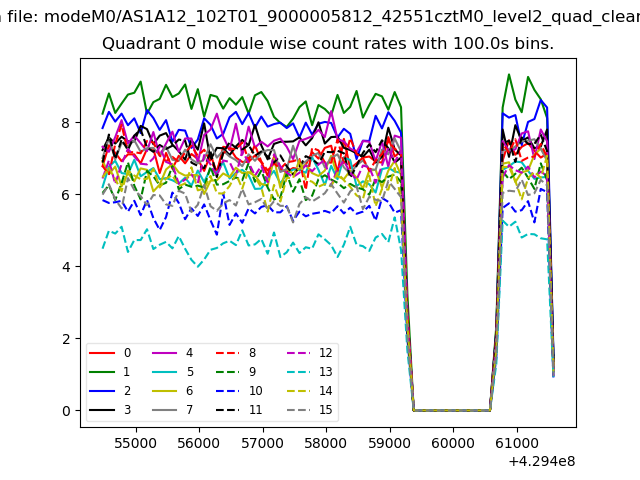 |
 |
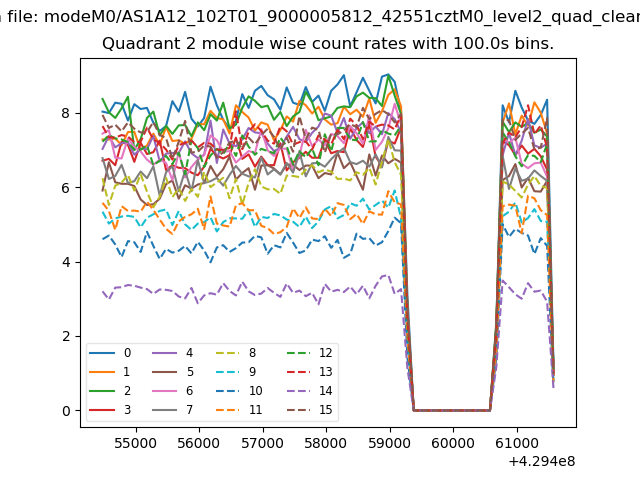
| Module-wise count rates for Quadrant B Data is divided into 100 sec bins |
 |
 |
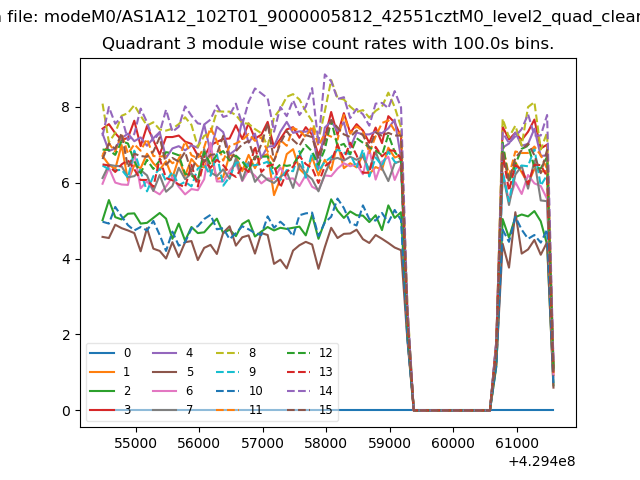
| Module-wise count rates for Quadrant C Data is divided into 100 sec bins |
 |
 |
| Module-wise count rates for Quadrant D Data is divided into 100 sec bins |
 |
 |
| Parameter | Plot |
|---|---|
| CZT HV Monitor | 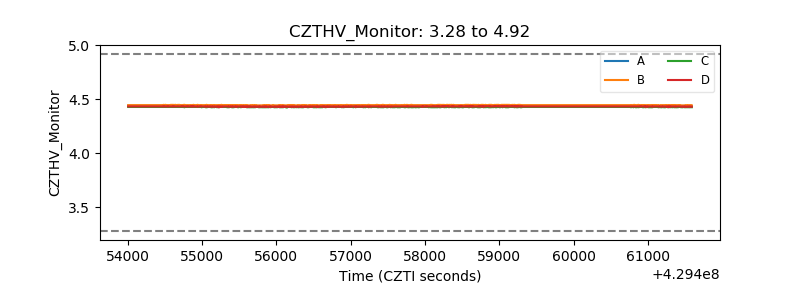 |
| D_VDD | 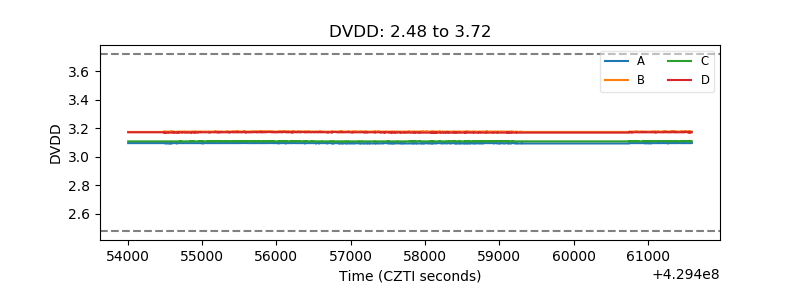 |
| Temperature 1 | 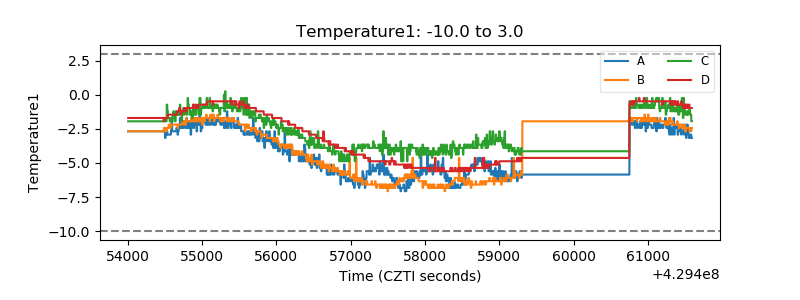 |
| Veto HV Monitor |  |
| Veto LLD | 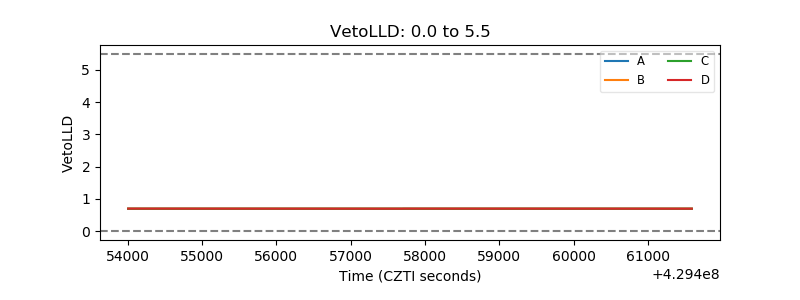 |
| Alpha Counter | 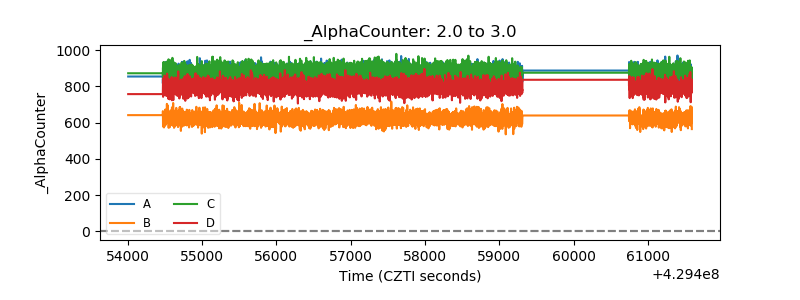 |
| _CPM_Rate | 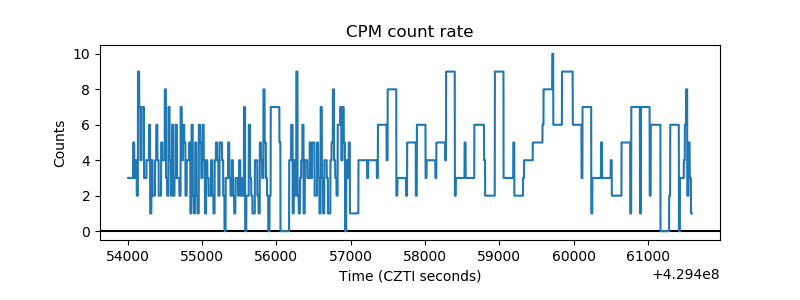 |
| CZT Counter | 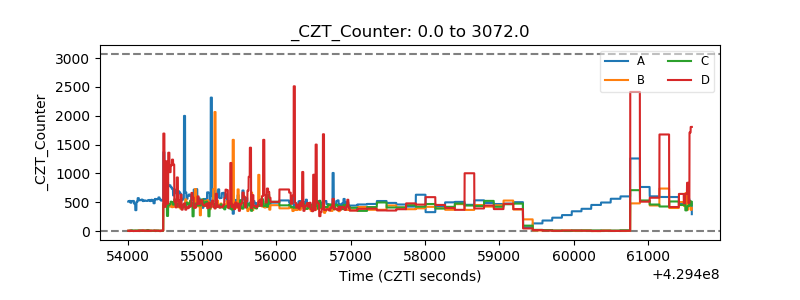 |
| +2.5 Volts monitor | 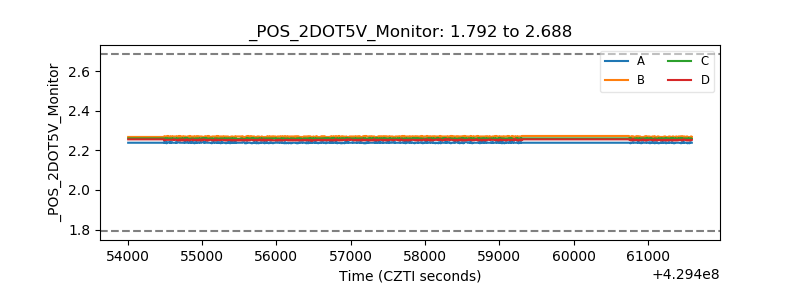 |
| +5 Volts monitor | 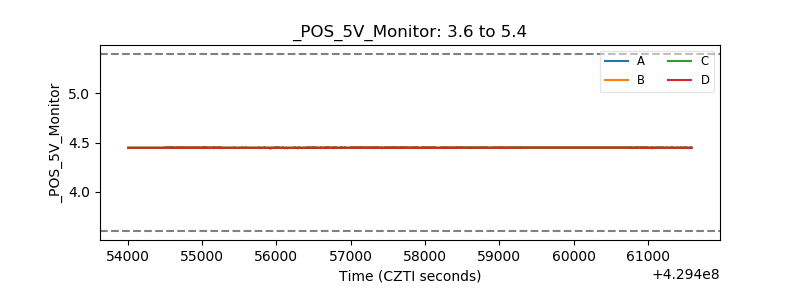 |
| _ROLL_ROT | 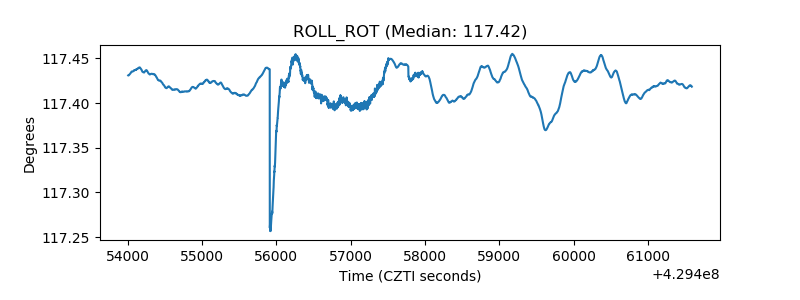 |
| _Roll_DEC | 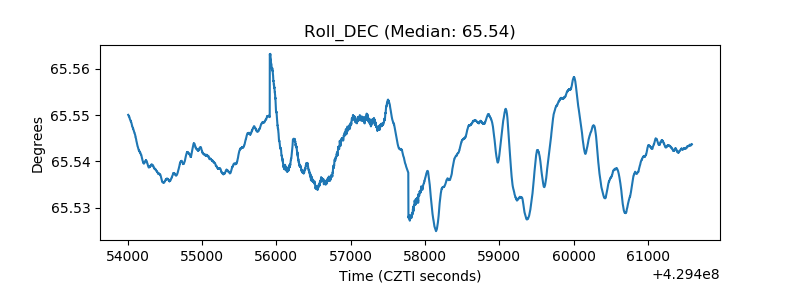 |
| _Roll_RA | 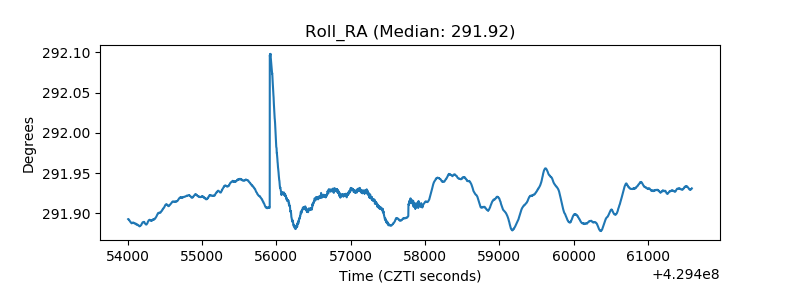 |
| Veto Counter | 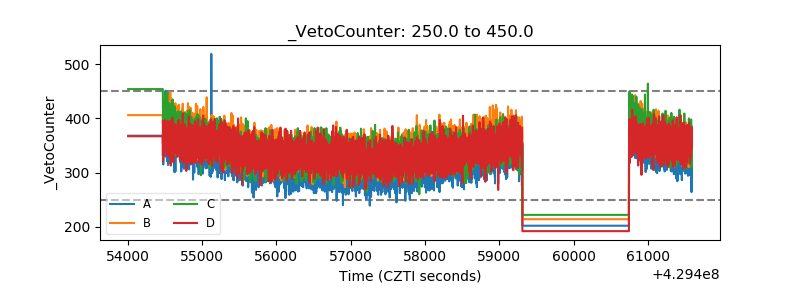 |