| Param | Original file | Final file |
|---|---|---|
| Filename | modeM0/AS1A12_102T01_9000005812_42552cztM0_level2.fits | modeM0/AS1A12_102T01_9000005812_42552cztM0_level2_quad_clean.evt |
| Size (bytes) | 361,474,560 | 96,053,760 |
| Size | 344.7 MB | 91.6 MB |
| Events in quadrant A | 3,133,474 | 644,343 |
| Events in quadrant B | 2,608,325 | 652,870 |
| Events in quadrant C | 2,697,432 | 625,165 |
| Events in quadrant D | 4,475,647 | 568,123 |
| Mode M0 | |||
|---|---|---|---|
| Quadrant | BADHDUFLAG | Total packets | Discarded packets |
| A | 0 | 13043 | 2 |
| B | 0 | 12247 | 2 |
| C | 0 | 12040 | 2 |
| D | 0 | 17834 | 2 |
| Mode M9 | |||
|---|---|---|---|
| Quadrant | BADHDUFLAG | Total packets | Discarded packets |
| A | 0 | 18 | 0 |
| B | 0 | 19 | 0 |
| C | 0 | 19 | 0 |
| D | 0 | 19 | 0 |
| Mode SS | |||
|---|---|---|---|
| Quadrant | BADHDUFLAG | Total packets | Discarded packets |
| A | 0 | 122 | 0 |
| B | 0 | 122 | 0 |
| C | 0 | 122 | 0 |
| D | 0 | 122 | 0 |
| Quadrant | Total seconds | Saturated seconds | Saturation percentage |
|---|---|---|---|
| A | 5981 | 13 | 0.217355% |
| B | 5981 | 19 | 0.317673% |
| C | 5981 | 6 | 0.100318% |
| D | 5981 | 222 | 3.711754% |
Noise dominated data is calculated using 1-second bins in cleaned event files. If a bin has >2000 counts, and if more than 50% of those come from <1% of pixels, then it is considered to be noise-dominated and hence unusable.
| Quadrant | # 1 sec bins | Bins with >0 counts | Bins with >2000 counts | High rate bins dominated by noise | Noise dominated (total time) | Noise dominated (detector-on time) | Marked lightcurve |
|---|---|---|---|---|---|---|---|
| A | 7263 | 5982 | 5 | 5 | 0.07% | 0.08% | 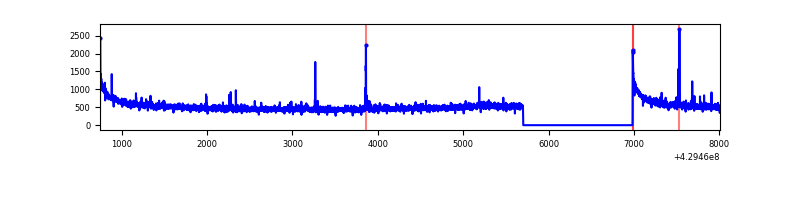 |
| B | 7263 | 5982 | 6 | 6 | 0.08% | 0.10% | 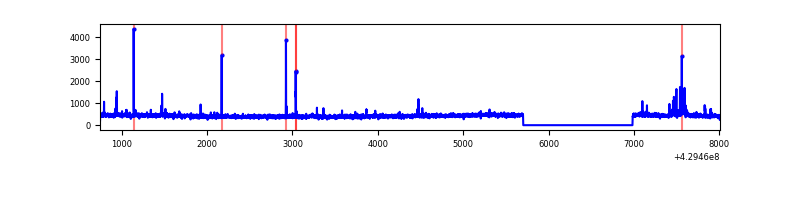 |
| C | 7263 | 5982 | 2 | 2 | 0.03% | 0.03% | 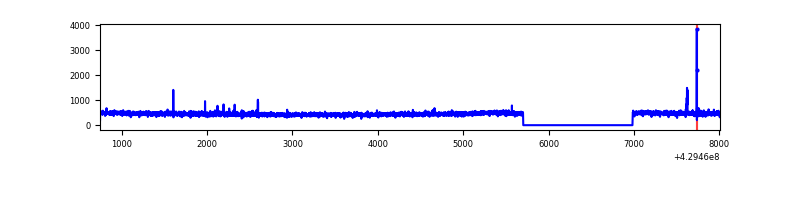 |
| D | 7263 | 5982 | 174 | 174 | 2.40% | 2.91% | 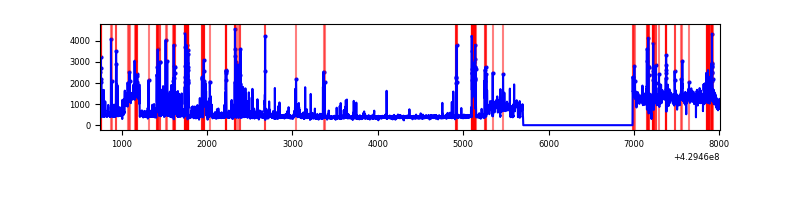 |
Top three noisy pixels from each quadrant. If the there are fewer than three noisy pixels in the level2.evt file, extra rows are filled as -1
| Pixel properties | Quadrant properties | ||||||
|---|---|---|---|---|---|---|---|
| Quadrant | DetID | PixID | Counts | Sigma | Mean | Median | Sigma |
| A | 10 | 83 | 617536 | 4750.35 | 633 | 617 | 129.9 |
| A | 2 | 79 | 41679 | 316.18 | 633 | 617 | 129.9 |
| A | 15 | 223 | 9884 | 71.36 | 633 | 617 | 129.9 |
| B | 0 | 186 | 58344 | 477.64 | 628 | 609 | 120.9 |
| B | 0 | 245 | 27129 | 219.4 | 628 | 609 | 120.9 |
| B | 5 | 172 | 23418 | 188.7 | 628 | 609 | 120.9 |
| C | 15 | 214 | 250930 | 1737.26 | 618 | 621 | 144.1 |
| C | 12 | 249 | 18756 | 125.87 | 618 | 621 | 144.1 |
| C | 3 | 233 | 8969 | 57.94 | 618 | 621 | 144.1 |
| D | 2 | 16 | 1125242 | 7450.77 | 613 | 593 | 150.9 |
| D | 13 | 249 | 258343 | 1707.59 | 613 | 593 | 150.9 |
| D | 1 | 47 | 232714 | 1537.79 | 613 | 593 | 150.9 |
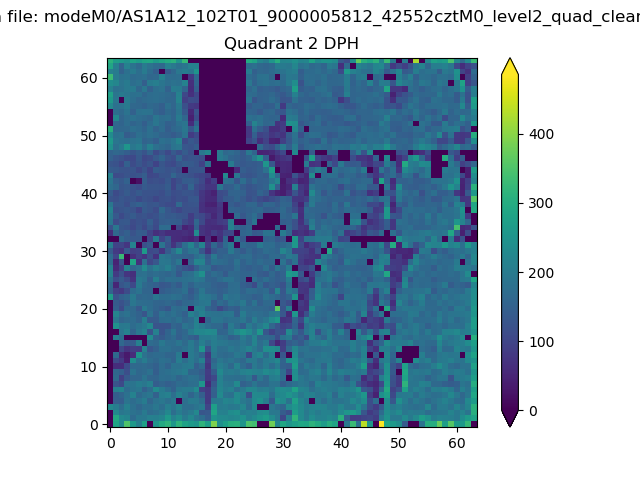
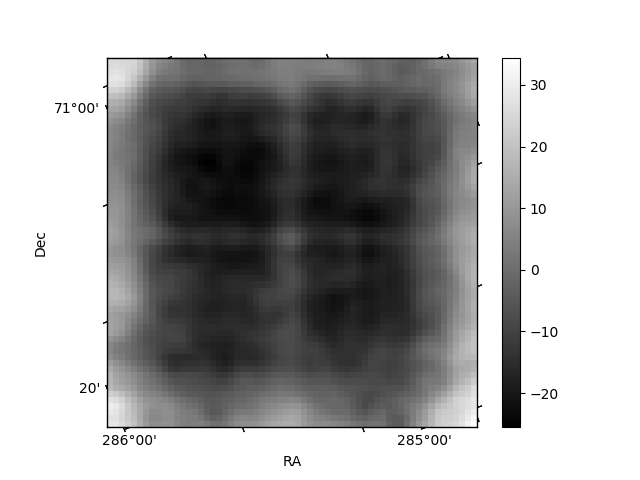
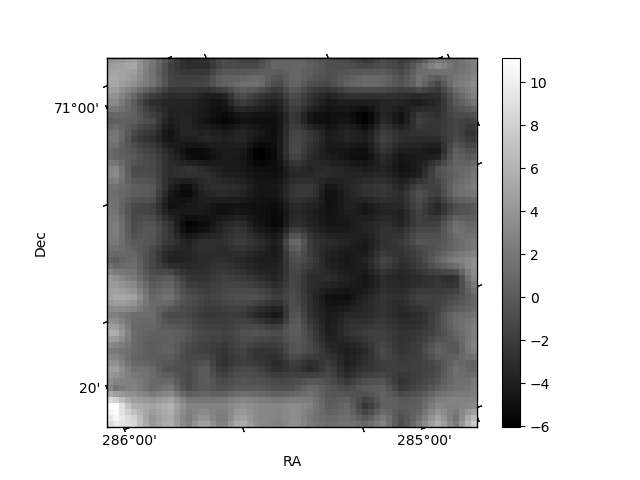
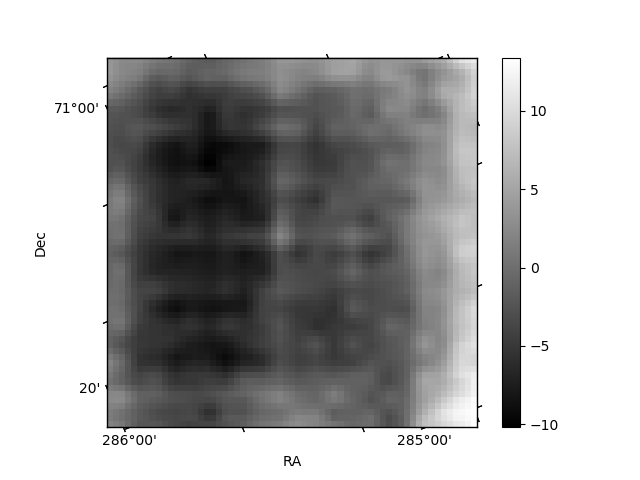
Histogram calculated using DETX and DETY for each event in the final _common_clean file
| Quadrant A | 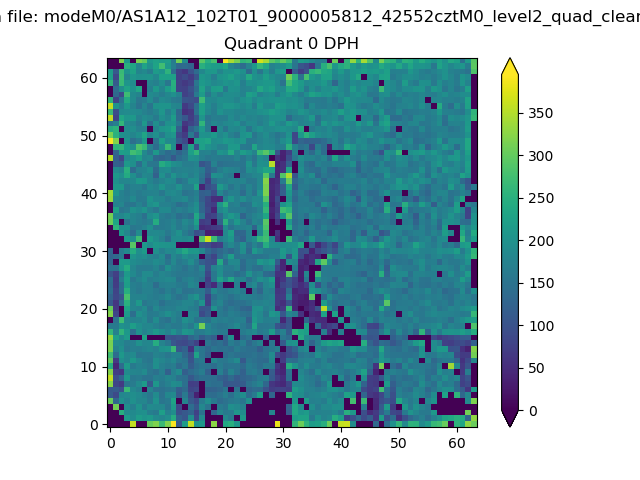 |
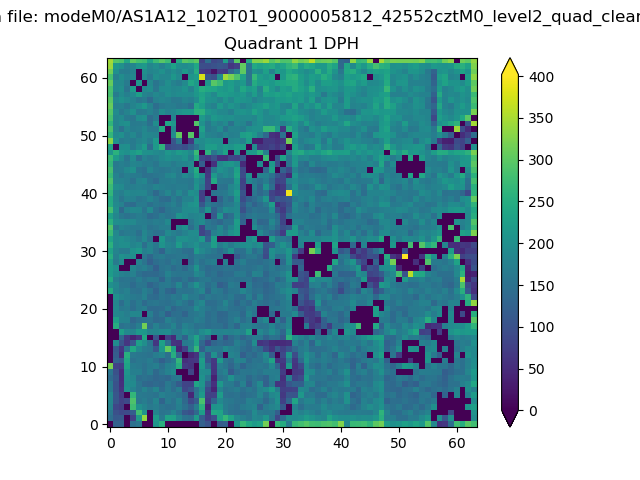 |
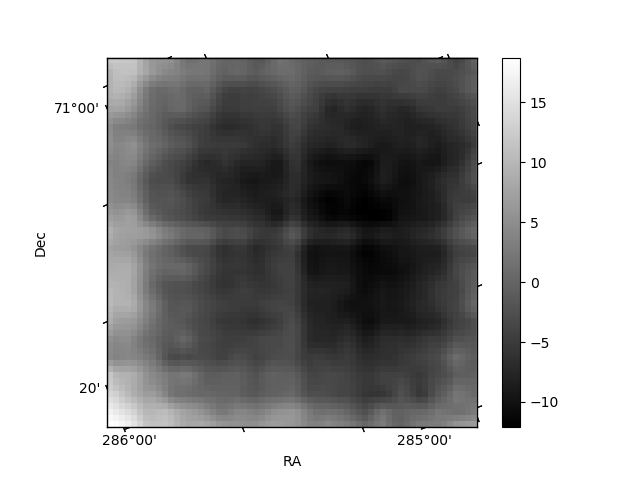
Quadrant B |
|---|---|---|---|
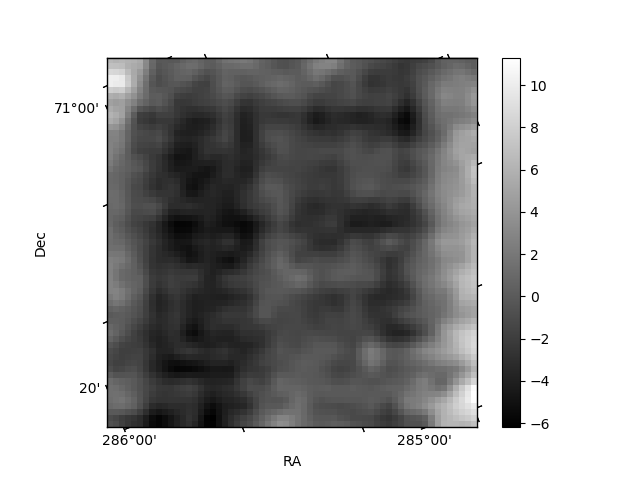
| Quadrant D | 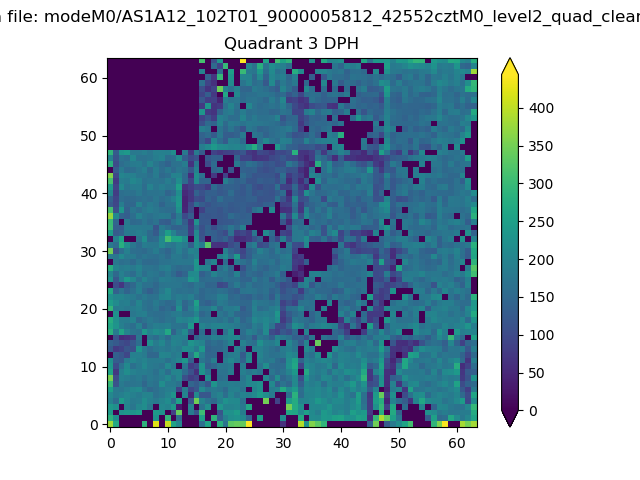 |
 |
Quadrant C |
| Plot type | Count rate plots | Images |
|---|---|---|
| Comparison with Poisson distribution Blue bars denote a histogram of data divided into 1 sec bins. Red curve is a Poisson curve with rate = median count rate of data. |
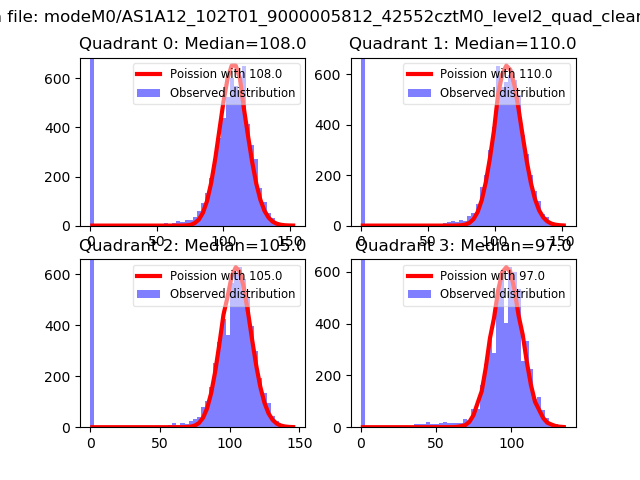 |
 |
| Quadrant-wise count rates Data is divided into 100 sec bins |
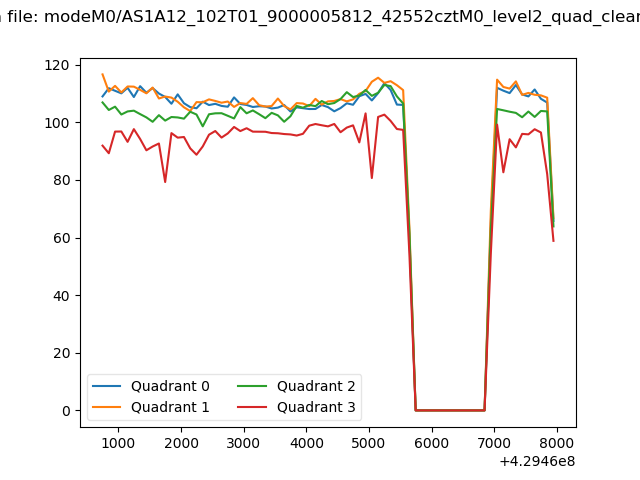 |
|
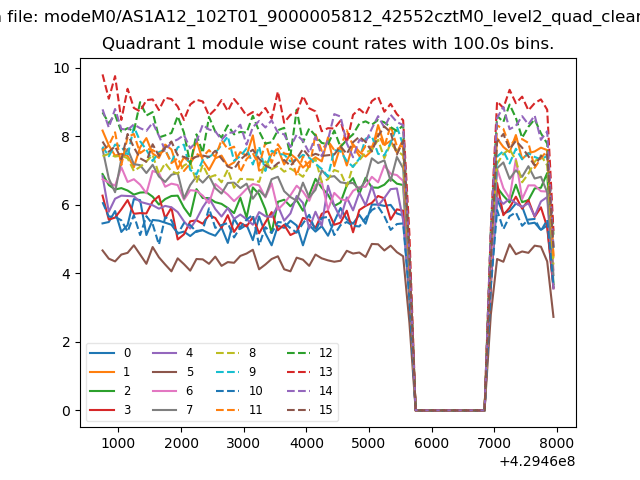
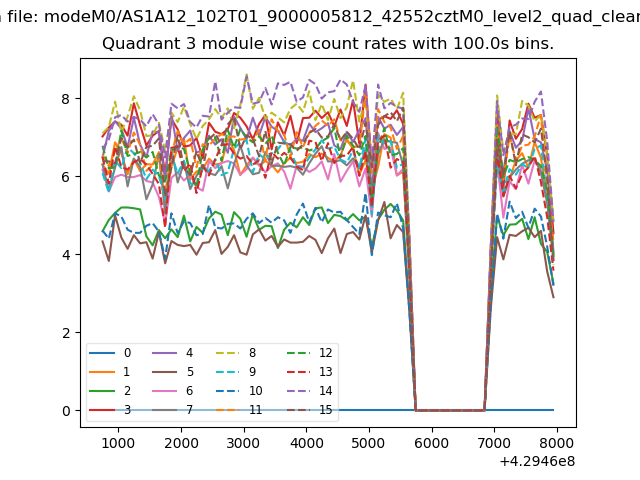
| Module-wise count rates for Quadrant A Data is divided into 100 sec bins |
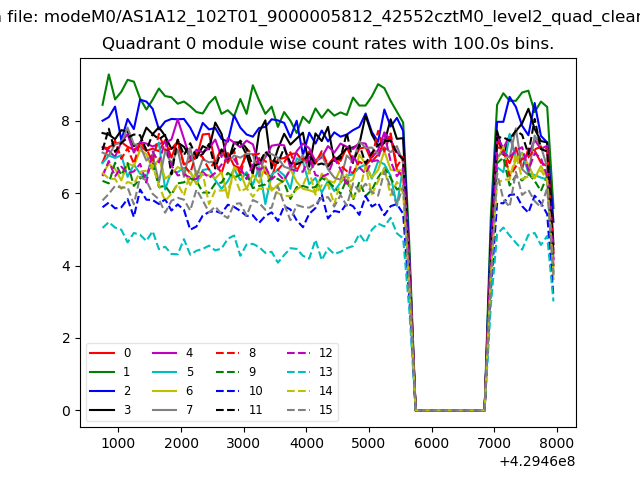 |
 |
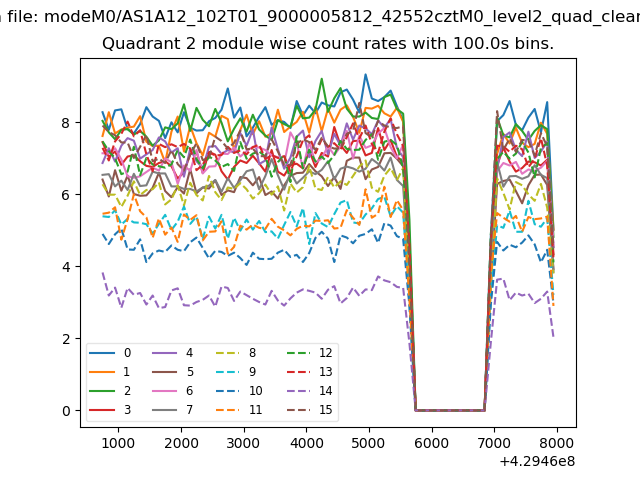
| Module-wise count rates for Quadrant B Data is divided into 100 sec bins |
 |
 |
| Module-wise count rates for Quadrant C Data is divided into 100 sec bins |
 |
 |
| Module-wise count rates for Quadrant D Data is divided into 100 sec bins |
 |
 |
| Parameter | Plot |
|---|---|
| CZT HV Monitor | 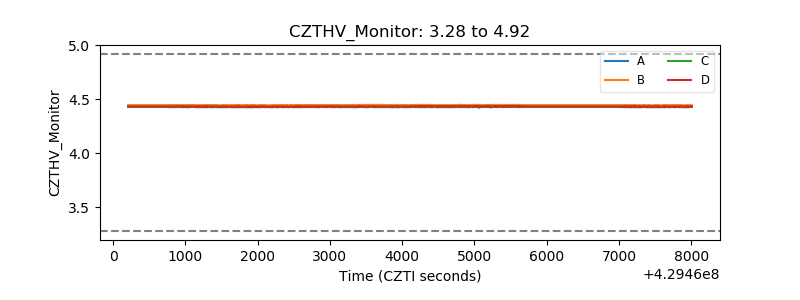 |
| D_VDD | 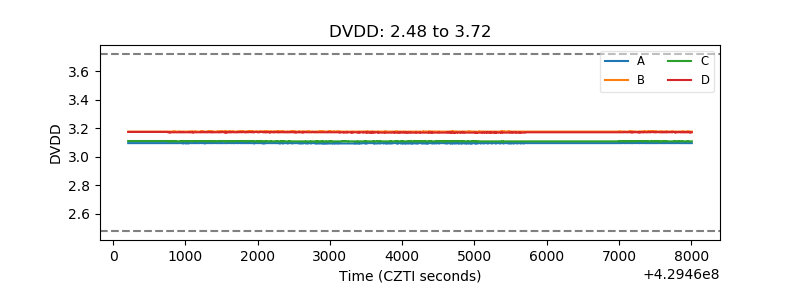 |
| Temperature 1 | 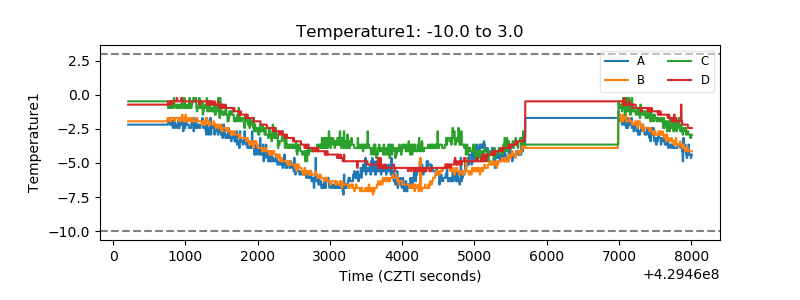 |
| Veto HV Monitor |  |
| Veto LLD | 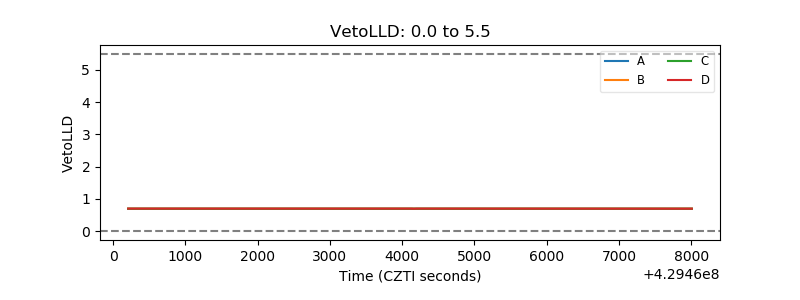 |
| Alpha Counter | 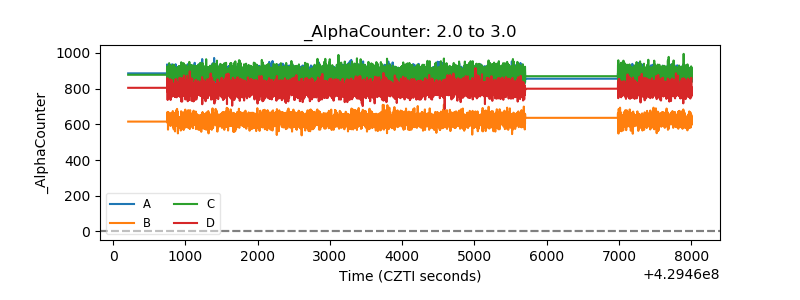 |
| _CPM_Rate | 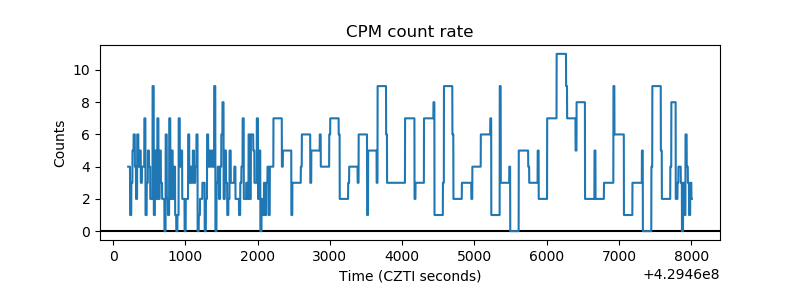 |
| CZT Counter | 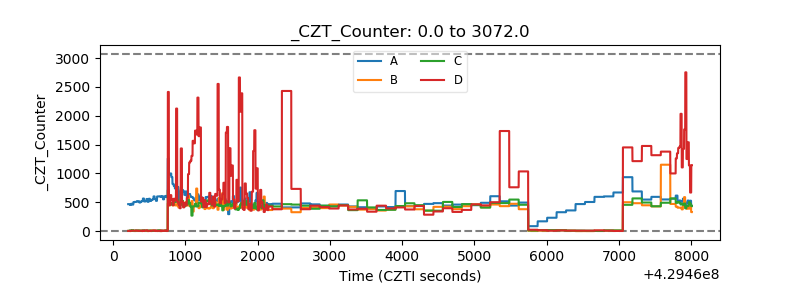 |
| +2.5 Volts monitor | 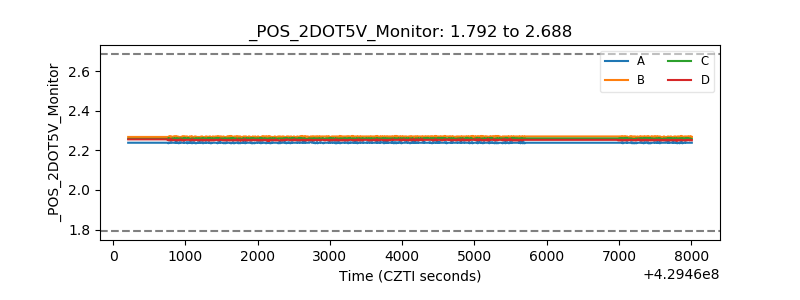 |
| +5 Volts monitor | 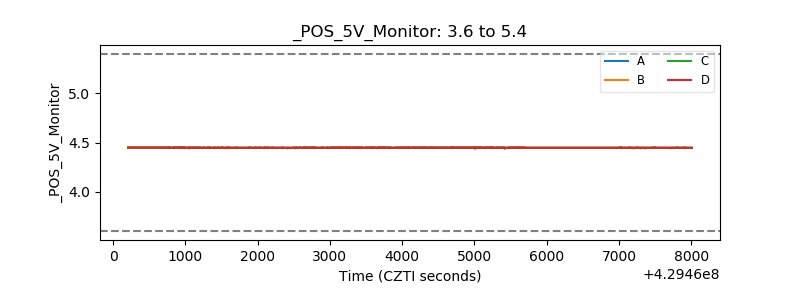 |
| _ROLL_ROT | 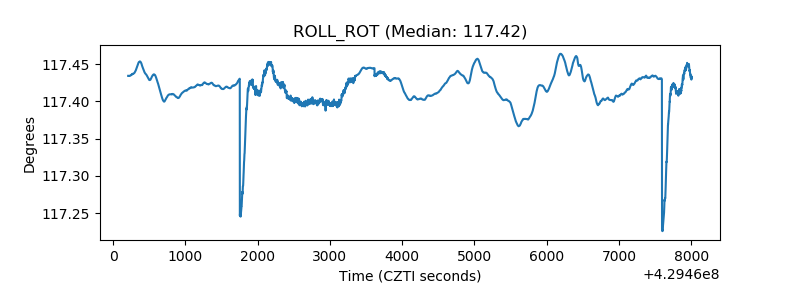 |
| _Roll_DEC | 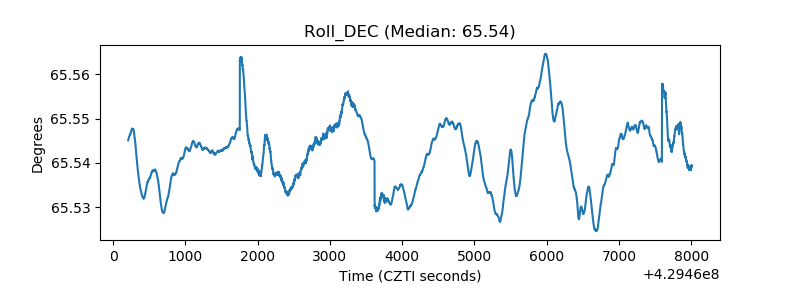 |
| _Roll_RA | 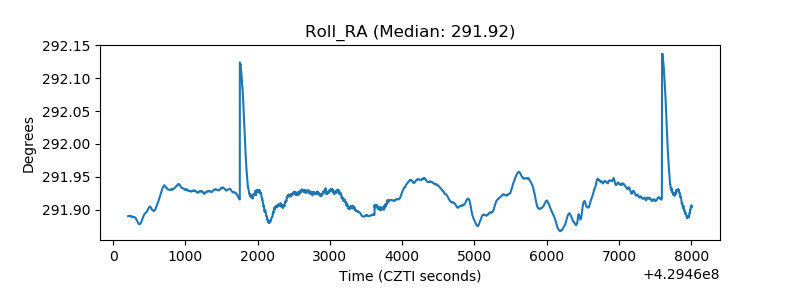 |
| Veto Counter | 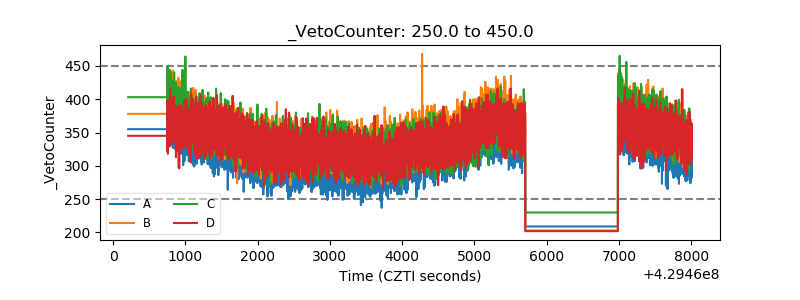 |