| Param | Original file | Final file |
|---|---|---|
| Filename | modeM0/AS1A12_102T01_9000005812_42555cztM0_level2.fits | modeM0/AS1A12_102T01_9000005812_42555cztM0_level2_quad_clean.evt |
| Size (bytes) | 958,893,120 | 234,446,400 |
| Size | 914.5 MB | 223.6 MB |
| Events in quadrant A | 7,487,839 | 1,559,507 |
| Events in quadrant B | 6,359,647 | 1,590,905 |
| Events in quadrant C | 6,662,449 | 1,535,774 |
| Events in quadrant D | 13,840,513 | 1,390,931 |
| Mode M0 | |||
|---|---|---|---|
| Quadrant | BADHDUFLAG | Total packets | Discarded packets |
| A | 0 | 31769 | 4 |
| B | 0 | 30077 | 4 |
| C | 0 | 29960 | 4 |
| D | 0 | 51946 | 9 |
| Mode M9 | |||
|---|---|---|---|
| Quadrant | BADHDUFLAG | Total packets | Discarded packets |
| A | 0 | 47 | 0 |
| B | 0 | 48 | 0 |
| C | 0 | 48 | 0 |
| D | 0 | 48 | 0 |
| Mode SS | |||
|---|---|---|---|
| Quadrant | BADHDUFLAG | Total packets | Discarded packets |
| A | 0 | 302 | 0 |
| B | 0 | 302 | 0 |
| C | 0 | 302 | 0 |
| D | 0 | 302 | 0 |
| Quadrant | Total seconds | Saturated seconds | Saturation percentage |
|---|---|---|---|
| A | 14794 | 35 | 0.236582% |
| B | 14794 | 25 | 0.168987% |
| C | 14794 | 12 | 0.081114% |
| D | 14792 | 503 | 3.400487% |
Noise dominated data is calculated using 1-second bins in cleaned event files. If a bin has >2000 counts, and if more than 50% of those come from <1% of pixels, then it is considered to be noise-dominated and hence unusable.
| Quadrant | # 1 sec bins | Bins with >0 counts | Bins with >2000 counts | High rate bins dominated by noise | Noise dominated (total time) | Noise dominated (detector-on time) | Marked lightcurve |
|---|---|---|---|---|---|---|---|
| A | 18969 | 14797 | 11 | 11 | 0.06% | 0.07% | 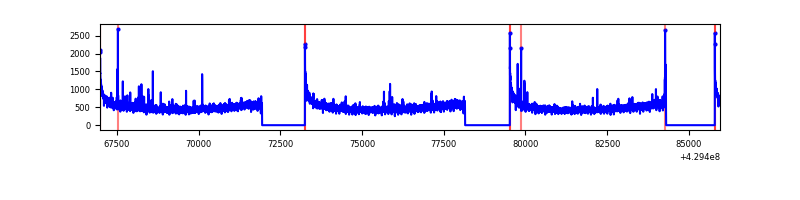 |
| B | 18969 | 14797 | 11 | 11 | 0.06% | 0.07% | 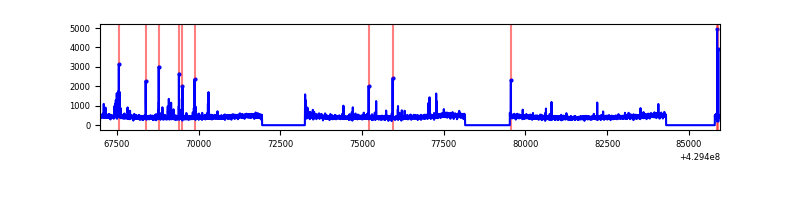 |
| C | 18969 | 14797 | 3 | 3 | 0.02% | 0.02% | 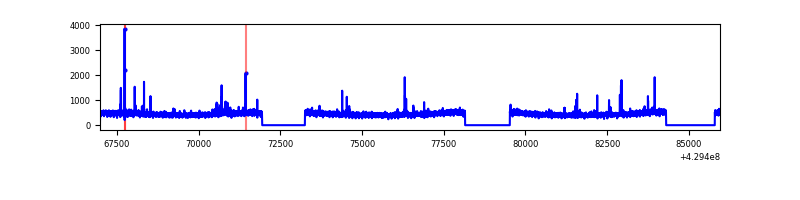 |
| D | 18969 | 14796 | 429 | 429 | 2.26% | 2.90% | 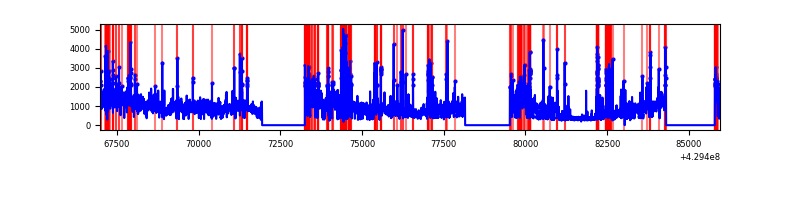 |
Top three noisy pixels from each quadrant. If the there are fewer than three noisy pixels in the level2.evt file, extra rows are filled as -1
| Pixel properties | Quadrant properties | ||||||
|---|---|---|---|---|---|---|---|
| Quadrant | DetID | PixID | Counts | Sigma | Mean | Median | Sigma |
| A | 10 | 83 | 1347433 | 4255.96 | 1556 | 1519 | 316.2 |
| A | 2 | 79 | 57862 | 178.16 | 1556 | 1519 | 316.2 |
| A | 13 | 248 | 42423 | 129.34 | 1556 | 1519 | 316.2 |
| B | 0 | 245 | 110906 | 367.58 | 1544 | 1501 | 297.6 |
| B | 0 | 186 | 76223 | 251.05 | 1544 | 1501 | 297.6 |
| B | 5 | 172 | 72209 | 237.57 | 1544 | 1501 | 297.6 |
| C | 15 | 214 | 604793 | 1718.51 | 1519 | 1527 | 351.0 |
| C | 14 | 254 | 68637 | 191.18 | 1519 | 1527 | 351.0 |
| C | 12 | 249 | 39841 | 109.14 | 1519 | 1527 | 351.0 |
| D | 2 | 16 | 6558625 | 18152.18 | 1497 | 1455 | 361.2 |
| D | 13 | 249 | 477238 | 1317.11 | 1497 | 1455 | 361.2 |
| D | 5 | 222 | 224731 | 618.09 | 1497 | 1455 | 361.2 |
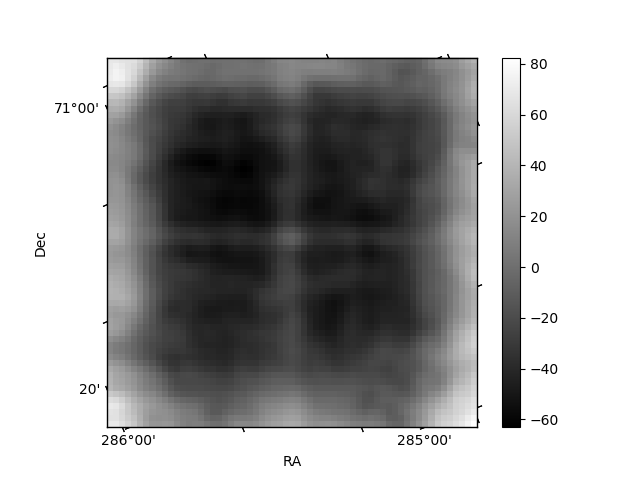
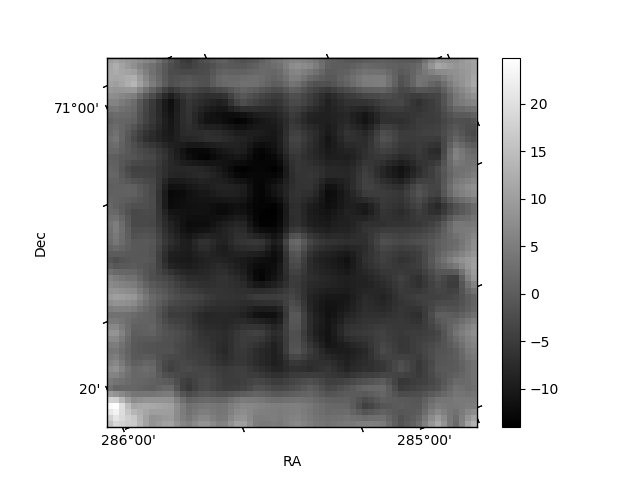
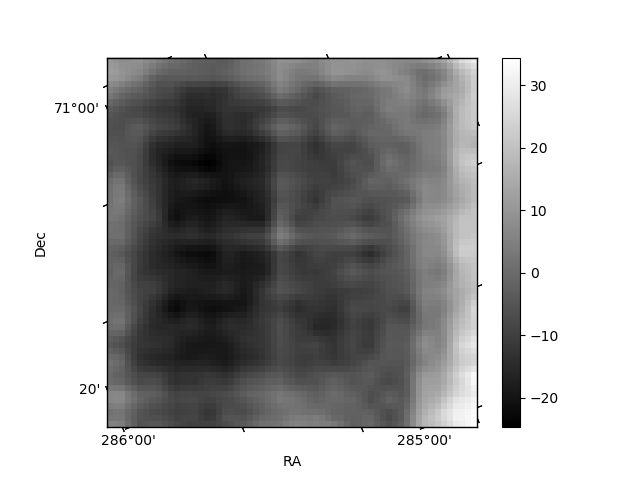
Histogram calculated using DETX and DETY for each event in the final _common_clean file
| Quadrant A | 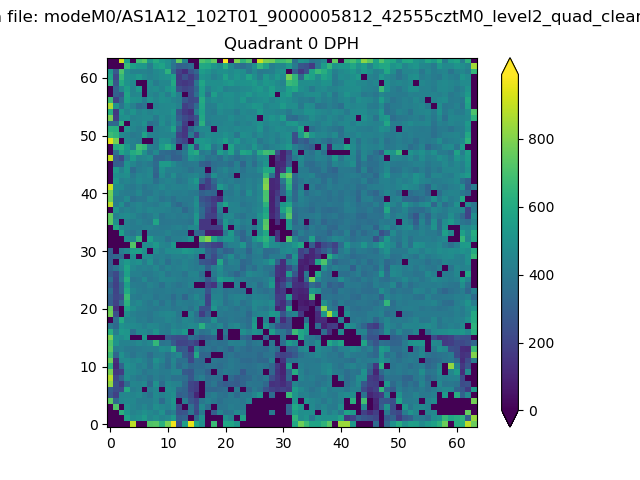 |
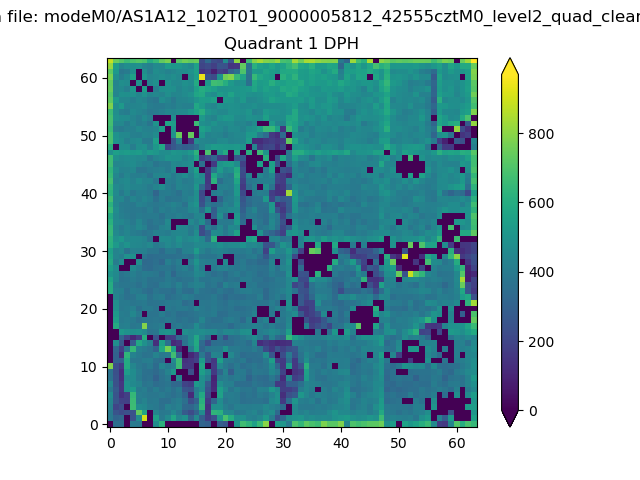 |
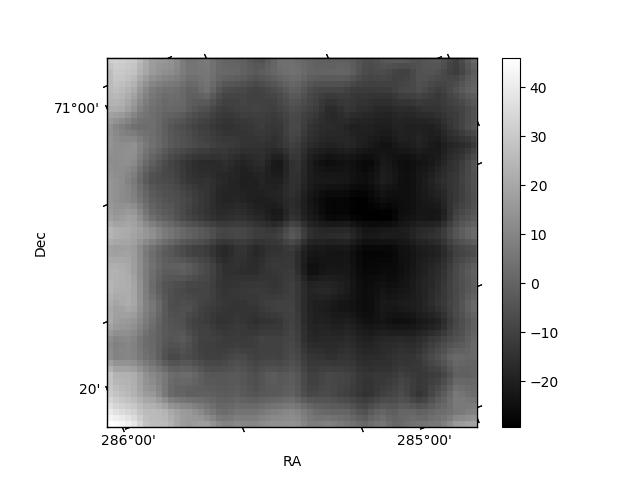
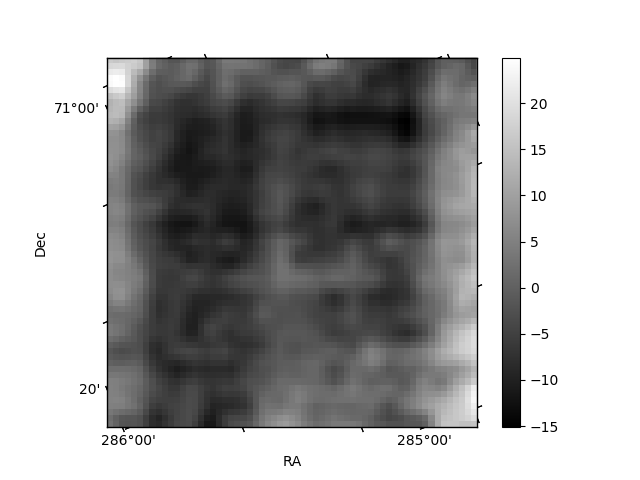
Quadrant B |
|---|---|---|---|
| Quadrant D | 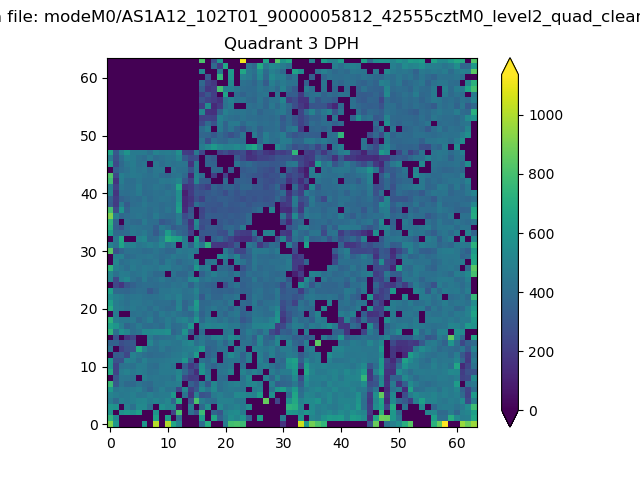 |
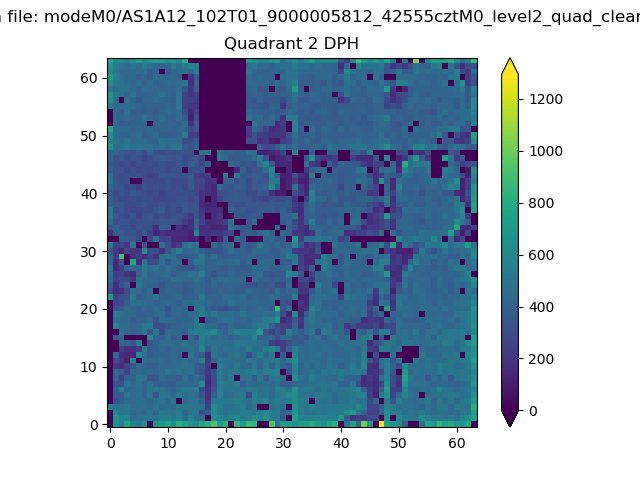 |
Quadrant C |
| Plot type | Count rate plots | Images |
|---|---|---|
| Comparison with Poisson distribution Blue bars denote a histogram of data divided into 1 sec bins. Red curve is a Poisson curve with rate = median count rate of data. |
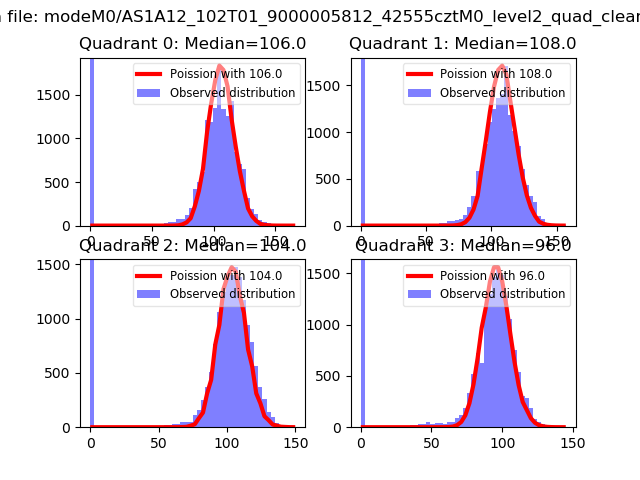 |
 |
| Quadrant-wise count rates Data is divided into 100 sec bins |
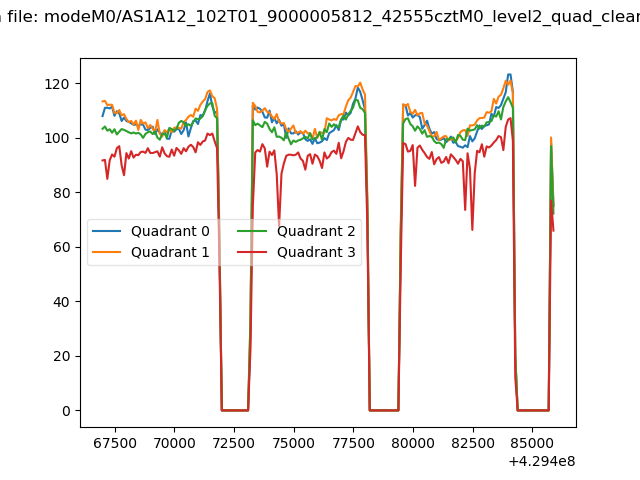 |
|
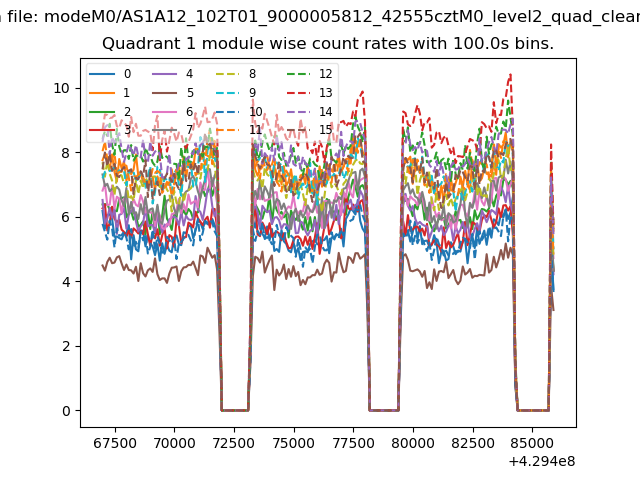
| Module-wise count rates for Quadrant A Data is divided into 100 sec bins |
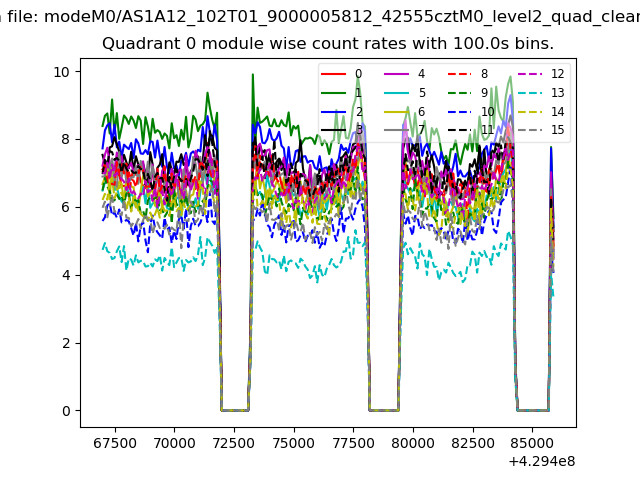 |
 |
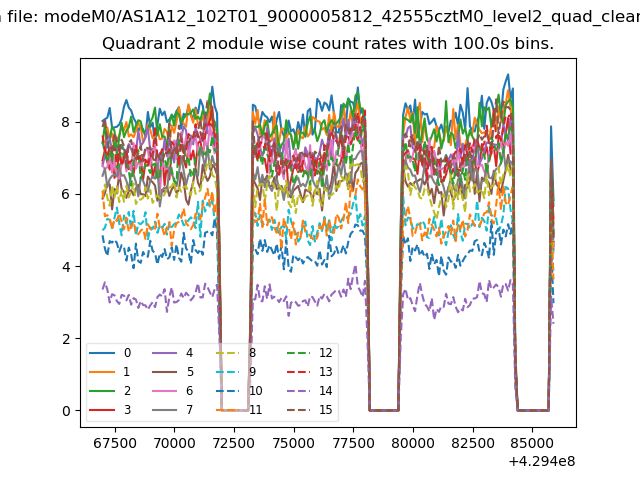
| Module-wise count rates for Quadrant B Data is divided into 100 sec bins |
 |
 |
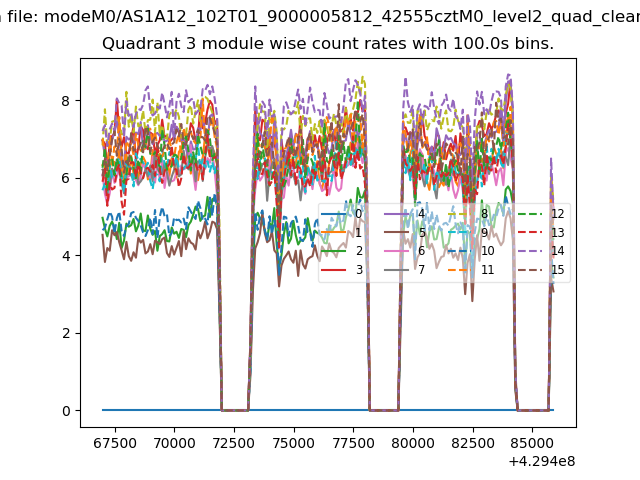
| Module-wise count rates for Quadrant C Data is divided into 100 sec bins |
 |
 |
| Module-wise count rates for Quadrant D Data is divided into 100 sec bins |
 |
 |
| Parameter | Plot |
|---|---|
| CZT HV Monitor | 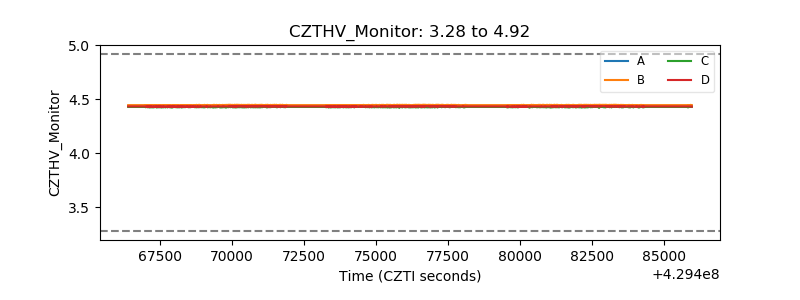 |
| D_VDD | 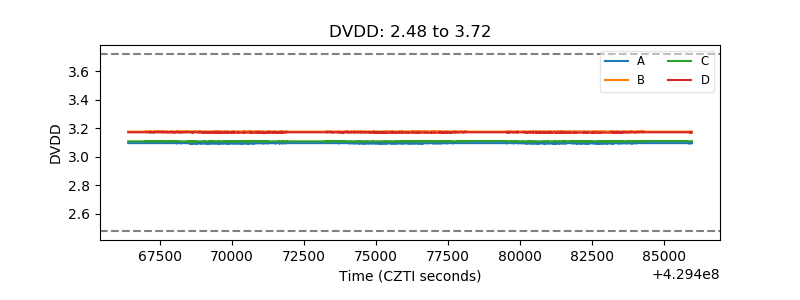 |
| Temperature 1 | 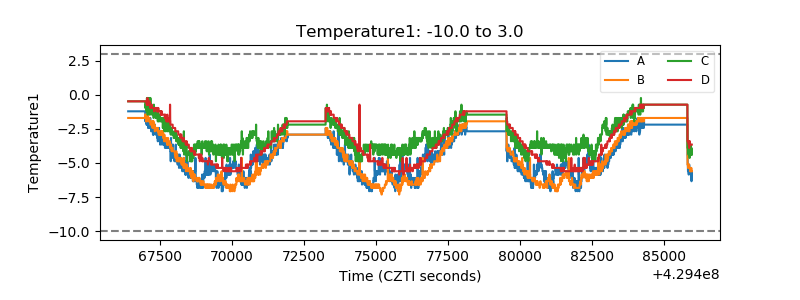 |
| Veto HV Monitor | 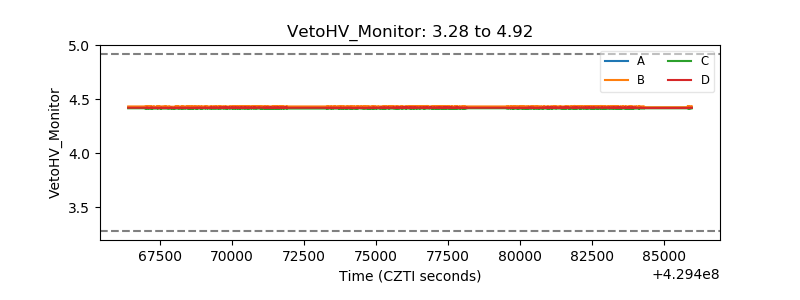 |
| Veto LLD | 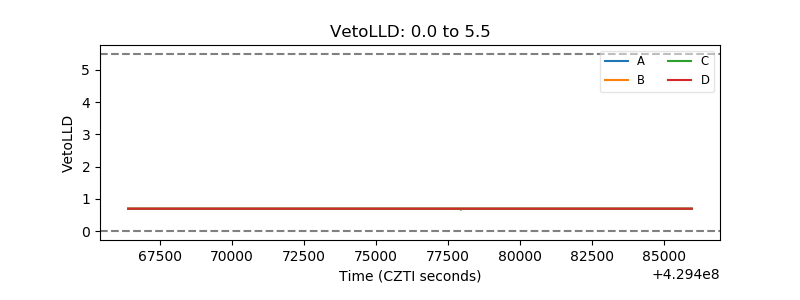 |
| Alpha Counter | 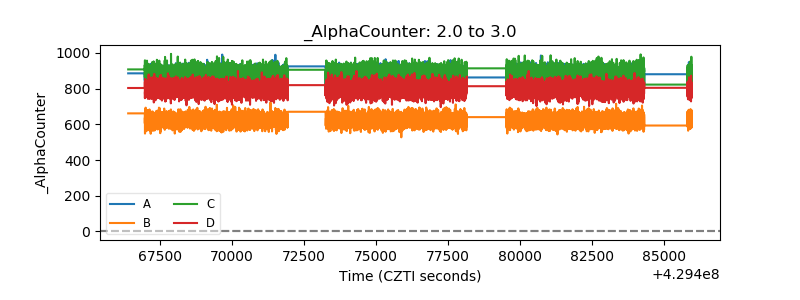 |
| _CPM_Rate | 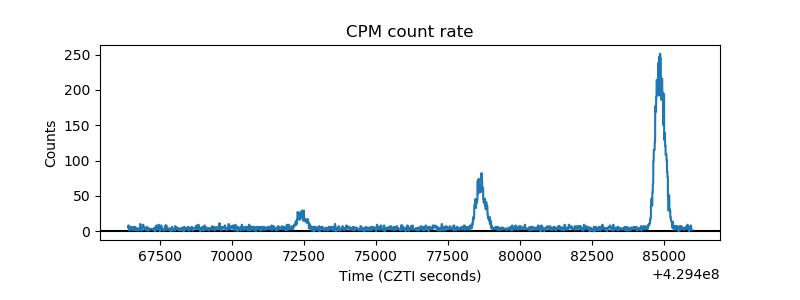 |
| CZT Counter | 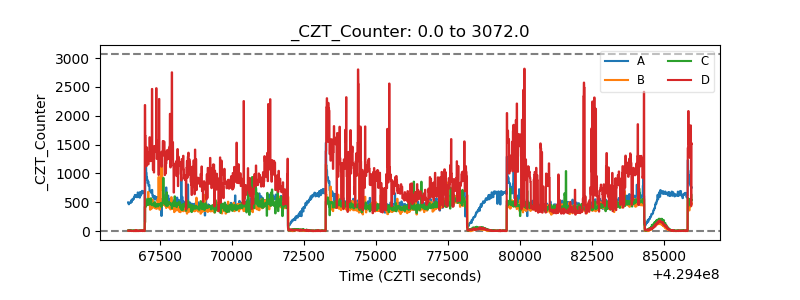 |
| +2.5 Volts monitor | 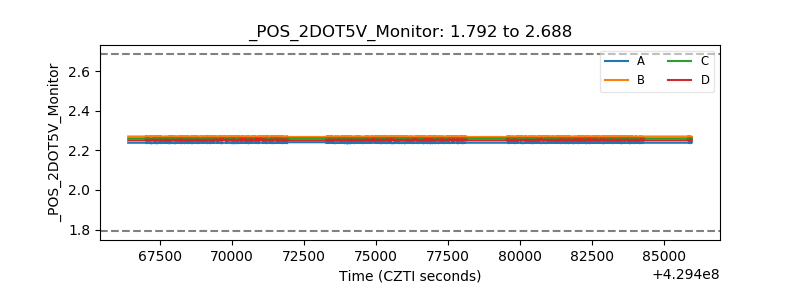 |
| +5 Volts monitor |  |
| _ROLL_ROT |  |
| _Roll_DEC | 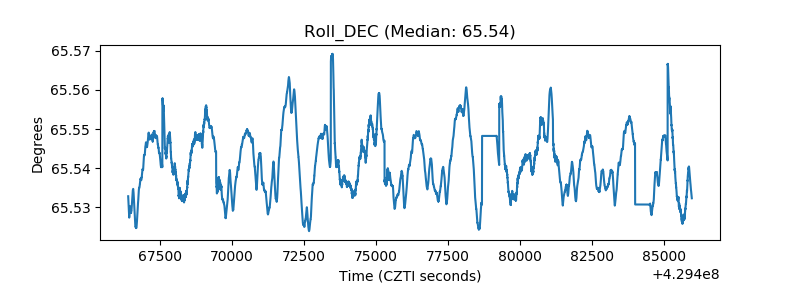 |
| _Roll_RA | 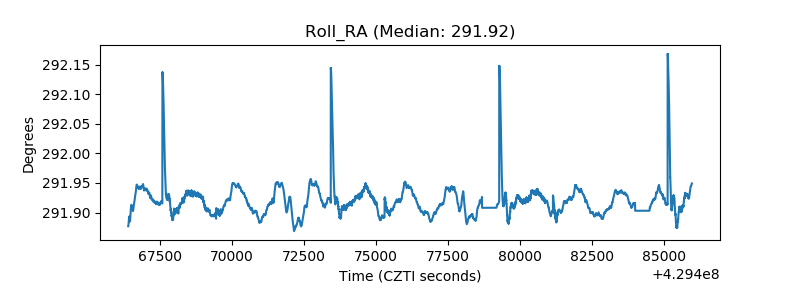 |
| Veto Counter | 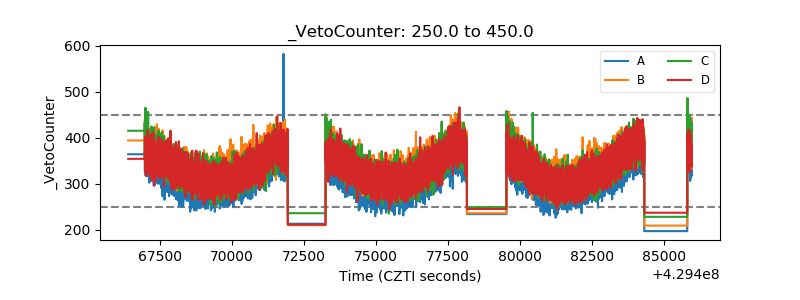 |