| Param | Original file | Final file |
|---|---|---|
| Filename | modeM0/AS1C07_001T10_9000005814_42558cztM0_level2.fits | modeM0/AS1C07_001T10_9000005814_42558cztM0_level2_quad_clean.evt |
| Size (bytes) | 295,836,480 | 92,105,280 |
| Size | 282.1 MB | 87.8 MB |
| Events in quadrant A | 2,896,421 | 611,303 |
| Events in quadrant B | 2,387,304 | 622,199 |
| Events in quadrant C | 2,531,107 | 604,541 |
| Events in quadrant D | 2,698,476 | 558,117 |
| Mode M0 | |||
|---|---|---|---|
| Quadrant | BADHDUFLAG | Total packets | Discarded packets |
| A | 0 | 12119 | 2 |
| B | 0 | 11377 | 2 |
| C | 0 | 11309 | 2 |
| D | 0 | 12389 | 3 |
| Mode M9 | |||
|---|---|---|---|
| Quadrant | BADHDUFLAG | Total packets | Discarded packets |
| A | 0 | 31 | 0 |
| B | 0 | 32 | 0 |
| C | 0 | 32 | 0 |
| D | 0 | 32 | 0 |
| Mode SS | |||
|---|---|---|---|
| Quadrant | BADHDUFLAG | Total packets | Discarded packets |
| A | 0 | 116 | 0 |
| B | 0 | 116 | 0 |
| C | 0 | 116 | 0 |
| D | 0 | 116 | 0 |
| Quadrant | Total seconds | Saturated seconds | Saturation percentage |
|---|---|---|---|
| A | 5610 | 7 | 0.124777% |
| B | 5610 | 5 | 0.089127% |
| C | 5610 | 5 | 0.089127% |
| D | 5609 | 52 | 0.927081% |
Noise dominated data is calculated using 1-second bins in cleaned event files. If a bin has >2000 counts, and if more than 50% of those come from <1% of pixels, then it is considered to be noise-dominated and hence unusable.
| Quadrant | # 1 sec bins | Bins with >0 counts | Bins with >2000 counts | High rate bins dominated by noise | Noise dominated (total time) | Noise dominated (detector-on time) | Marked lightcurve |
|---|---|---|---|---|---|---|---|
| A | 7344 | 5611 | 3 | 3 | 0.04% | 0.05% | 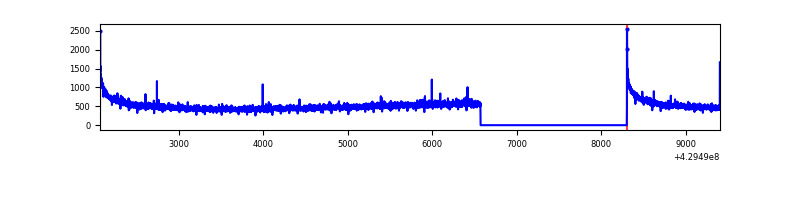 |
| B | 7344 | 5611 | 2 | 2 | 0.03% | 0.04% | 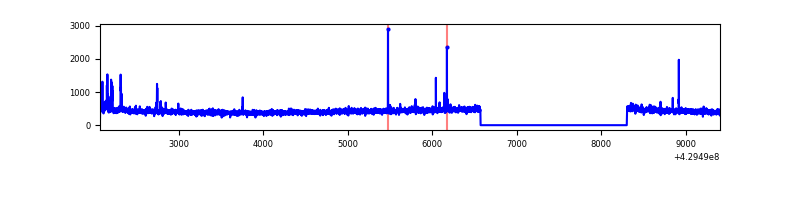 |
| C | 7344 | 5611 | 0 | 0 | 0.00% | 0.00% | 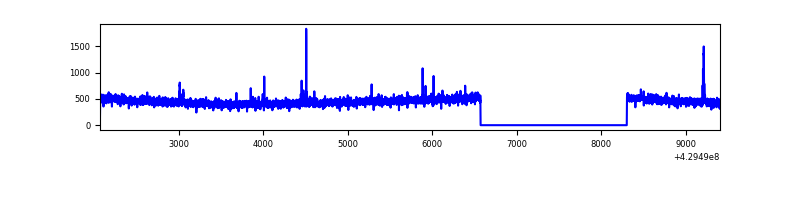 |
| D | 7343 | 5610 | 45 | 45 | 0.61% | 0.80% | 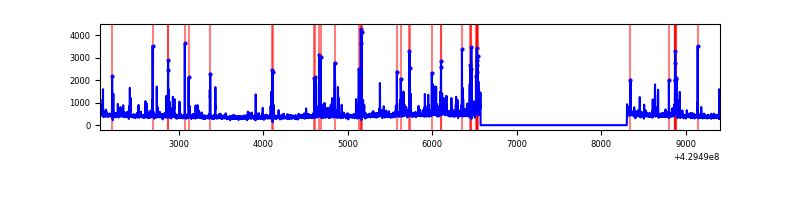 |
Top three noisy pixels from each quadrant. If the there are fewer than three noisy pixels in the level2.evt file, extra rows are filled as -1
| Pixel properties | Quadrant properties | ||||||
|---|---|---|---|---|---|---|---|
| Quadrant | DetID | PixID | Counts | Sigma | Mean | Median | Sigma |
| A | 10 | 83 | 571693 | 4637.35 | 594 | 582 | 123.2 |
| A | 2 | 79 | 12388 | 95.86 | 594 | 582 | 123.2 |
| A | 13 | 254 | 8718 | 66.06 | 594 | 582 | 123.2 |
| B | 0 | 229 | 24099 | 206.4 | 590 | 574 | 114.0 |
| B | 5 | 255 | 21960 | 187.63 | 590 | 574 | 114.0 |
| B | 12 | 111 | 14396 | 121.27 | 590 | 574 | 114.0 |
| C | 15 | 214 | 236554 | 1724.85 | 582 | 584 | 136.8 |
| C | 14 | 254 | 18027 | 127.5 | 582 | 584 | 136.8 |
| C | 15 | 111 | 7443 | 50.14 | 582 | 584 | 136.8 |
| D | 12 | 6 | 94656 | 668.4 | 578 | 562 | 140.8 |
| D | 1 | 52 | 85535 | 603.61 | 578 | 562 | 140.8 |
| D | 13 | 249 | 81085 | 572.0 | 578 | 562 | 140.8 |
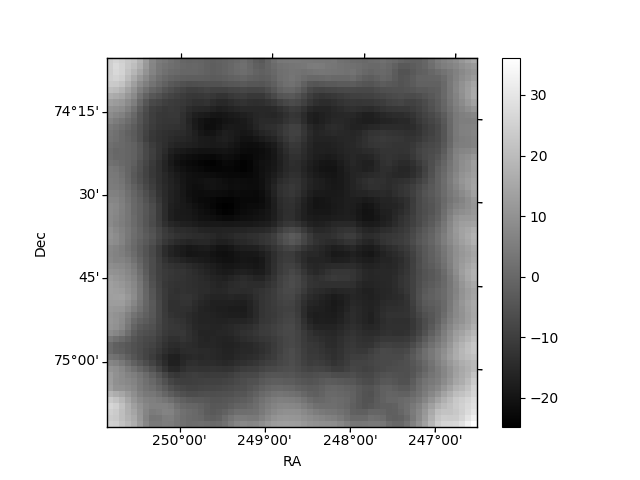
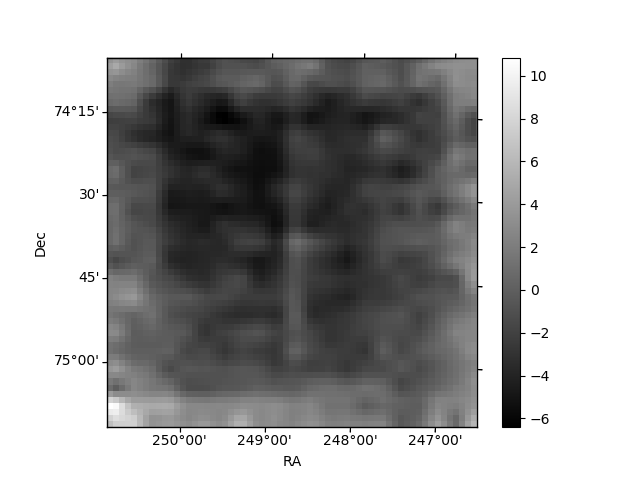
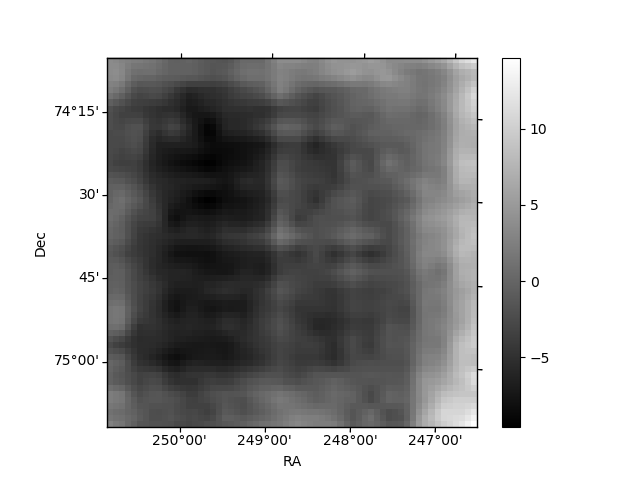
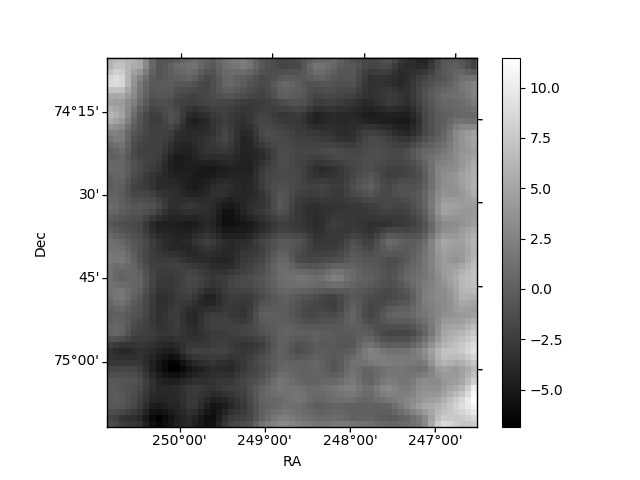
Histogram calculated using DETX and DETY for each event in the final _common_clean file
| Quadrant A | 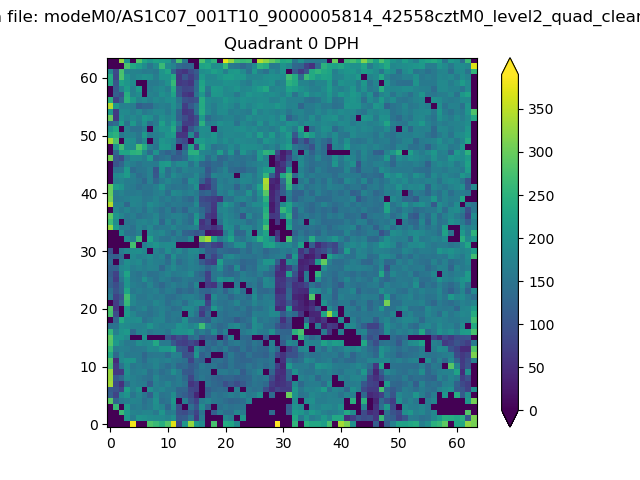 |
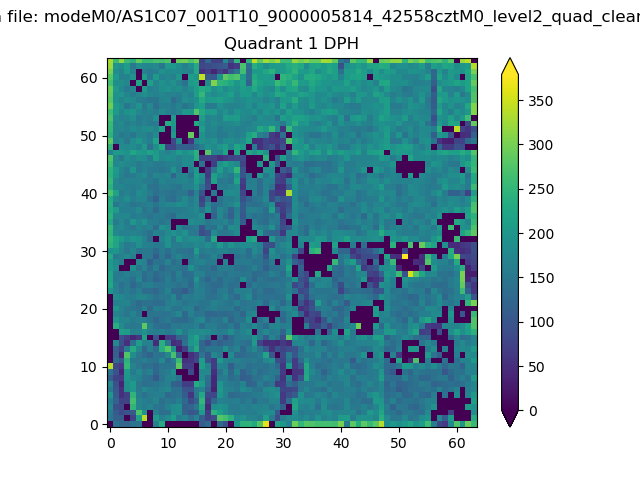 |
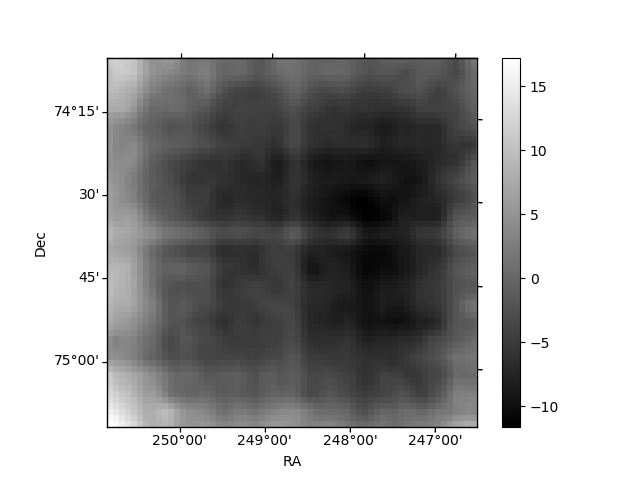
Quadrant B |
|---|---|---|---|
| Quadrant D | 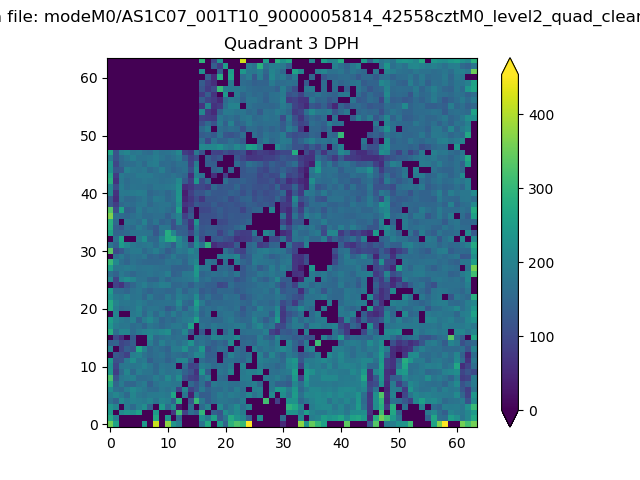 |
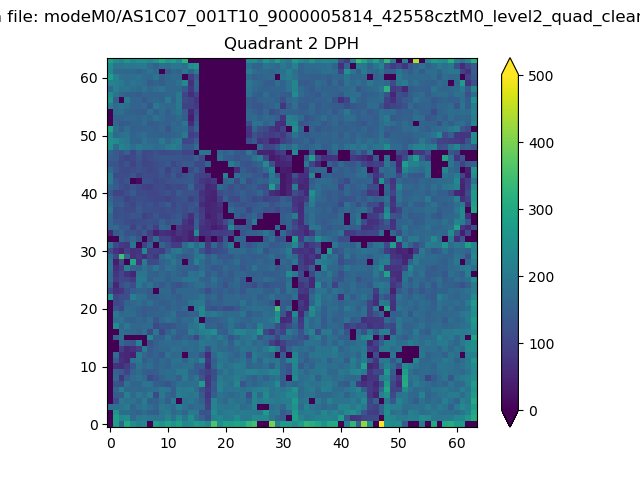 |
Quadrant C |
| Plot type | Count rate plots | Images |
|---|---|---|
| Comparison with Poisson distribution Blue bars denote a histogram of data divided into 1 sec bins. Red curve is a Poisson curve with rate = median count rate of data. |
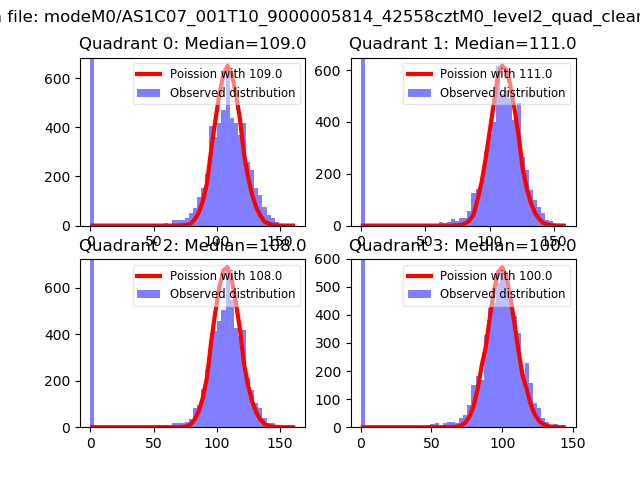 |
 |
| Quadrant-wise count rates Data is divided into 100 sec bins |
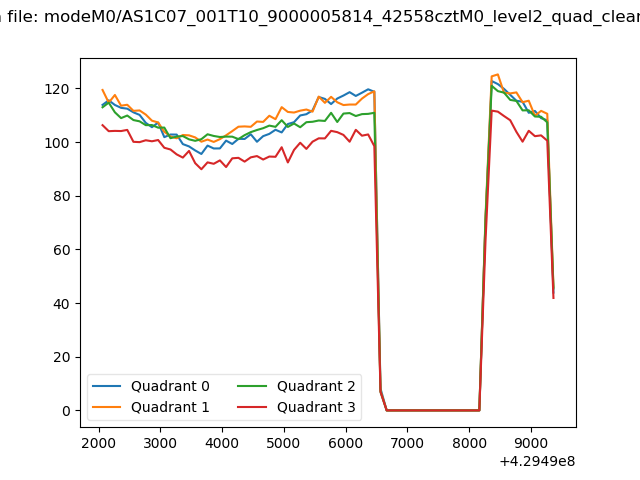 |
|
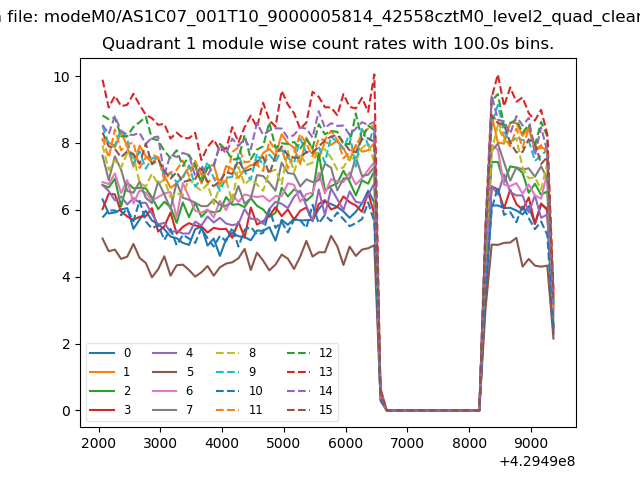
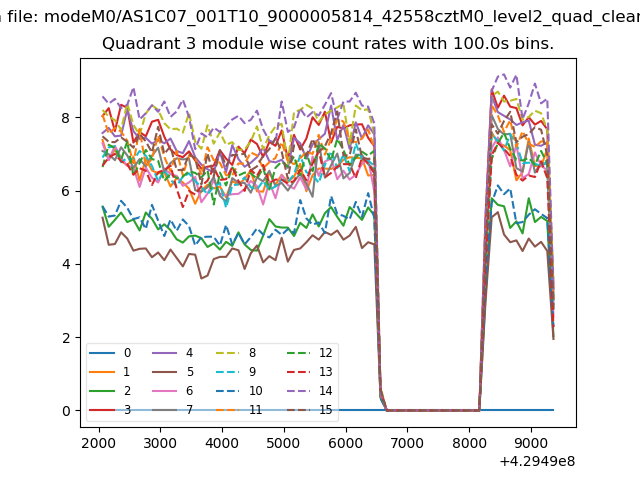
| Module-wise count rates for Quadrant A Data is divided into 100 sec bins |
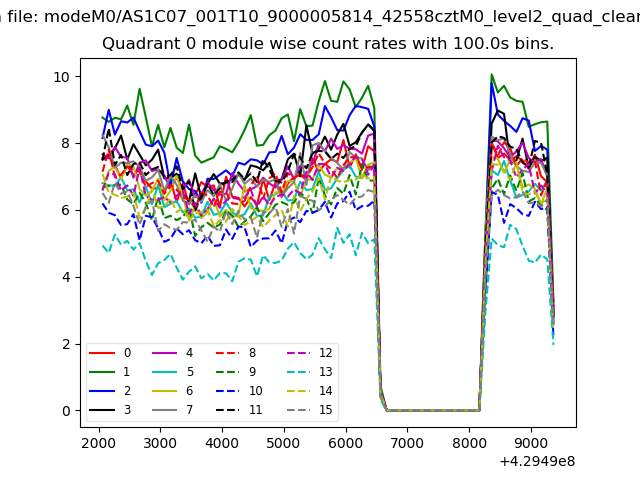 |
 |
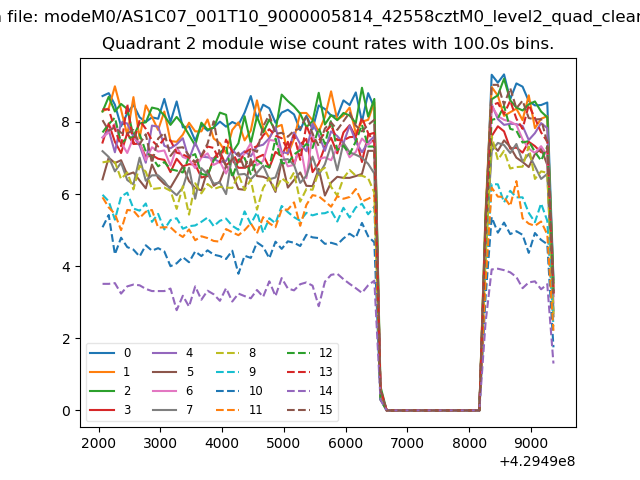
| Module-wise count rates for Quadrant B Data is divided into 100 sec bins |
 |
 |
| Module-wise count rates for Quadrant C Data is divided into 100 sec bins |
 |
 |
| Module-wise count rates for Quadrant D Data is divided into 100 sec bins |
 |
 |
| Parameter | Plot |
|---|---|
| CZT HV Monitor | 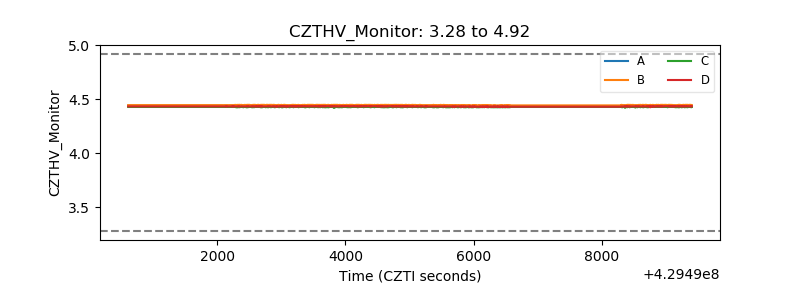 |
| D_VDD | 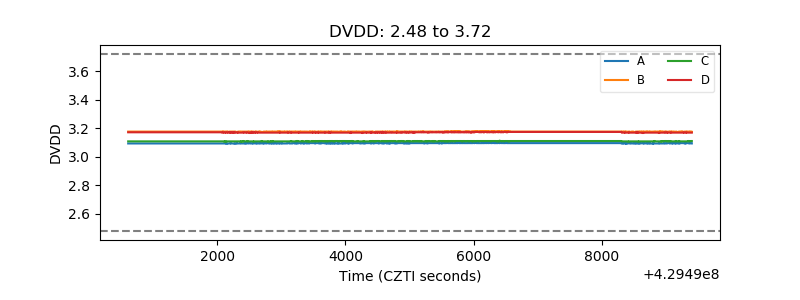 |
| Temperature 1 | 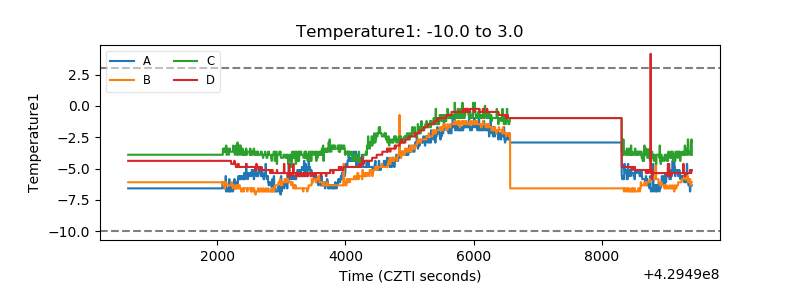 |
| Veto HV Monitor | 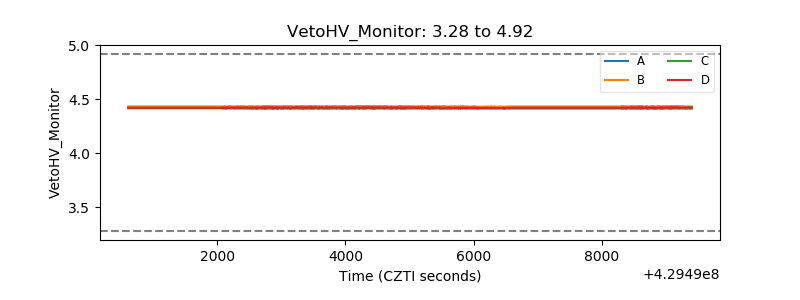 |
| Veto LLD | 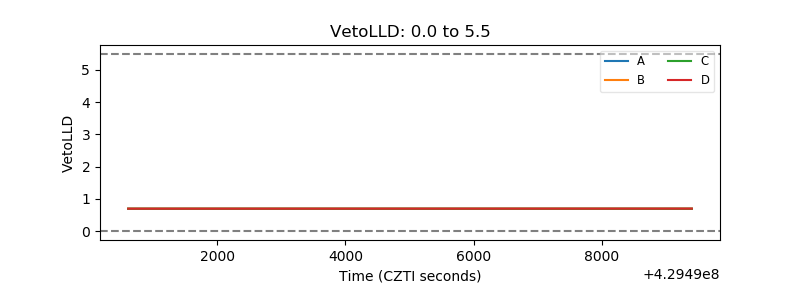 |
| Alpha Counter | 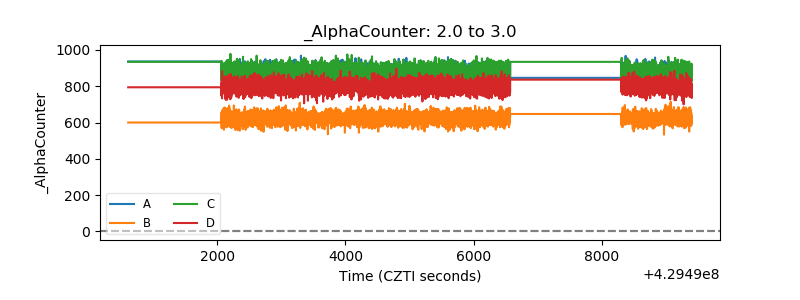 |
| _CPM_Rate | 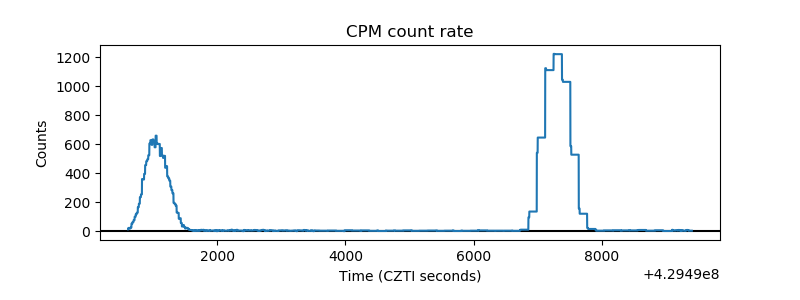 |
| CZT Counter | 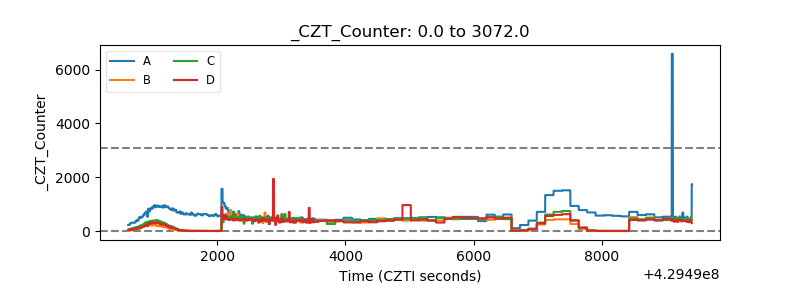 |
| +2.5 Volts monitor | 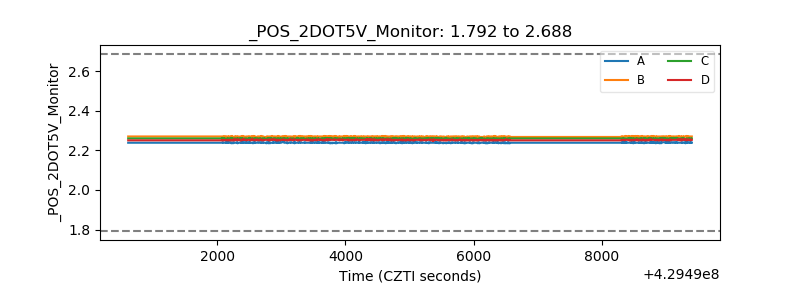 |
| +5 Volts monitor | 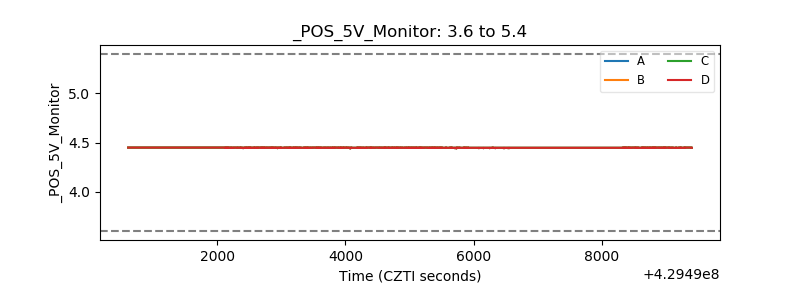 |
| _ROLL_ROT | 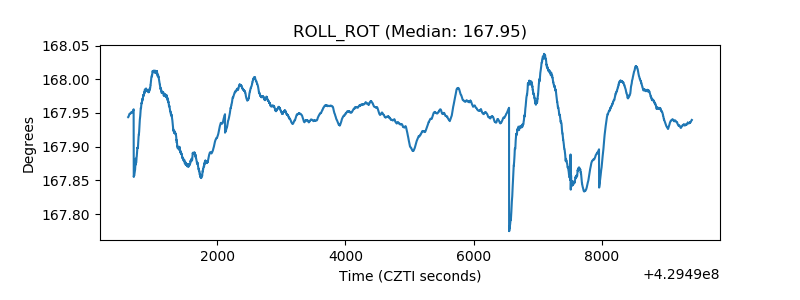 |
| _Roll_DEC | 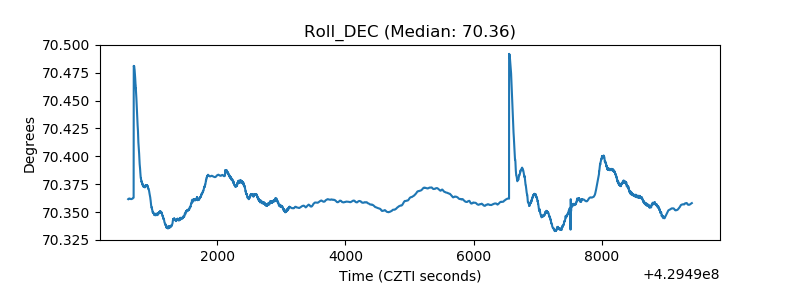 |
| _Roll_RA | 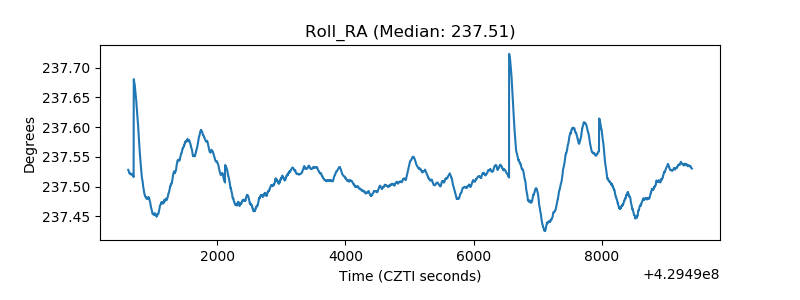 |
| Veto Counter | 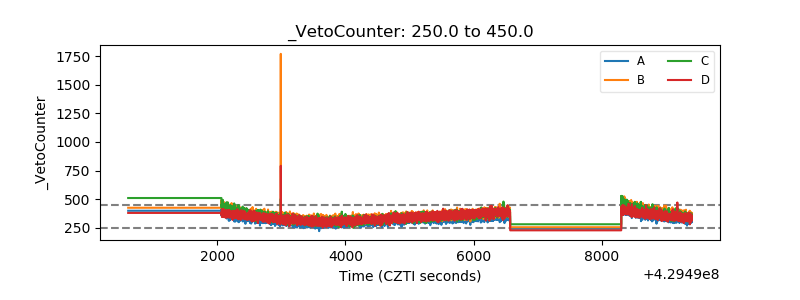 |