| Param | Original file | Final file |
|---|---|---|
| Filename | modeM0/AS1C07_001T10_9000005814_42559cztM0_level2.fits | modeM0/AS1C07_001T10_9000005814_42559cztM0_level2_quad_clean.evt |
| Size (bytes) | 296,375,040 | 90,495,360 |
| Size | 282.6 MB | 86.3 MB |
| Events in quadrant A | 2,816,187 | 604,338 |
| Events in quadrant B | 2,455,290 | 618,768 |
| Events in quadrant C | 2,436,971 | 594,475 |
| Events in quadrant D | 2,844,129 | 547,401 |
| Mode M0 | |||
|---|---|---|---|
| Quadrant | BADHDUFLAG | Total packets | Discarded packets |
| A | 0 | 11607 | 1 |
| B | 0 | 11168 | 1 |
| C | 0 | 10788 | 1 |
| D | 0 | 12421 | 1 |
| Mode M9 | |||
|---|---|---|---|
| Quadrant | BADHDUFLAG | Total packets | Discarded packets |
| A | 0 | 19 | 0 |
| B | 0 | 19 | 0 |
| C | 0 | 19 | 0 |
| D | 0 | 19 | 0 |
| Mode SS | |||
|---|---|---|---|
| Quadrant | BADHDUFLAG | Total packets | Discarded packets |
| A | 0 | 108 | 0 |
| B | 0 | 108 | 0 |
| C | 0 | 108 | 0 |
| D | 0 | 108 | 0 |
| Quadrant | Total seconds | Saturated seconds | Saturation percentage |
|---|---|---|---|
| A | 5363 | 9 | 0.167817% |
| B | 5363 | 5 | 0.093231% |
| C | 5363 | 2 | 0.037293% |
| D | 5363 | 74 | 1.379825% |
Noise dominated data is calculated using 1-second bins in cleaned event files. If a bin has >2000 counts, and if more than 50% of those come from <1% of pixels, then it is considered to be noise-dominated and hence unusable.
| Quadrant | # 1 sec bins | Bins with >0 counts | Bins with >2000 counts | High rate bins dominated by noise | Noise dominated (total time) | Noise dominated (detector-on time) | Marked lightcurve |
|---|---|---|---|---|---|---|---|
| A | 7246 | 5364 | 2 | 2 | 0.03% | 0.04% | 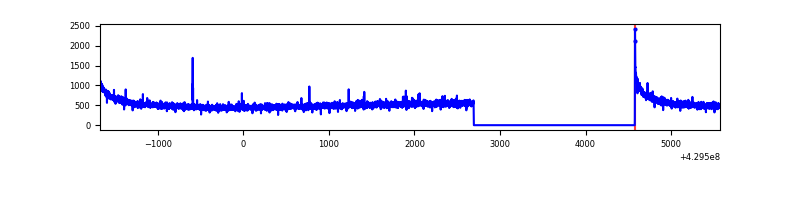 |
| B | 7246 | 5364 | 1 | 1 | 0.01% | 0.02% | 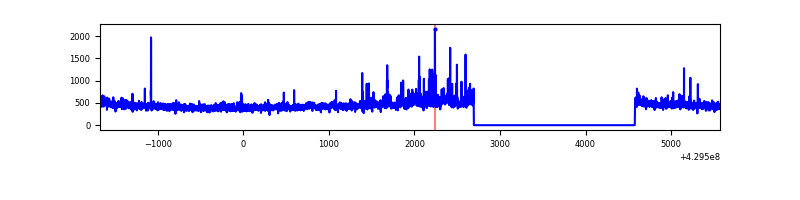 |
| C | 7246 | 5364 | 0 | 0 | 0.00% | 0.00% | 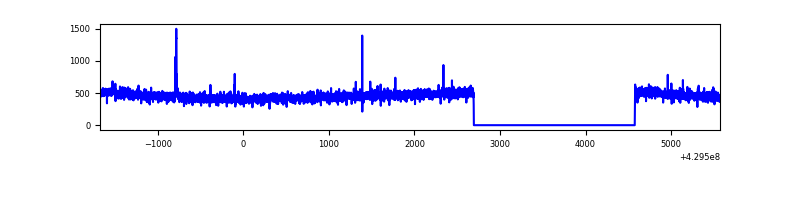 |
| D | 7246 | 5364 | 67 | 67 | 0.92% | 1.25% | 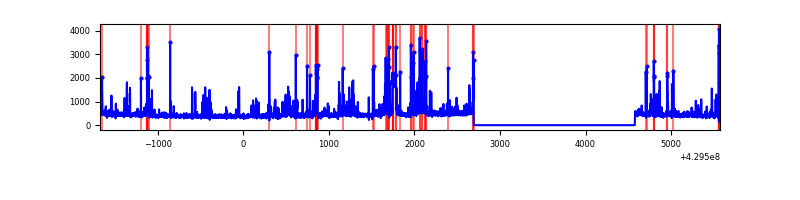 |
Top three noisy pixels from each quadrant. If the there are fewer than three noisy pixels in the level2.evt file, extra rows are filled as -1
| Pixel properties | Quadrant properties | ||||||
|---|---|---|---|---|---|---|---|
| Quadrant | DetID | PixID | Counts | Sigma | Mean | Median | Sigma |
| A | 10 | 83 | 541182 | 4529.18 | 582 | 570 | 119.4 |
| A | 2 | 79 | 11793 | 94.02 | 582 | 570 | 119.4 |
| A | 13 | 254 | 7826 | 60.79 | 582 | 570 | 119.4 |
| B | 0 | 245 | 150602 | 1364.01 | 576 | 560 | 110.0 |
| B | 15 | 32 | 14203 | 124.03 | 576 | 560 | 110.0 |
| B | 12 | 111 | 13976 | 121.96 | 576 | 560 | 110.0 |
| C | 15 | 214 | 223460 | 1704.89 | 563 | 566 | 130.7 |
| C | 14 | 254 | 11553 | 84.04 | 563 | 566 | 130.7 |
| C | 9 | 54 | 6683 | 46.79 | 563 | 566 | 130.7 |
| D | 2 | 249 | 134467 | 983.65 | 562 | 547 | 136.1 |
| D | 13 | 249 | 128385 | 938.98 | 562 | 547 | 136.1 |
| D | 1 | 52 | 116119 | 848.89 | 562 | 547 | 136.1 |
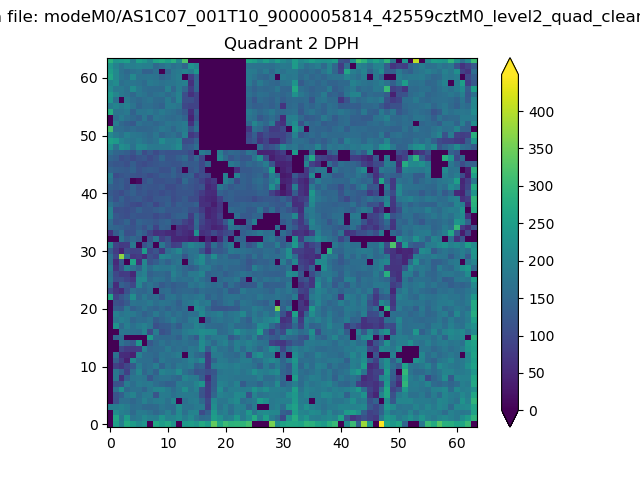
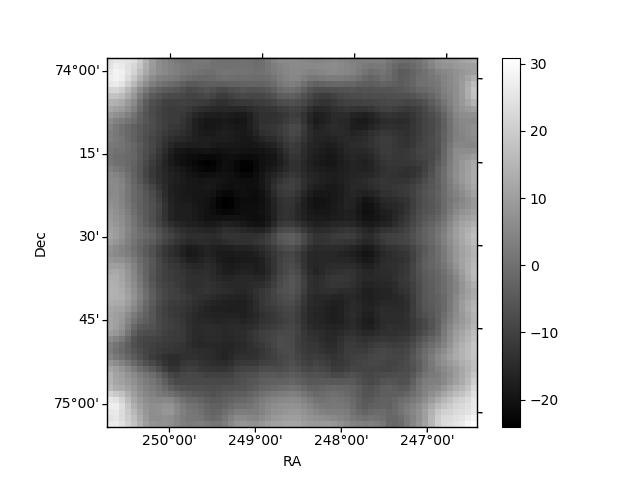
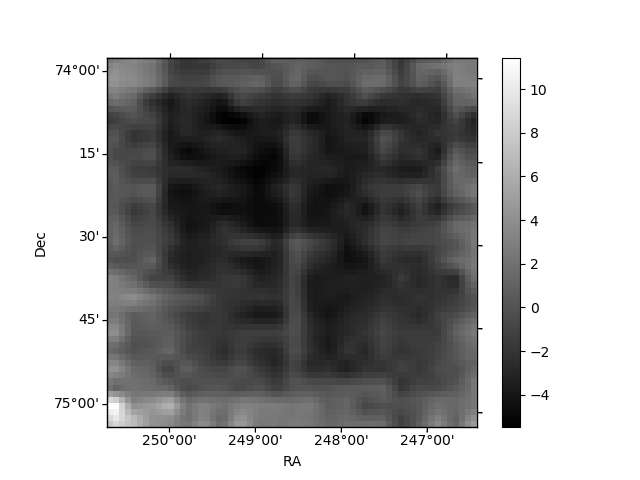
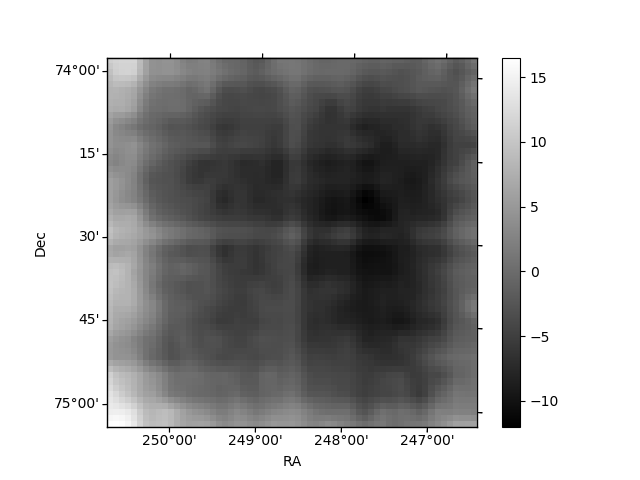
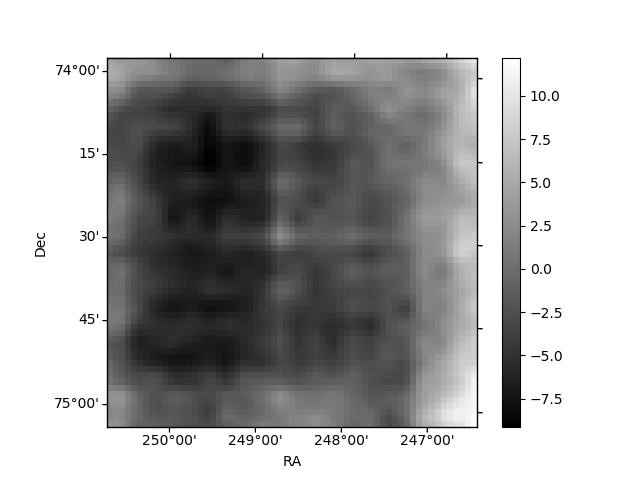
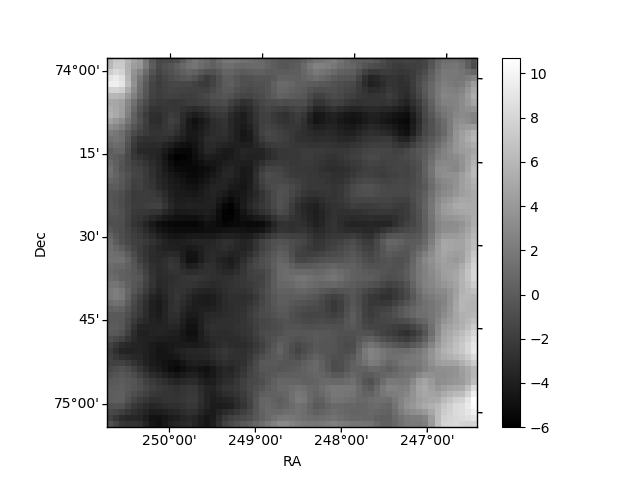
Histogram calculated using DETX and DETY for each event in the final _common_clean file
| Quadrant A | 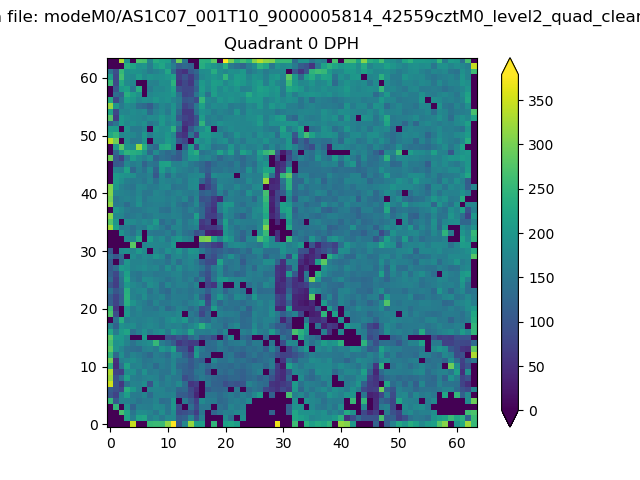 |
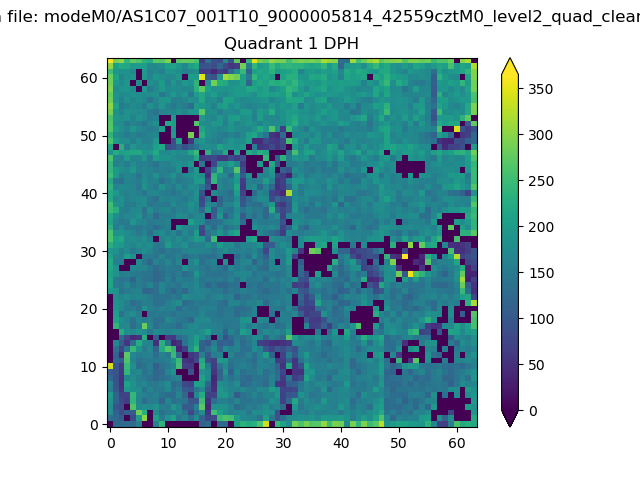 |
Quadrant B |
|---|---|---|---|
| Quadrant D | 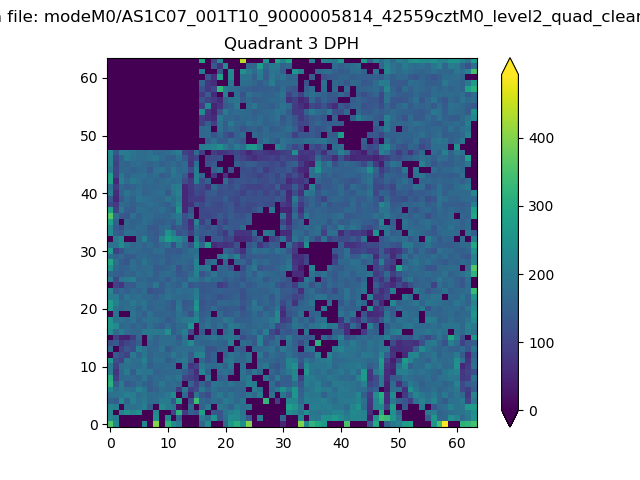 |
 |
Quadrant C |
| Plot type | Count rate plots | Images |
|---|---|---|
| Comparison with Poisson distribution Blue bars denote a histogram of data divided into 1 sec bins. Red curve is a Poisson curve with rate = median count rate of data. |
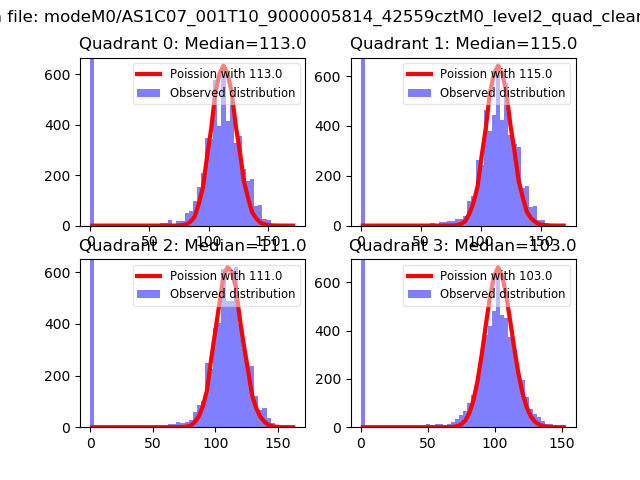 |
 |
| Quadrant-wise count rates Data is divided into 100 sec bins |
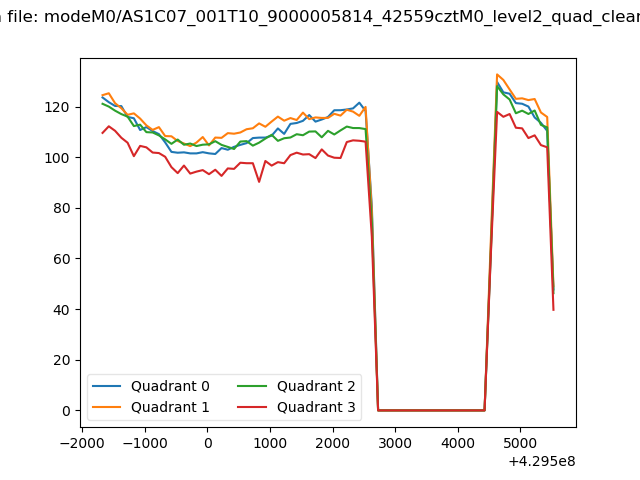 |
|
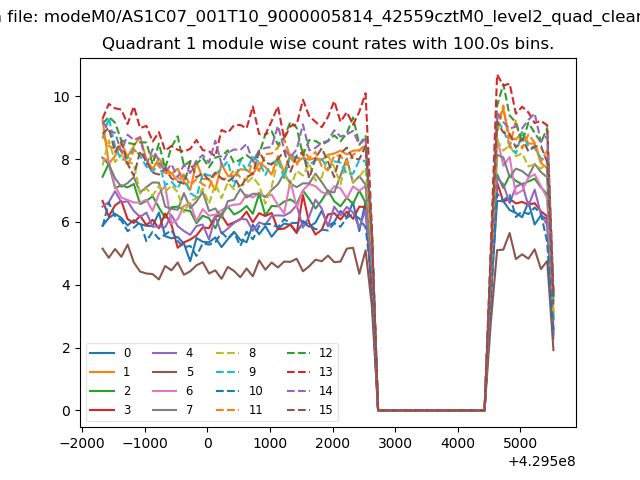
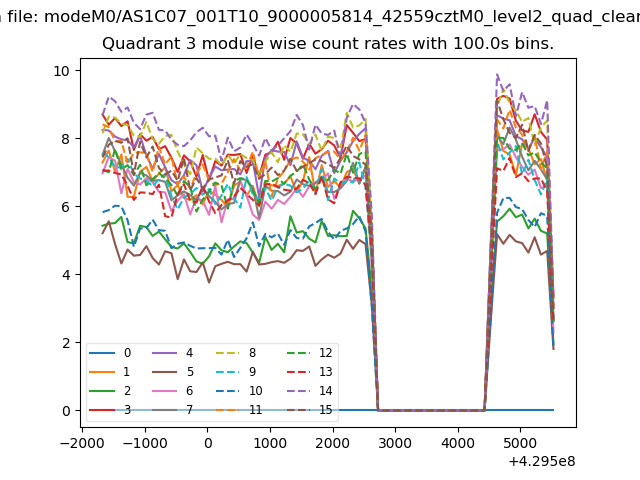
| Module-wise count rates for Quadrant A Data is divided into 100 sec bins |
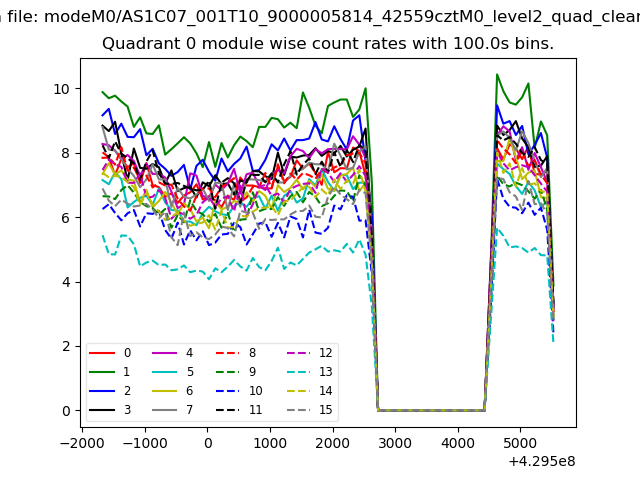 |
 |
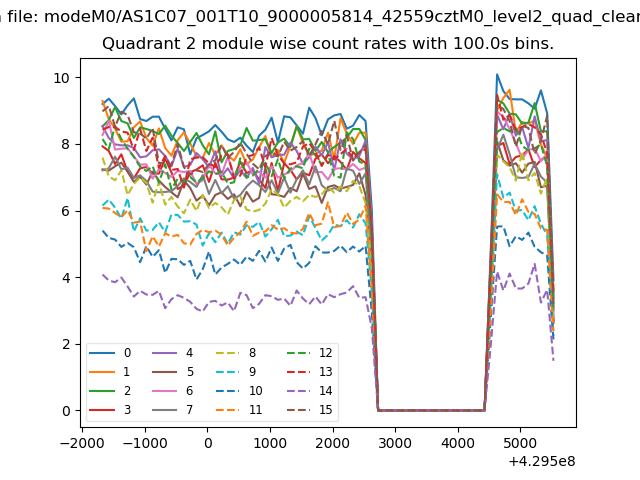
| Module-wise count rates for Quadrant B Data is divided into 100 sec bins |
 |
 |
| Module-wise count rates for Quadrant C Data is divided into 100 sec bins |
 |
 |
| Module-wise count rates for Quadrant D Data is divided into 100 sec bins |
 |
 |
| Parameter | Plot |
|---|---|
| CZT HV Monitor |  |
| D_VDD | 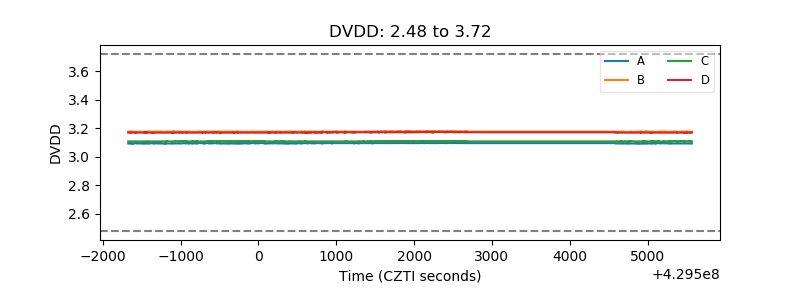 |
| Temperature 1 | 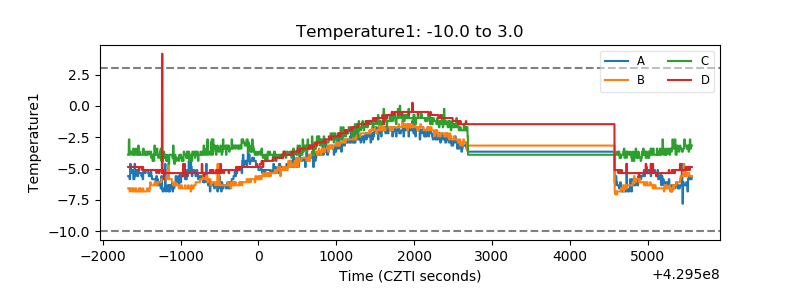 |
| Veto HV Monitor | 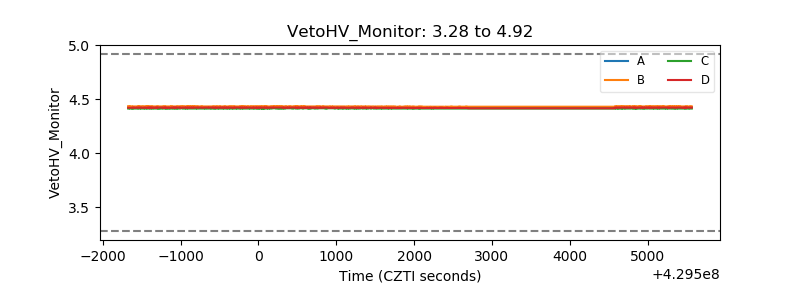 |
| Veto LLD | 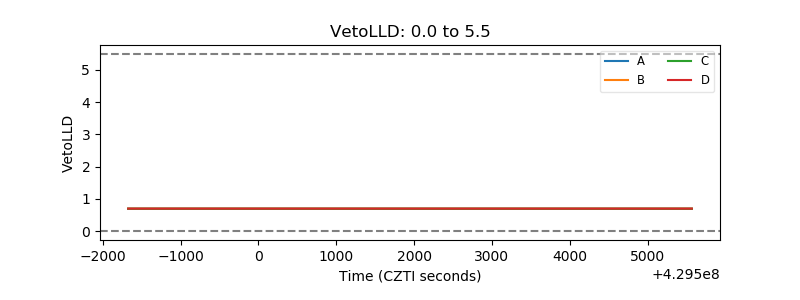 |
| Alpha Counter | 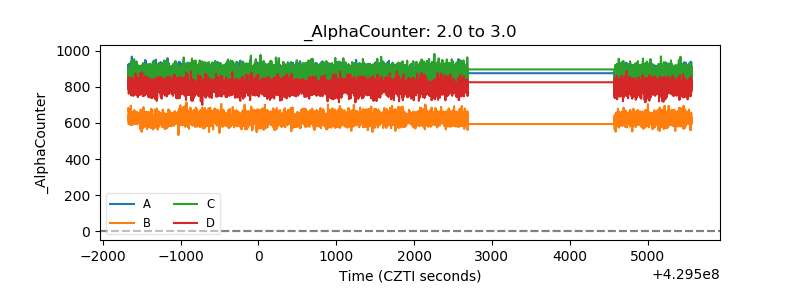 |
| _CPM_Rate |  |
| CZT Counter | 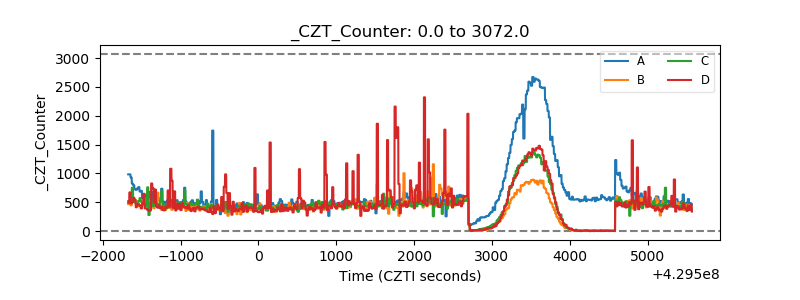 |
| +2.5 Volts monitor | 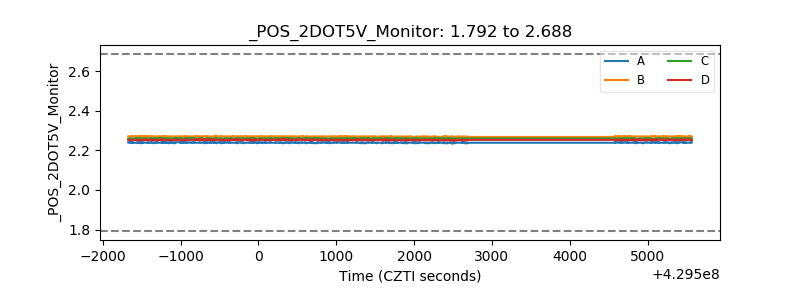 |
| +5 Volts monitor | 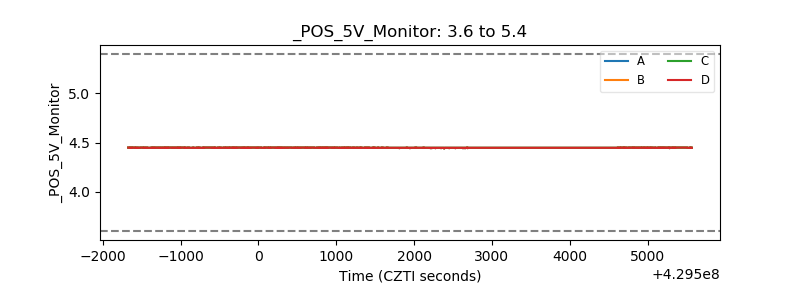 |
| _ROLL_ROT | 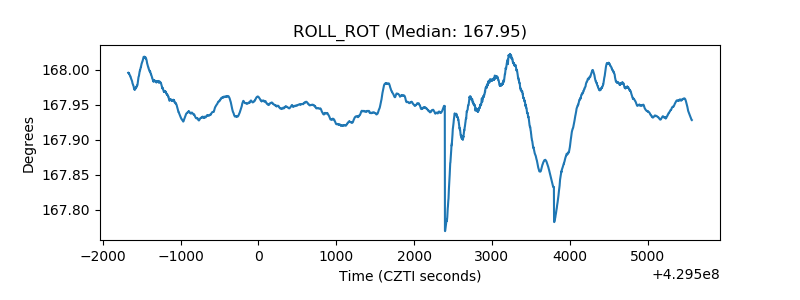 |
| _Roll_DEC | 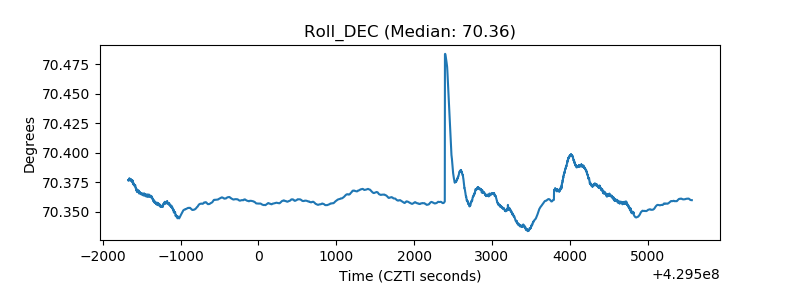 |
| _Roll_RA | 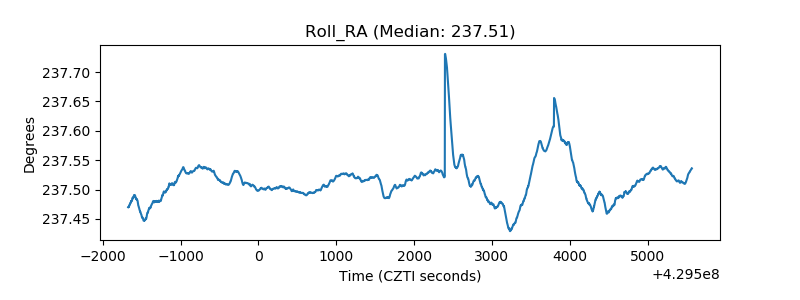 |
| Veto Counter | 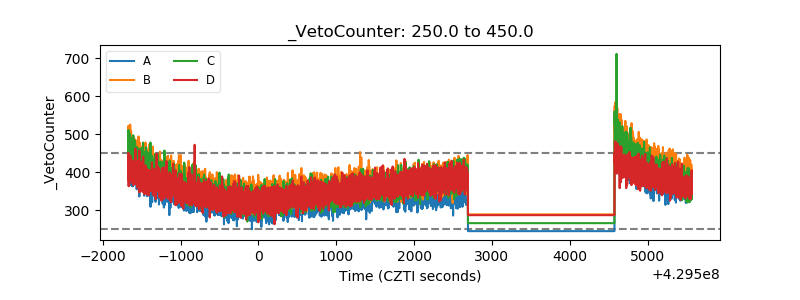 |