| Param | Original file | Final file |
|---|---|---|
| Filename | modeM0/AS1C07_001T10_9000005814_42560cztM0_level2.fits | modeM0/AS1C07_001T10_9000005814_42560cztM0_level2_quad_clean.evt |
| Size (bytes) | 304,427,520 | 89,066,880 |
| Size | 290.3 MB | 84.9 MB |
| Events in quadrant A | 2,873,467 | 602,775 |
| Events in quadrant B | 2,614,786 | 613,867 |
| Events in quadrant C | 2,368,101 | 584,561 |
| Events in quadrant D | 3,012,659 | 536,201 |
| Mode M0 | |||
|---|---|---|---|
| Quadrant | BADHDUFLAG | Total packets | Discarded packets |
| A | 0 | 11558 | 2 |
| B | 0 | 11286 | 2 |
| C | 0 | 10311 | 2 |
| D | 0 | 12570 | 2 |
| Mode M9 | |||
|---|---|---|---|
| Quadrant | BADHDUFLAG | Total packets | Discarded packets |
| A | 0 | 25 | 0 |
| B | 0 | 26 | 0 |
| C | 0 | 26 | 0 |
| D | 0 | 26 | 0 |
| Mode SS | |||
|---|---|---|---|
| Quadrant | BADHDUFLAG | Total packets | Discarded packets |
| A | 0 | 106 | 0 |
| B | 0 | 106 | 0 |
| C | 0 | 106 | 0 |
| D | 0 | 104 | 0 |
| Quadrant | Total seconds | Saturated seconds | Saturation percentage |
|---|---|---|---|
| A | 5130 | 11 | 0.214425% |
| B | 5130 | 62 | 1.208577% |
| C | 5130 | 6 | 0.116959% |
| D | 5130 | 126 | 2.456140% |
Noise dominated data is calculated using 1-second bins in cleaned event files. If a bin has >2000 counts, and if more than 50% of those come from <1% of pixels, then it is considered to be noise-dominated and hence unusable.
| Quadrant | # 1 sec bins | Bins with >0 counts | Bins with >2000 counts | High rate bins dominated by noise | Noise dominated (total time) | Noise dominated (detector-on time) | Marked lightcurve |
|---|---|---|---|---|---|---|---|
| A | 7132 | 5131 | 5 | 5 | 0.07% | 0.10% | 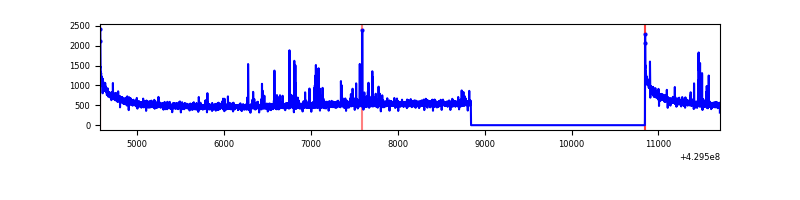 |
| B | 7132 | 5131 | 43 | 43 | 0.60% | 0.84% | 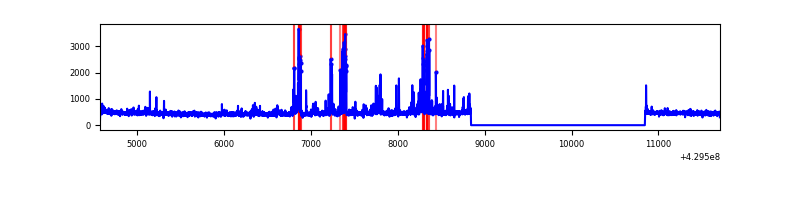 |
| C | 7132 | 5131 | 1 | 1 | 0.01% | 0.02% | 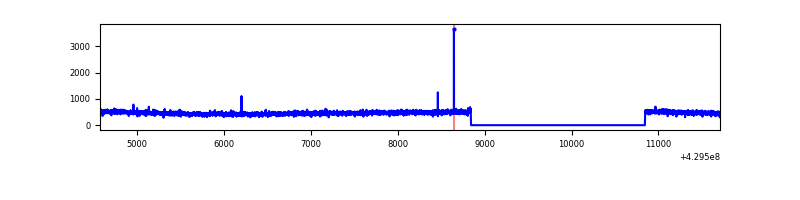 |
| D | 7132 | 5131 | 99 | 99 | 1.39% | 1.93% | 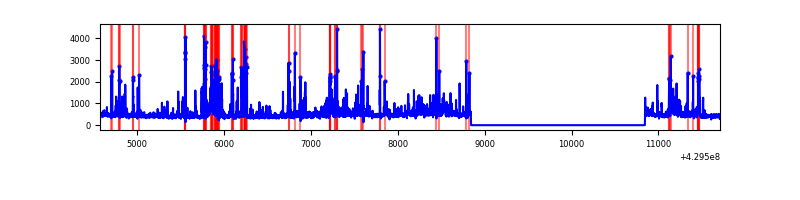 |
Top three noisy pixels from each quadrant. If the there are fewer than three noisy pixels in the level2.evt file, extra rows are filled as -1
| Pixel properties | Quadrant properties | ||||||
|---|---|---|---|---|---|---|---|
| Quadrant | DetID | PixID | Counts | Sigma | Mean | Median | Sigma |
| A | 10 | 83 | 556902 | 4732.42 | 573 | 561 | 117.6 |
| A | 2 | 79 | 86695 | 732.68 | 573 | 561 | 117.6 |
| A | 13 | 6 | 9481 | 75.88 | 573 | 561 | 117.6 |
| B | 5 | 255 | 135631 | 1252.61 | 566 | 551 | 107.8 |
| B | 0 | 245 | 129053 | 1191.61 | 566 | 551 | 107.8 |
| B | 14 | 252 | 102803 | 948.19 | 566 | 551 | 107.8 |
| C | 15 | 214 | 216901 | 1702.21 | 549 | 550 | 127.1 |
| C | 12 | 249 | 6177 | 44.27 | 549 | 550 | 127.1 |
| C | 9 | 54 | 3912 | 26.45 | 549 | 550 | 127.1 |
| D | 1 | 47 | 235918 | 1800.38 | 545 | 532 | 130.7 |
| D | 1 | 52 | 175622 | 1339.2 | 545 | 532 | 130.7 |
| D | 13 | 249 | 171928 | 1310.95 | 545 | 532 | 130.7 |
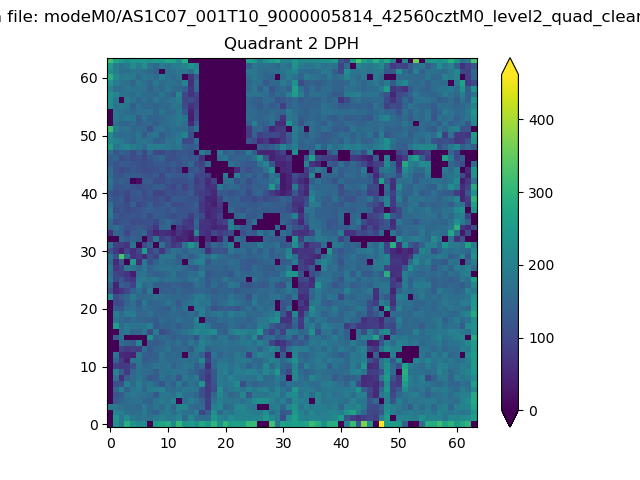
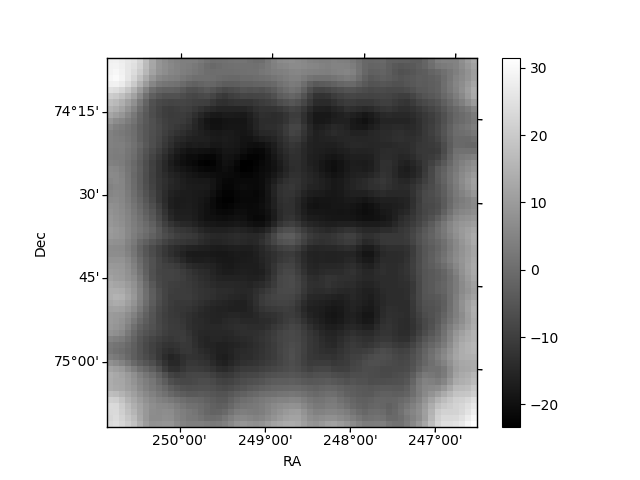
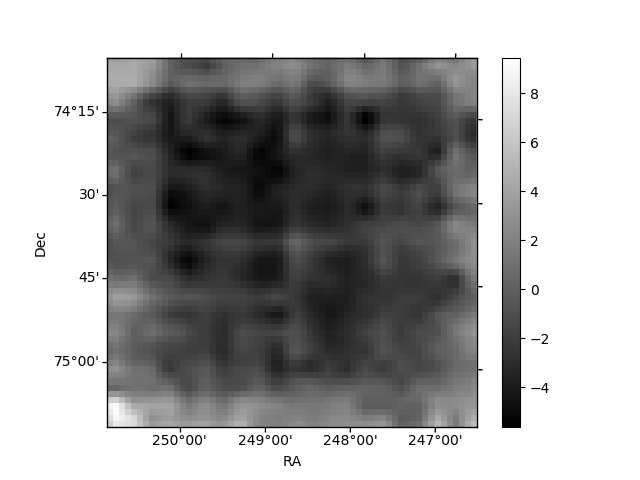
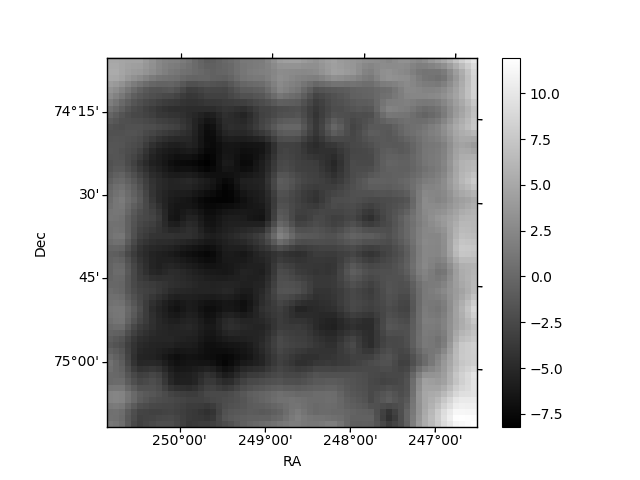
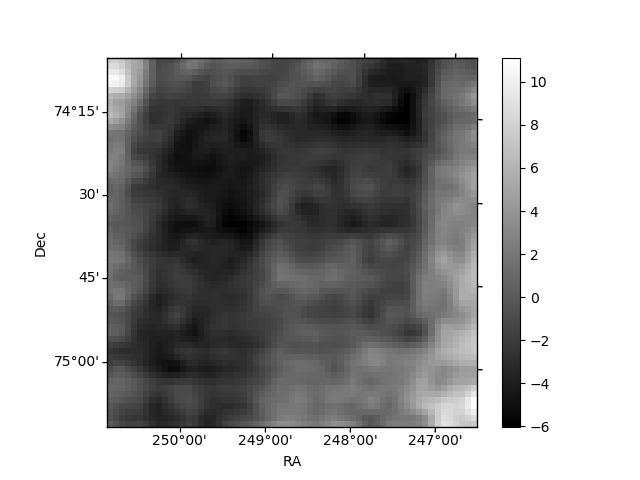
Histogram calculated using DETX and DETY for each event in the final _common_clean file
| Quadrant A | 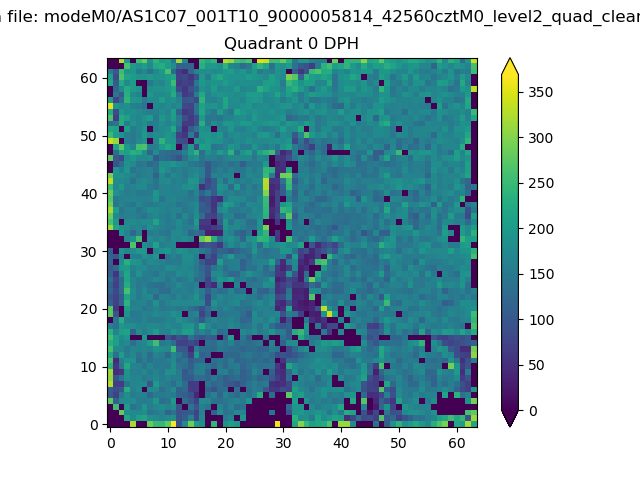 |
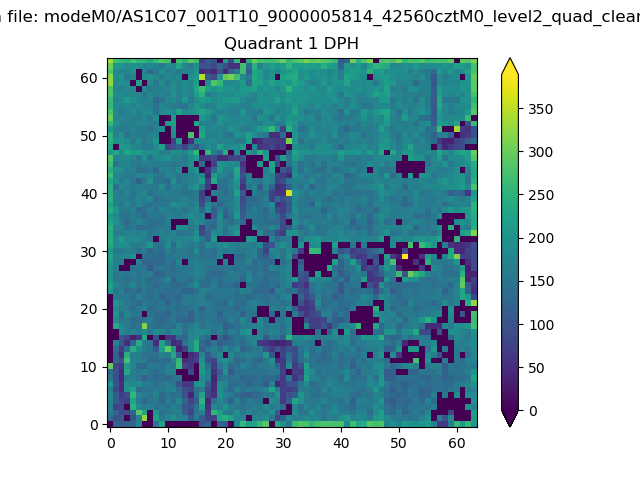 |
Quadrant B |
|---|---|---|---|
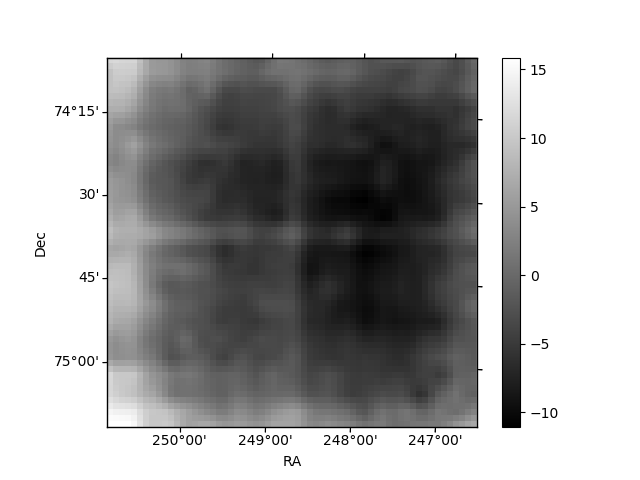
| Quadrant D | 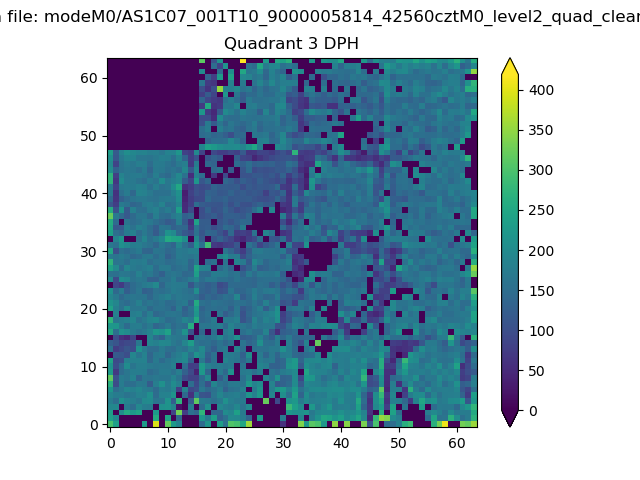 |
 |
Quadrant C |
| Plot type | Count rate plots | Images |
|---|---|---|
| Comparison with Poisson distribution Blue bars denote a histogram of data divided into 1 sec bins. Red curve is a Poisson curve with rate = median count rate of data. |
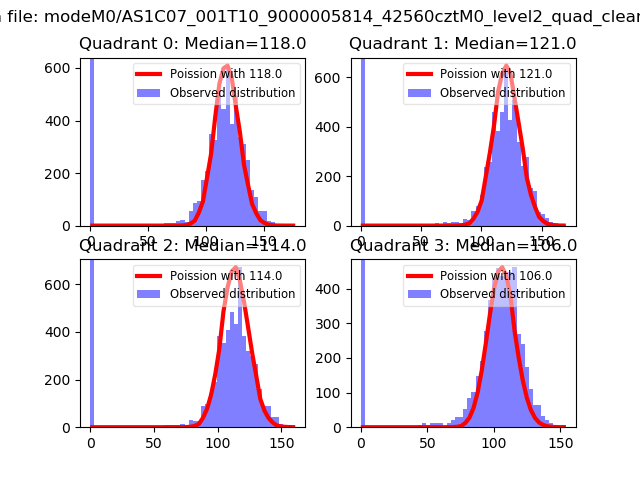 |
 |
| Quadrant-wise count rates Data is divided into 100 sec bins |
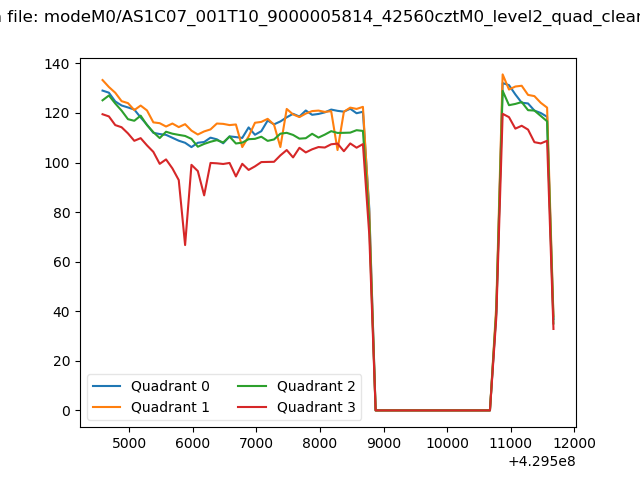 |
|
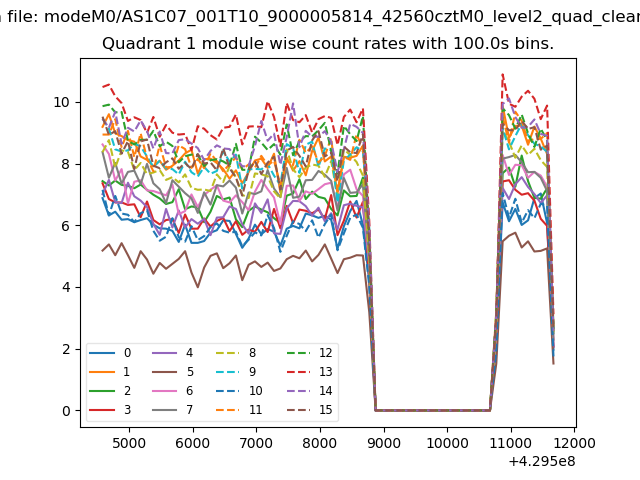
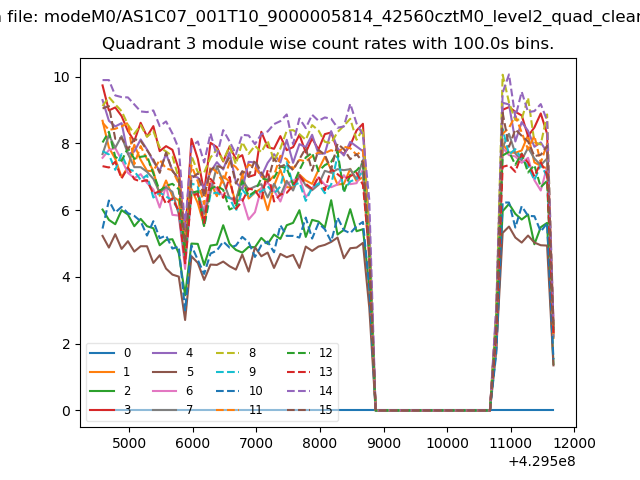
| Module-wise count rates for Quadrant A Data is divided into 100 sec bins |
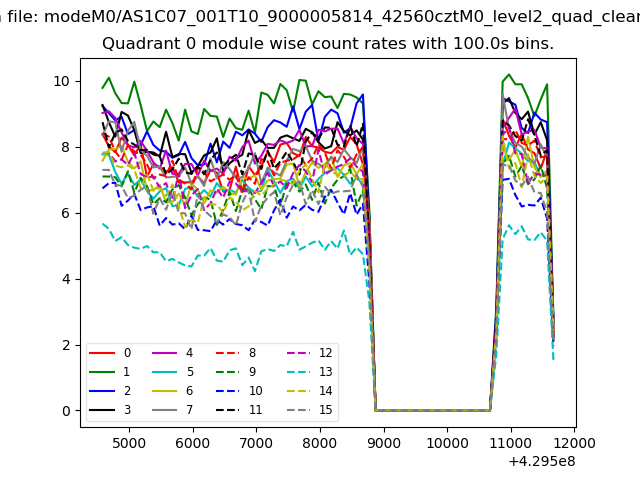 |
 |
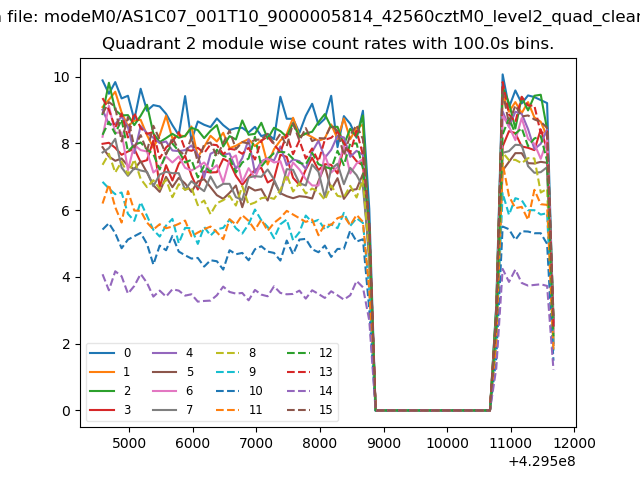
| Module-wise count rates for Quadrant B Data is divided into 100 sec bins |
 |
 |
| Module-wise count rates for Quadrant C Data is divided into 100 sec bins |
 |
 |
| Module-wise count rates for Quadrant D Data is divided into 100 sec bins |
 |
 |
| Parameter | Plot |
|---|---|
| CZT HV Monitor | 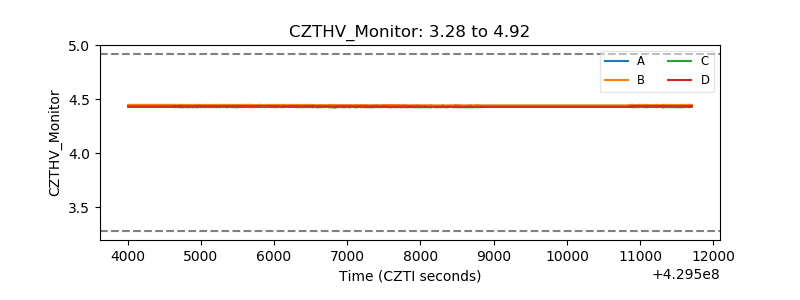 |
| D_VDD | 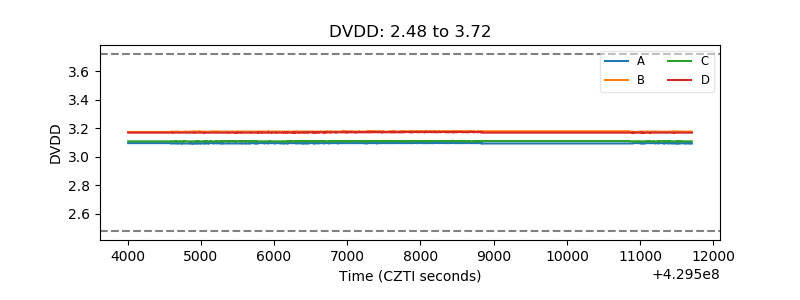 |
| Temperature 1 |  |
| Veto HV Monitor | 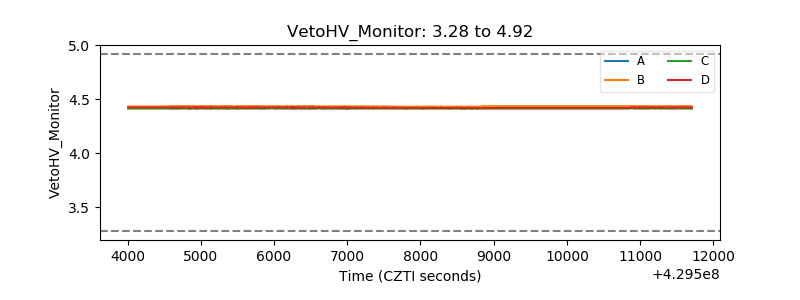 |
| Veto LLD | 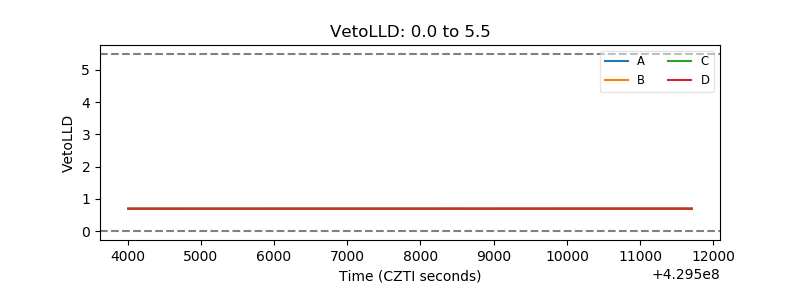 |
| Alpha Counter | 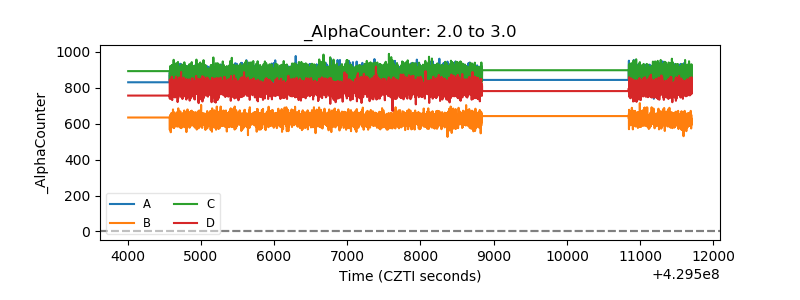 |
| _CPM_Rate | 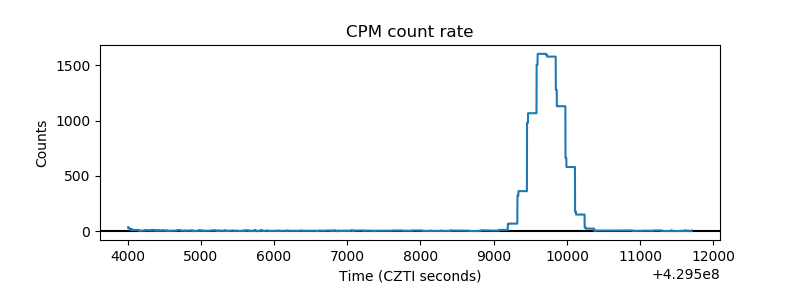 |
| CZT Counter | 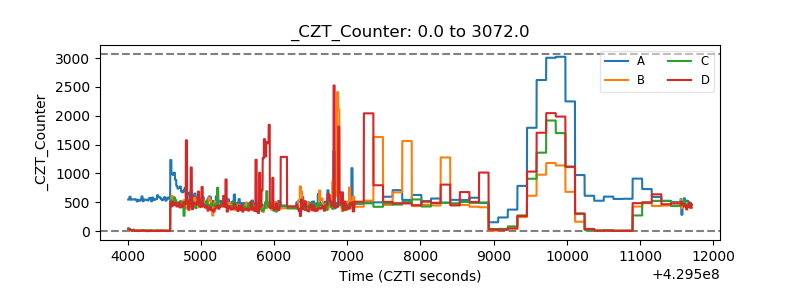 |
| +2.5 Volts monitor | 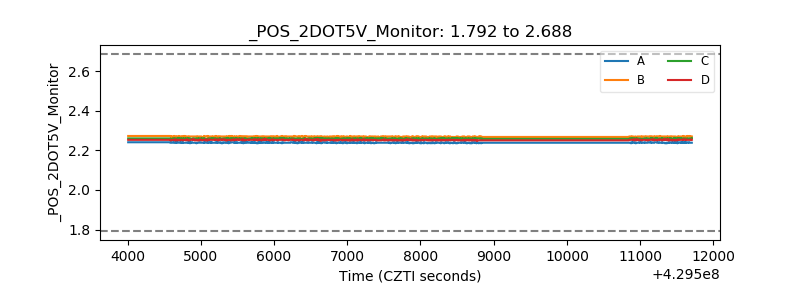 |
| +5 Volts monitor | 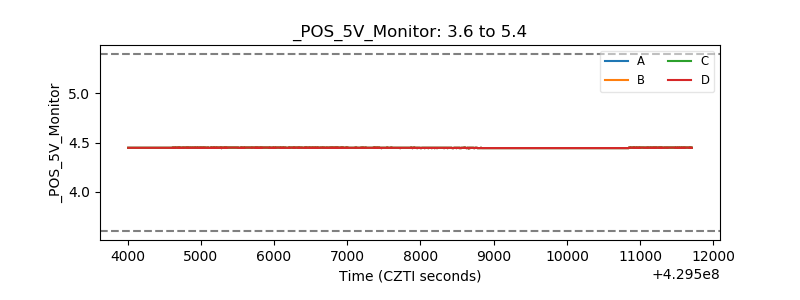 |
| _ROLL_ROT | 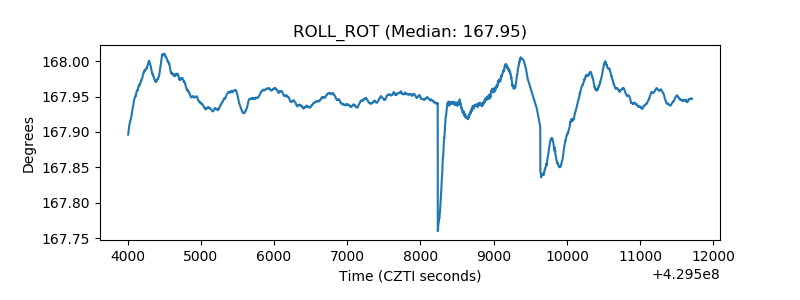 |
| _Roll_DEC | 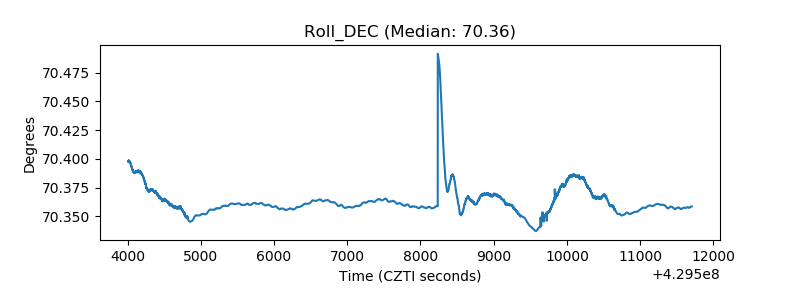 |
| _Roll_RA | 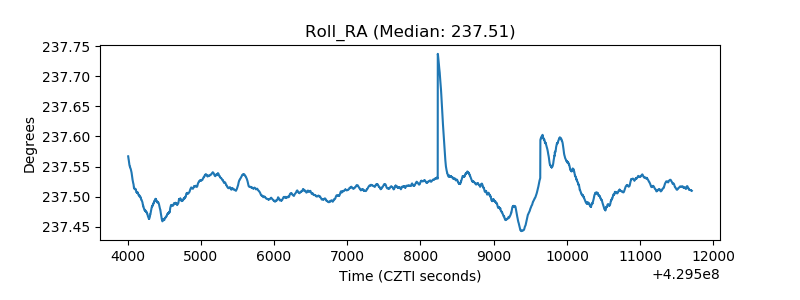 |
| Veto Counter | 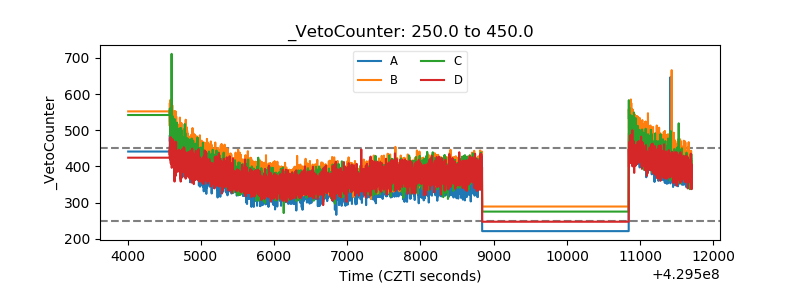 |