| Param | Original file | Final file |
|---|---|---|
| Filename | modeM0/AS1C07_001T10_9000005814_42561cztM0_level2.fits | modeM0/AS1C07_001T10_9000005814_42561cztM0_level2_quad_clean.evt |
| Size (bytes) | 296,936,640 | 87,310,080 |
| Size | 283.2 MB | 83.3 MB |
| Events in quadrant A | 2,785,148 | 597,751 |
| Events in quadrant B | 2,305,999 | 606,769 |
| Events in quadrant C | 2,316,243 | 572,778 |
| Events in quadrant D | 3,198,530 | 519,965 |
| Mode M0 | |||
|---|---|---|---|
| Quadrant | BADHDUFLAG | Total packets | Discarded packets |
| A | 0 | 11145 | 2 |
| B | 0 | 10247 | 2 |
| C | 0 | 9961 | 2 |
| D | 0 | 13049 | 2 |
| Mode M9 | |||
|---|---|---|---|
| Quadrant | BADHDUFLAG | Total packets | Discarded packets |
| A | 0 | 30 | 0 |
| B | 0 | 31 | 0 |
| C | 0 | 31 | 0 |
| D | 0 | 31 | 0 |
| Mode SS | |||
|---|---|---|---|
| Quadrant | BADHDUFLAG | Total packets | Discarded packets |
| A | 0 | 100 | 0 |
| B | 0 | 100 | 0 |
| C | 0 | 100 | 0 |
| D | 0 | 100 | 0 |
| Quadrant | Total seconds | Saturated seconds | Saturation percentage |
|---|---|---|---|
| A | 4945 | 10 | 0.202224% |
| B | 4945 | 28 | 0.566229% |
| C | 4945 | 5 | 0.101112% |
| D | 4945 | 164 | 3.316481% |
Noise dominated data is calculated using 1-second bins in cleaned event files. If a bin has >2000 counts, and if more than 50% of those come from <1% of pixels, then it is considered to be noise-dominated and hence unusable.
| Quadrant | # 1 sec bins | Bins with >0 counts | Bins with >2000 counts | High rate bins dominated by noise | Noise dominated (total time) | Noise dominated (detector-on time) | Marked lightcurve |
|---|---|---|---|---|---|---|---|
| A | 7037 | 4946 | 6 | 6 | 0.09% | 0.12% | 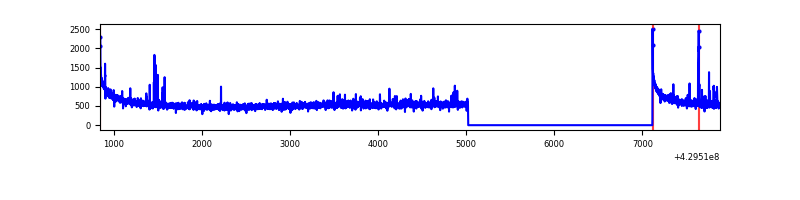 |
| B | 7037 | 4946 | 11 | 11 | 0.16% | 0.22% | 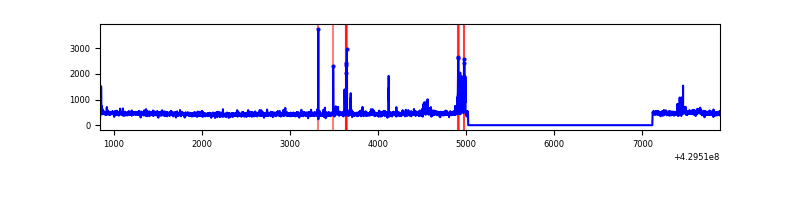 |
| C | 7037 | 4946 | 1 | 1 | 0.01% | 0.02% | 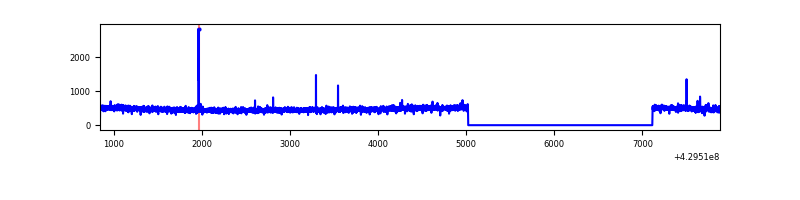 |
| D | 7037 | 4946 | 141 | 141 | 2.00% | 2.85% | 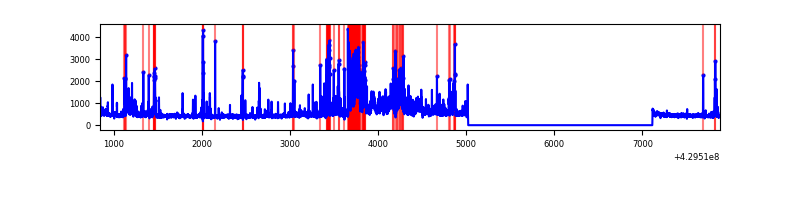 |
Top three noisy pixels from each quadrant. If the there are fewer than three noisy pixels in the level2.evt file, extra rows are filled as -1
| Pixel properties | Quadrant properties | ||||||
|---|---|---|---|---|---|---|---|
| Quadrant | DetID | PixID | Counts | Sigma | Mean | Median | Sigma |
| A | 10 | 83 | 533979 | 4693.29 | 560 | 548 | 113.7 |
| A | 2 | 79 | 43035 | 373.81 | 560 | 548 | 113.7 |
| A | 15 | 223 | 30415 | 262.78 | 560 | 548 | 113.7 |
| B | 14 | 252 | 58615 | 555.31 | 552 | 537 | 104.6 |
| B | 5 | 172 | 29586 | 277.75 | 552 | 537 | 104.6 |
| B | 15 | 32 | 21372 | 199.21 | 552 | 537 | 104.6 |
| C | 15 | 214 | 207870 | 1678.68 | 535 | 540 | 123.5 |
| C | 12 | 249 | 8865 | 67.4 | 535 | 540 | 123.5 |
| C | 14 | 254 | 8000 | 60.4 | 535 | 540 | 123.5 |
| D | 12 | 233 | 515254 | 3981.19 | 533 | 517 | 129.3 |
| D | 1 | 52 | 261537 | 2018.84 | 533 | 517 | 129.3 |
| D | 1 | 47 | 95806 | 737.01 | 533 | 517 | 129.3 |
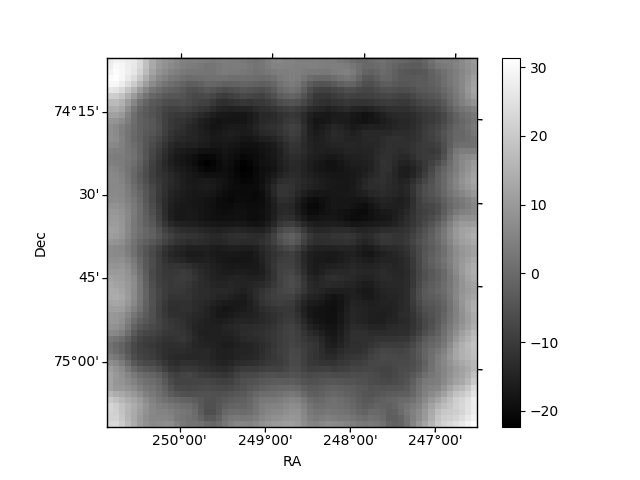
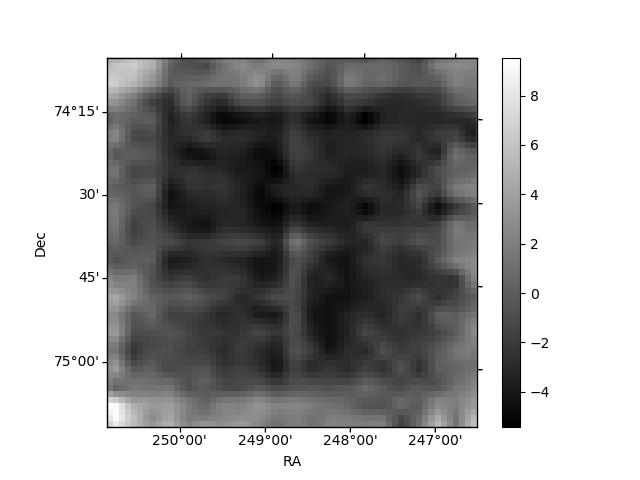
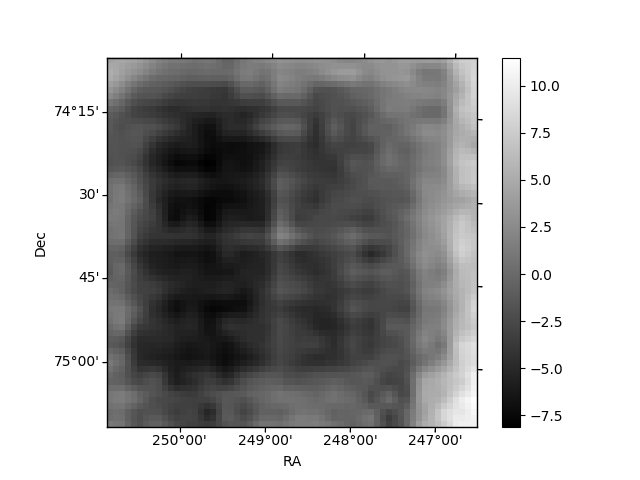
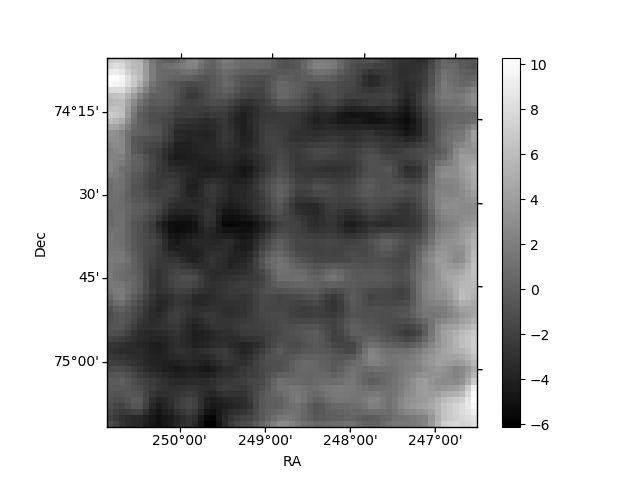
Histogram calculated using DETX and DETY for each event in the final _common_clean file
| Quadrant A | 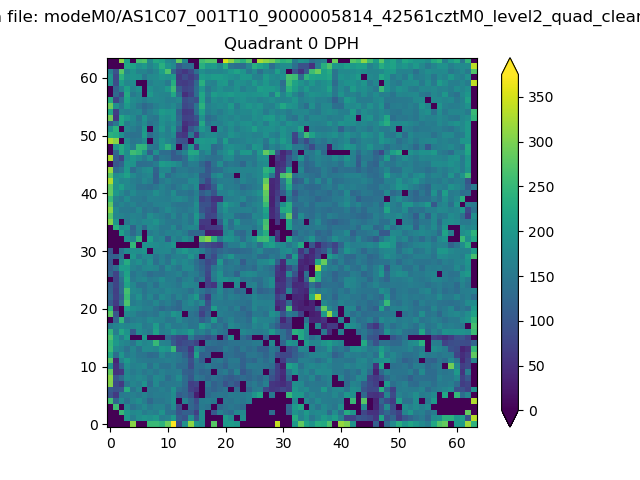 |
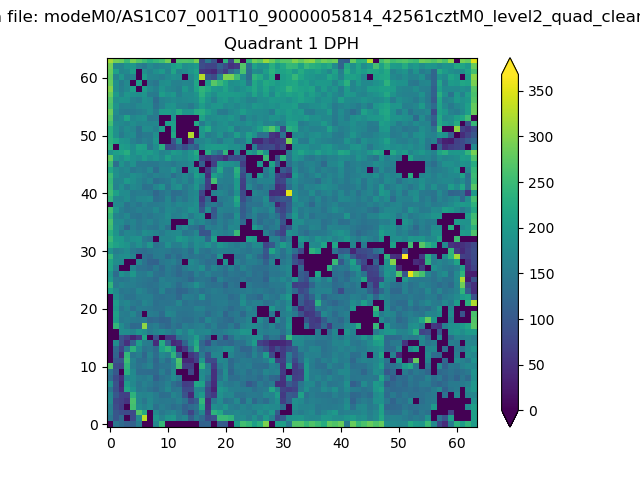 |
Quadrant B |
|---|---|---|---|
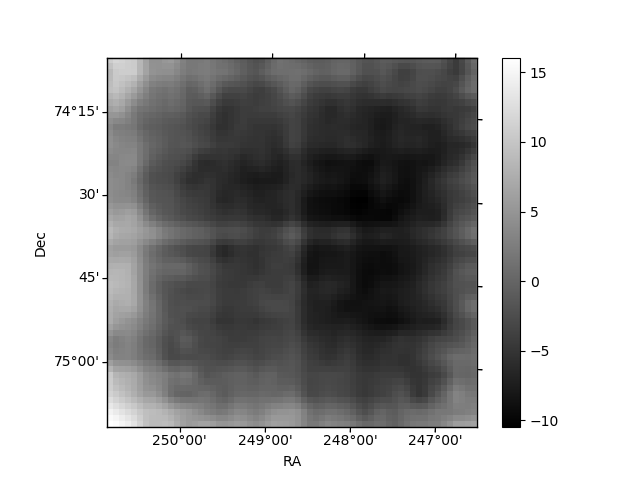
| Quadrant D | 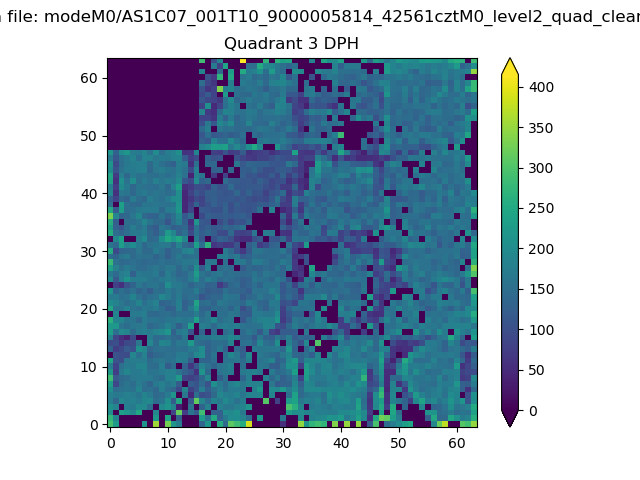 |
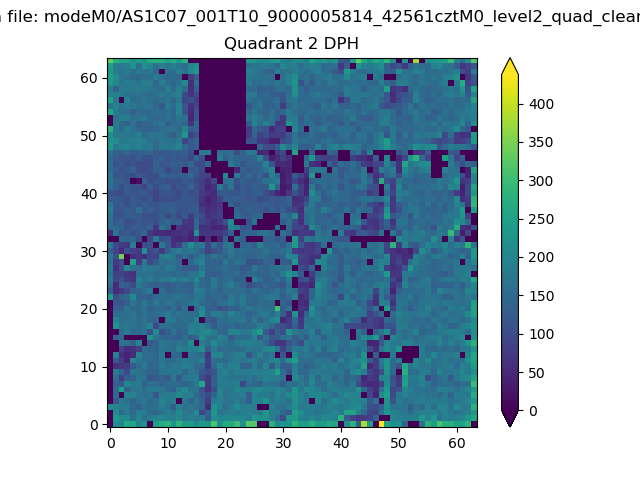 |
Quadrant C |
| Plot type | Count rate plots | Images |
|---|---|---|
| Comparison with Poisson distribution Blue bars denote a histogram of data divided into 1 sec bins. Red curve is a Poisson curve with rate = median count rate of data. |
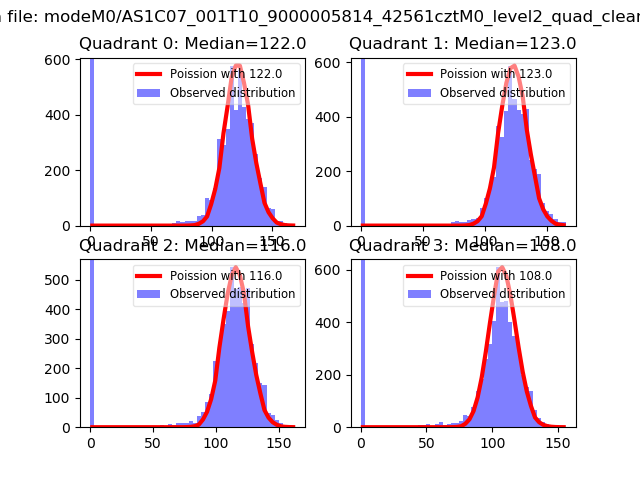 |
 |
| Quadrant-wise count rates Data is divided into 100 sec bins |
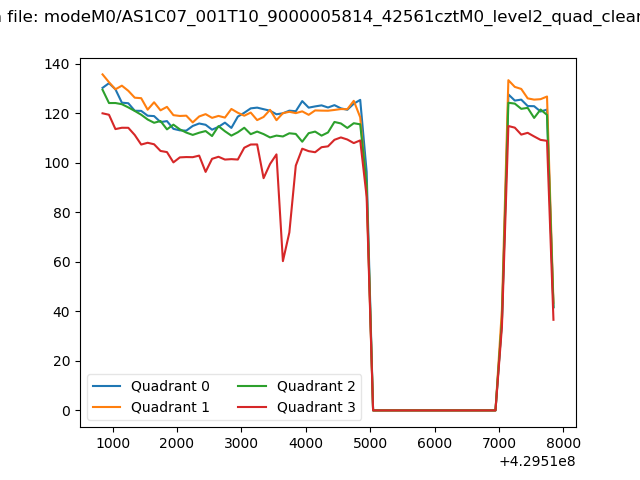 |
|
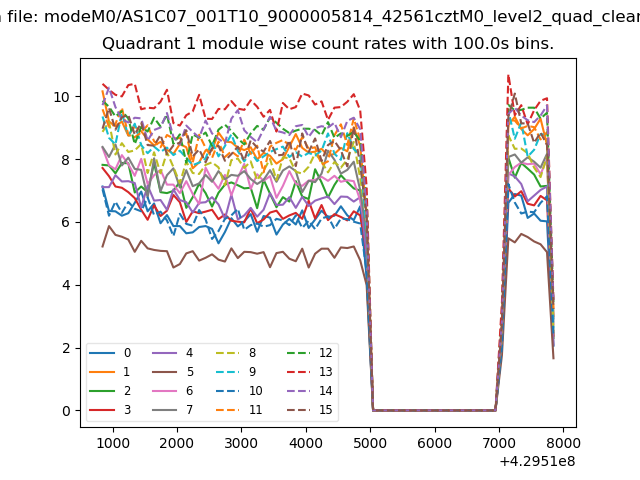
| Module-wise count rates for Quadrant A Data is divided into 100 sec bins |
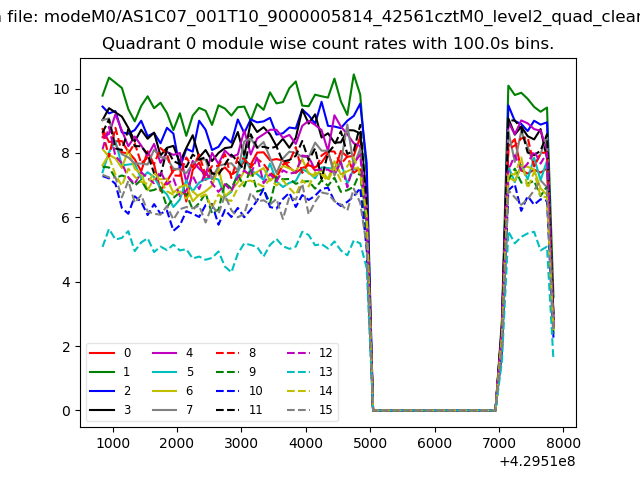 |
 |
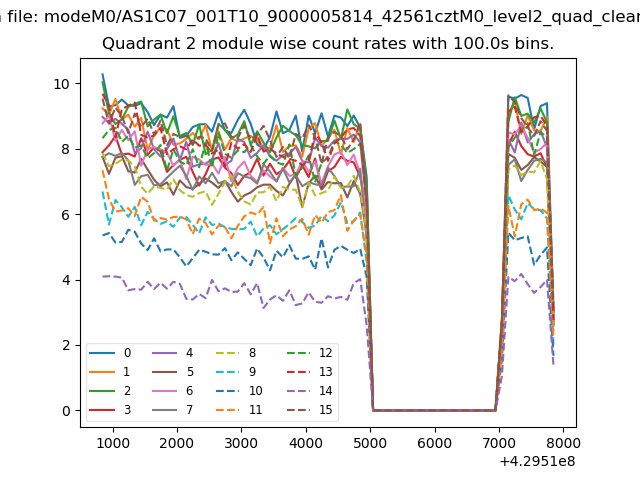
| Module-wise count rates for Quadrant B Data is divided into 100 sec bins |
 |
 |
| Module-wise count rates for Quadrant C Data is divided into 100 sec bins |
 |
 |
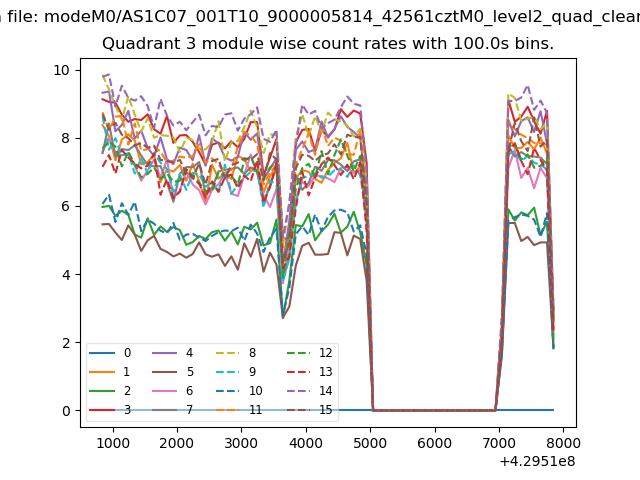
| Module-wise count rates for Quadrant D Data is divided into 100 sec bins |
 |
 |
| Parameter | Plot |
|---|---|
| CZT HV Monitor | 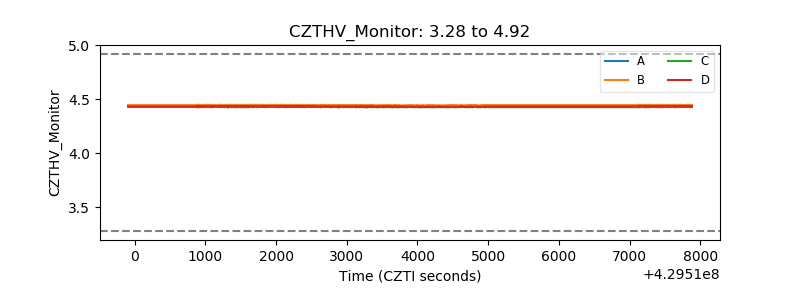 |
| D_VDD | 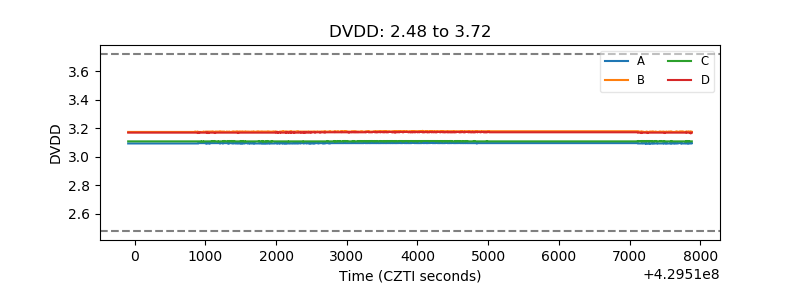 |
| Temperature 1 | 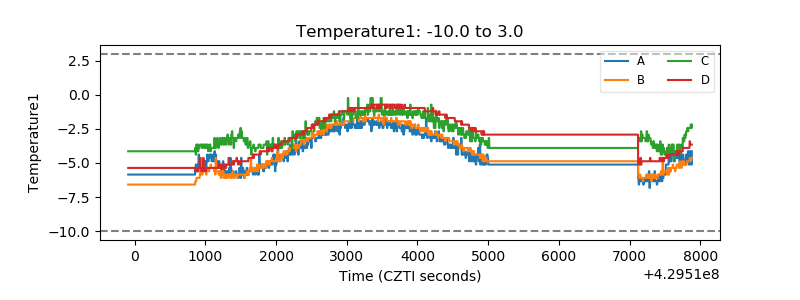 |
| Veto HV Monitor | 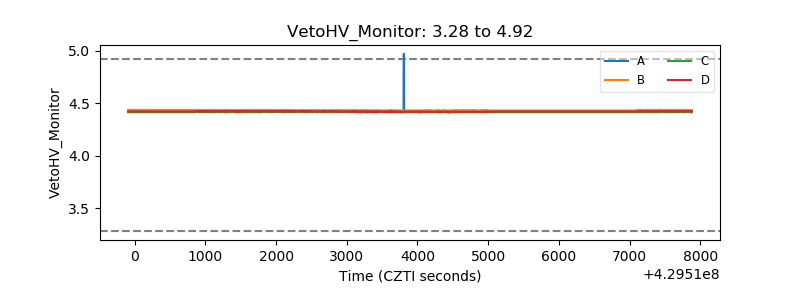 |
| Veto LLD | 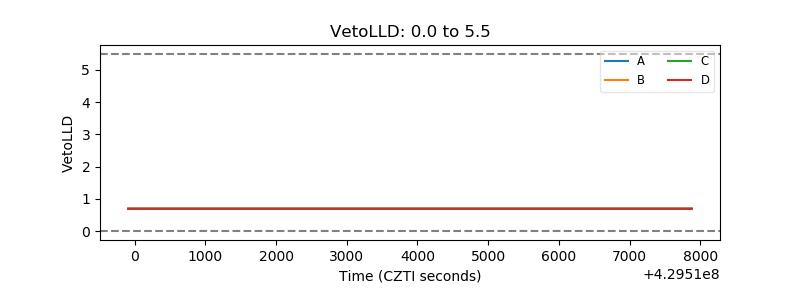 |
| Alpha Counter | 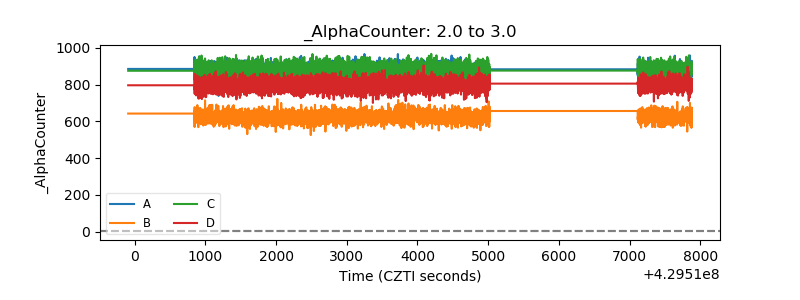 |
| _CPM_Rate | 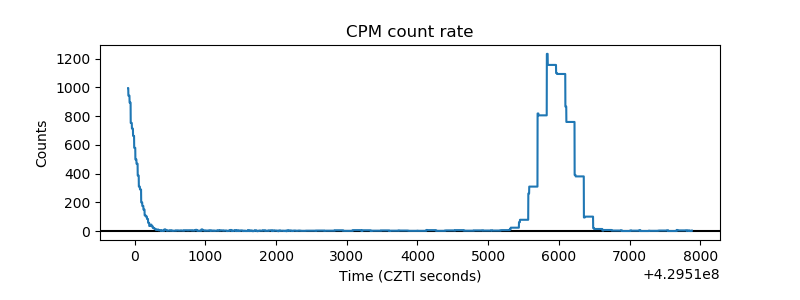 |
| CZT Counter | 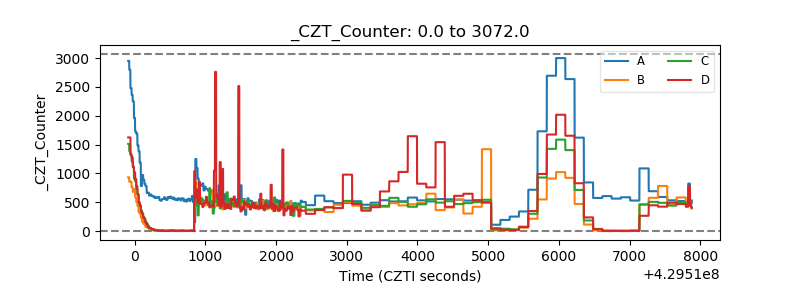 |
| +2.5 Volts monitor | 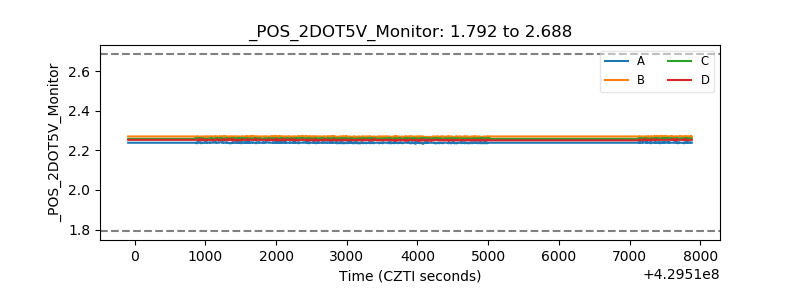 |
| +5 Volts monitor | 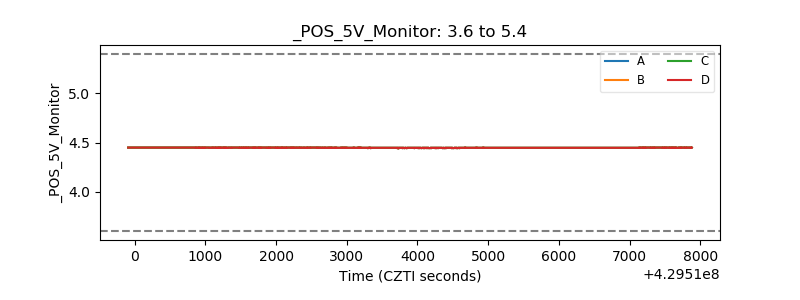 |
| _ROLL_ROT | 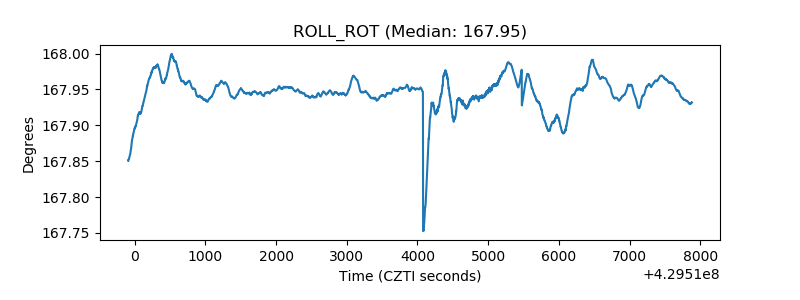 |
| _Roll_DEC | 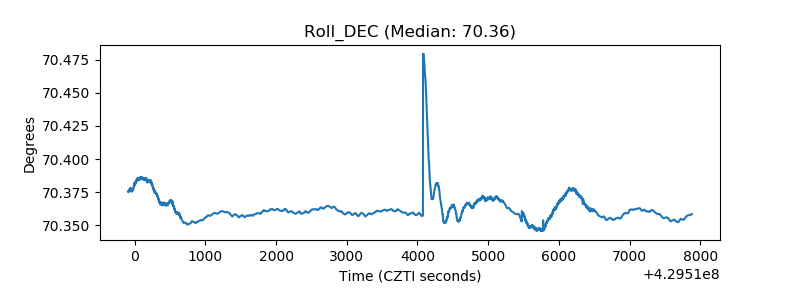 |
| _Roll_RA | 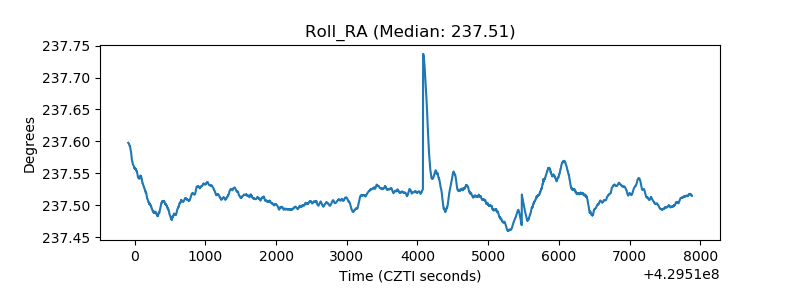 |
| Veto Counter | 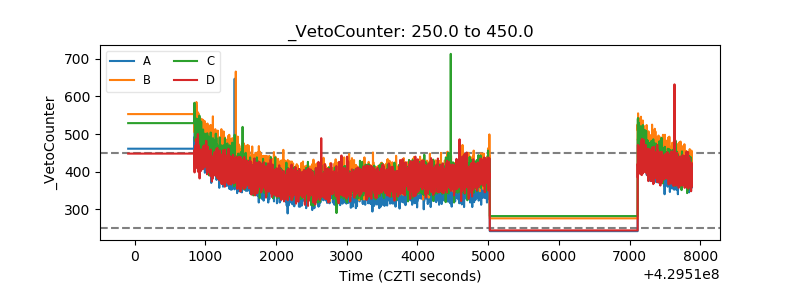 |