| Param | Original file | Final file |
|---|---|---|
| Filename | modeM0/AS1C07_001T10_9000005814_42562cztM0_level2.fits | modeM0/AS1C07_001T10_9000005814_42562cztM0_level2_quad_clean.evt |
| Size (bytes) | 273,879,360 | 84,885,120 |
| Size | 261.2 MB | 81.0 MB |
| Events in quadrant A | 2,749,669 | 577,676 |
| Events in quadrant B | 2,199,492 | 586,885 |
| Events in quadrant C | 2,264,337 | 551,569 |
| Events in quadrant D | 2,546,793 | 514,908 |
| Mode M0 | |||
|---|---|---|---|
| Quadrant | BADHDUFLAG | Total packets | Discarded packets |
| A | 0 | 10920 | 2 |
| B | 0 | 9892 | 2 |
| C | 0 | 9763 | 2 |
| D | 0 | 10918 | 4 |
| Mode M9 | |||
|---|---|---|---|
| Quadrant | BADHDUFLAG | Total packets | Discarded packets |
| A | 0 | 22 | 0 |
| B | 0 | 23 | 0 |
| C | 0 | 23 | 0 |
| D | 0 | 23 | 0 |
| Mode SS | |||
|---|---|---|---|
| Quadrant | BADHDUFLAG | Total packets | Discarded packets |
| A | 0 | 98 | 0 |
| B | 0 | 98 | 0 |
| C | 0 | 98 | 0 |
| D | 0 | 98 | 0 |
| Quadrant | Total seconds | Saturated seconds | Saturation percentage |
|---|---|---|---|
| A | 4839 | 13 | 0.268651% |
| B | 4839 | 14 | 0.289316% |
| C | 4839 | 3 | 0.061996% |
| D | 4838 | 32 | 0.661430% |
Noise dominated data is calculated using 1-second bins in cleaned event files. If a bin has >2000 counts, and if more than 50% of those come from <1% of pixels, then it is considered to be noise-dominated and hence unusable.
| Quadrant | # 1 sec bins | Bins with >0 counts | Bins with >2000 counts | High rate bins dominated by noise | Noise dominated (total time) | Noise dominated (detector-on time) | Marked lightcurve |
|---|---|---|---|---|---|---|---|
| A | 6992 | 4840 | 12 | 12 | 0.17% | 0.25% | 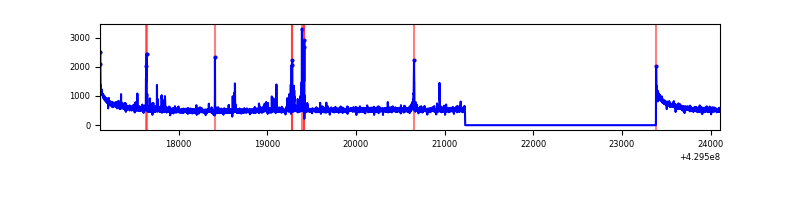 |
| B | 6992 | 4840 | 8 | 8 | 0.11% | 0.17% | 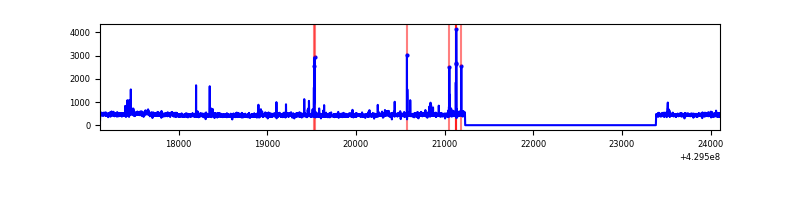 |
| C | 6992 | 4840 | 0 | 0 | 0.00% | 0.00% | 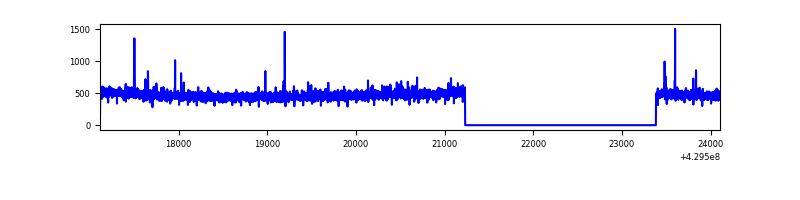 |
| D | 6991 | 4839 | 23 | 23 | 0.33% | 0.48% | 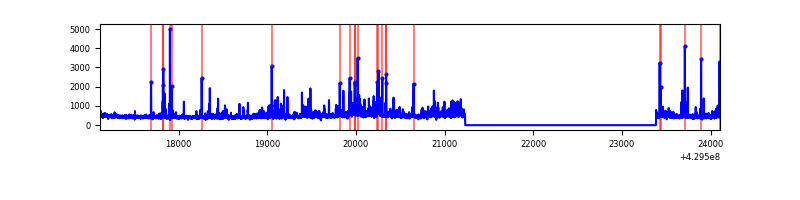 |
Top three noisy pixels from each quadrant. If the there are fewer than three noisy pixels in the level2.evt file, extra rows are filled as -1
| Pixel properties | Quadrant properties | ||||||
|---|---|---|---|---|---|---|---|
| Quadrant | DetID | PixID | Counts | Sigma | Mean | Median | Sigma |
| A | 10 | 83 | 538069 | 4860.92 | 544 | 533 | 110.6 |
| A | 15 | 223 | 56208 | 503.47 | 544 | 533 | 110.6 |
| A | 7 | 3 | 30087 | 267.26 | 544 | 533 | 110.6 |
| B | 5 | 172 | 53468 | 518.59 | 535 | 520 | 102.1 |
| B | 5 | 255 | 27943 | 268.59 | 535 | 520 | 102.1 |
| B | 12 | 111 | 12203 | 114.43 | 535 | 520 | 102.1 |
| C | 15 | 214 | 206005 | 1716.37 | 519 | 522 | 119.7 |
| C | 14 | 254 | 14679 | 118.25 | 519 | 522 | 119.7 |
| C | 12 | 249 | 8343 | 65.33 | 519 | 522 | 119.7 |
| D | 1 | 52 | 254545 | 1998.43 | 525 | 510 | 127.1 |
| D | 1 | 47 | 78577 | 614.13 | 525 | 510 | 127.1 |
| D | 5 | 171 | 53289 | 415.2 | 525 | 510 | 127.1 |
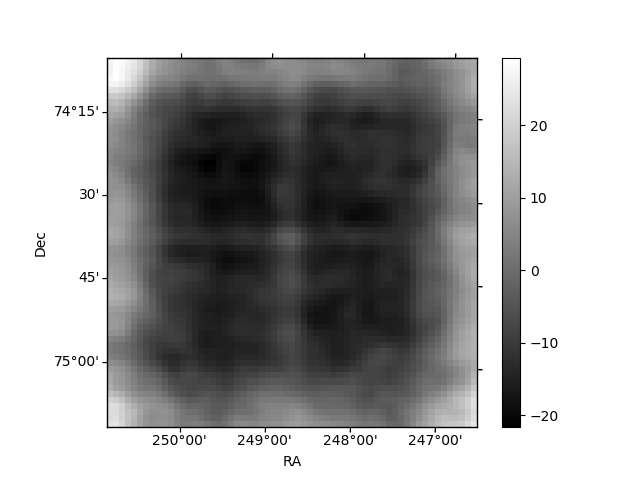
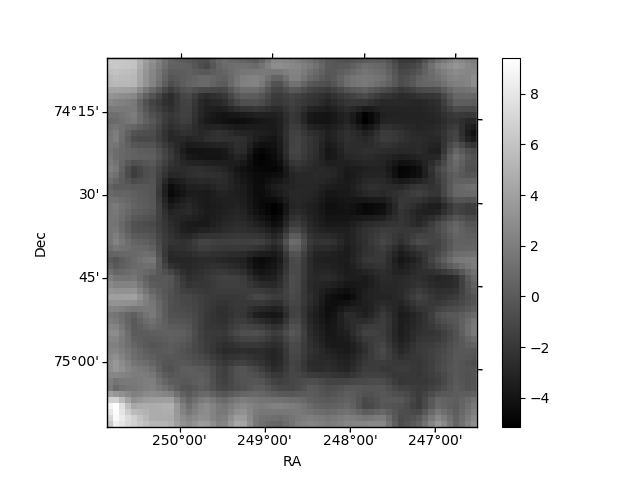
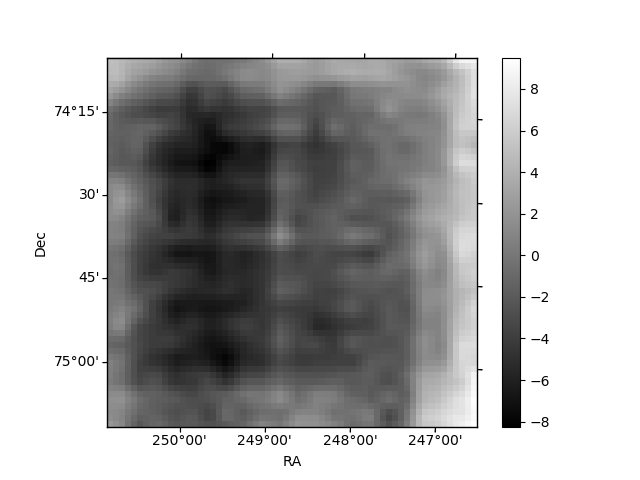
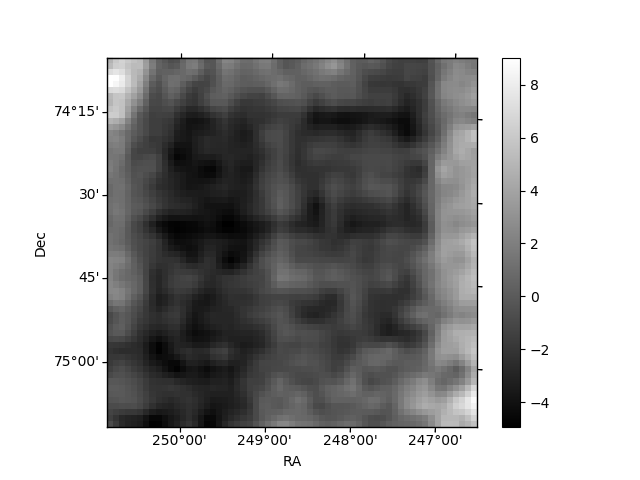
Histogram calculated using DETX and DETY for each event in the final _common_clean file
| Quadrant A | 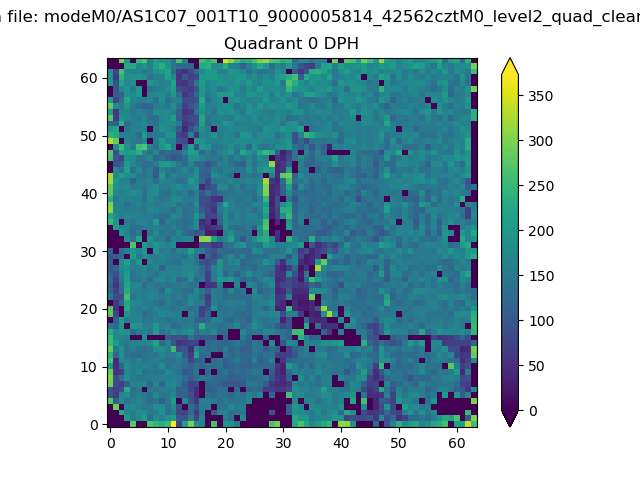 |
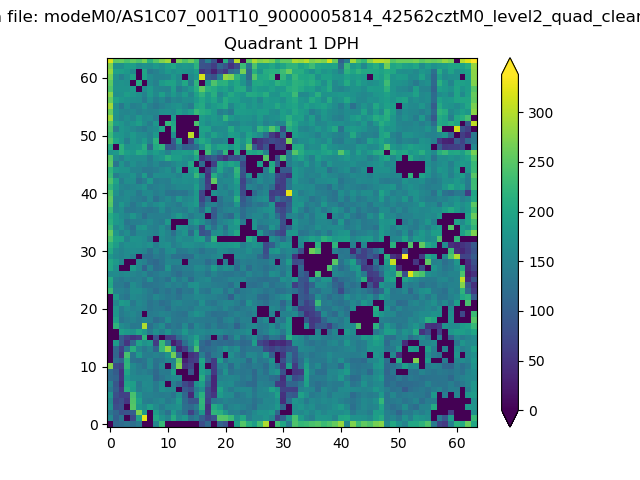 |
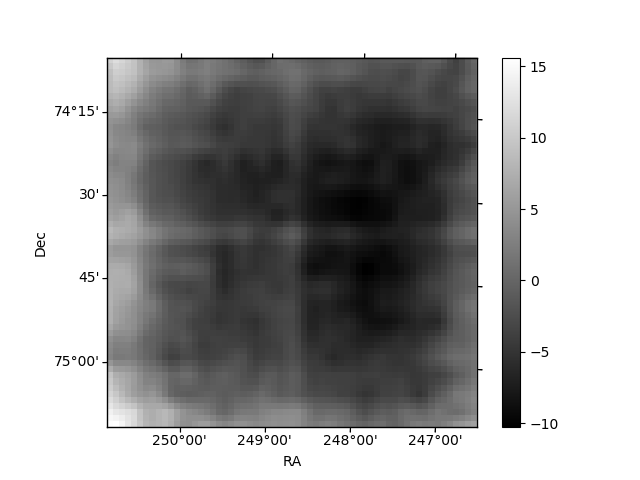
Quadrant B |
|---|---|---|---|
| Quadrant D | 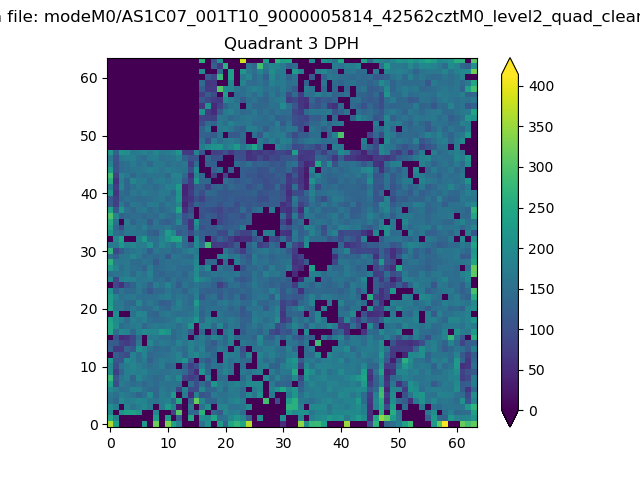 |
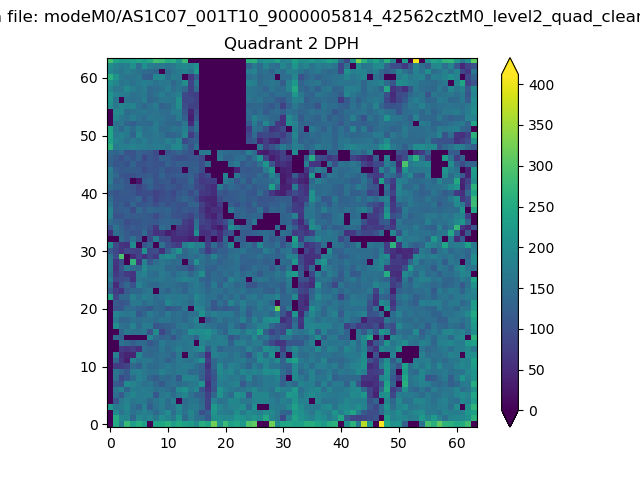 |
Quadrant C |
| Plot type | Count rate plots | Images |
|---|---|---|
| Comparison with Poisson distribution Blue bars denote a histogram of data divided into 1 sec bins. Red curve is a Poisson curve with rate = median count rate of data. |
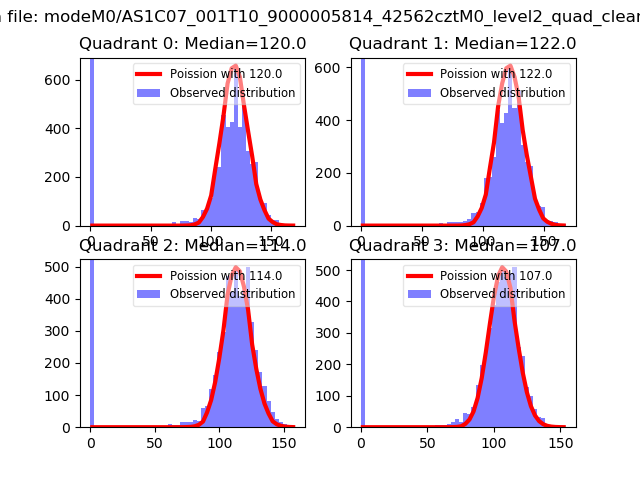 |
 |
| Quadrant-wise count rates Data is divided into 100 sec bins |
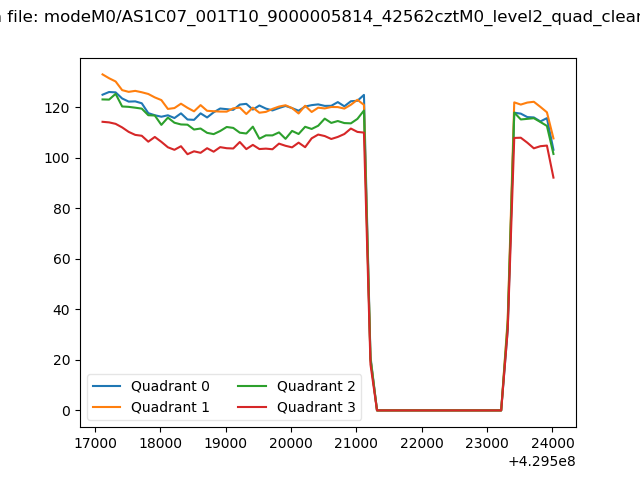 |
|
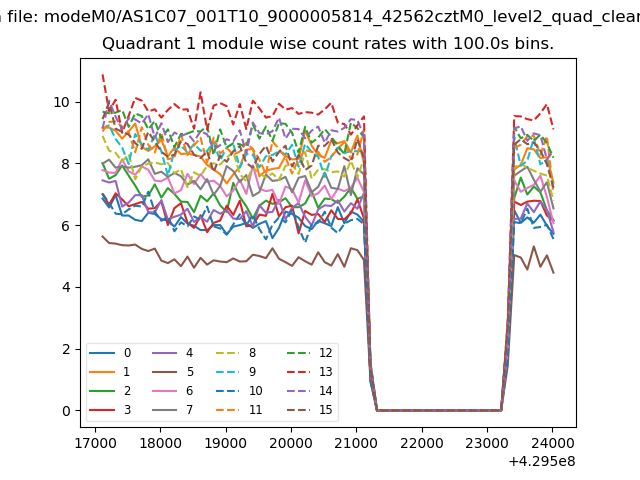
| Module-wise count rates for Quadrant A Data is divided into 100 sec bins |
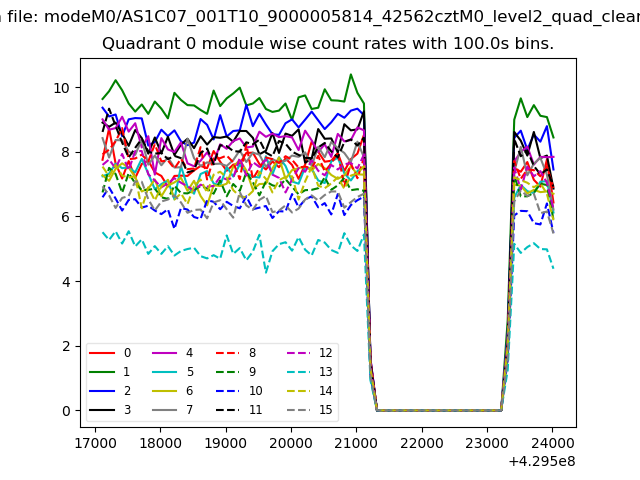 |
 |
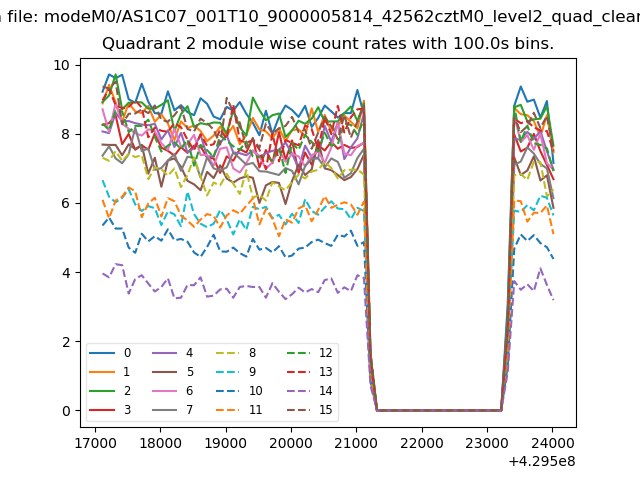
| Module-wise count rates for Quadrant B Data is divided into 100 sec bins |
 |
 |
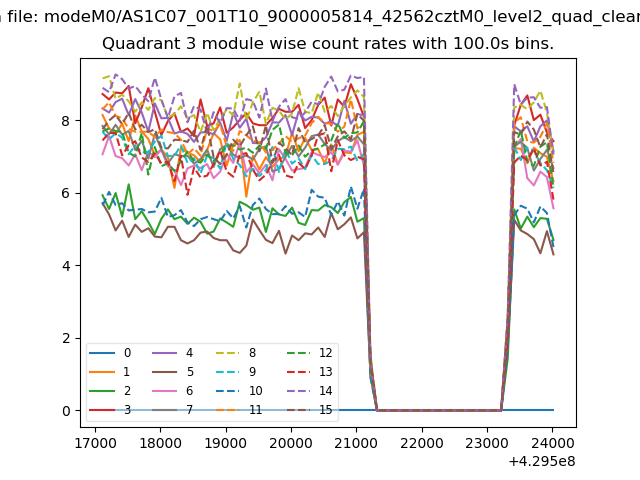
| Module-wise count rates for Quadrant C Data is divided into 100 sec bins |
 |
 |
| Module-wise count rates for Quadrant D Data is divided into 100 sec bins |
 |
 |
| Parameter | Plot |
|---|---|
| CZT HV Monitor | 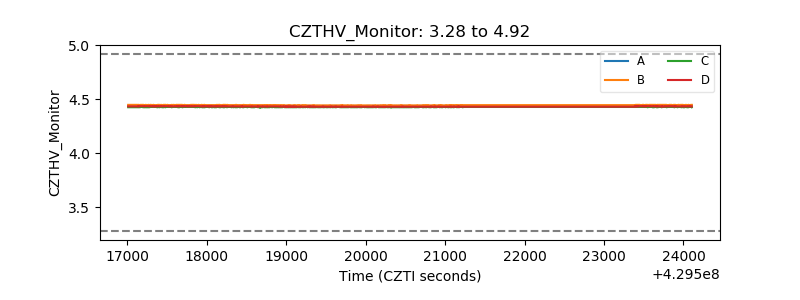 |
| D_VDD | 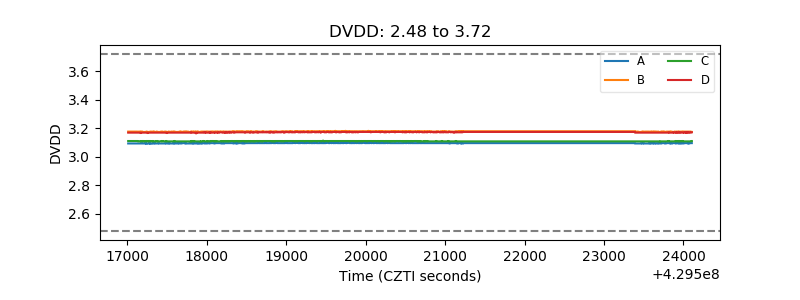 |
| Temperature 1 | 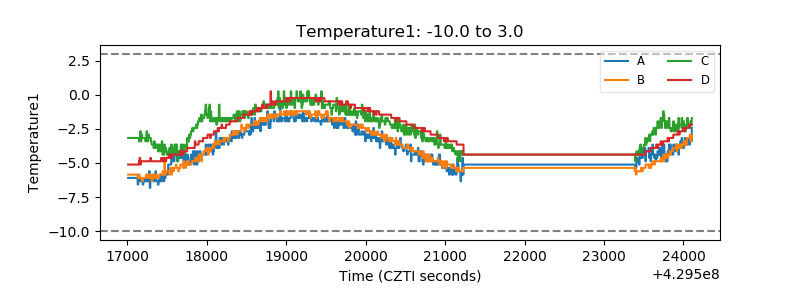 |
| Veto HV Monitor |  |
| Veto LLD | 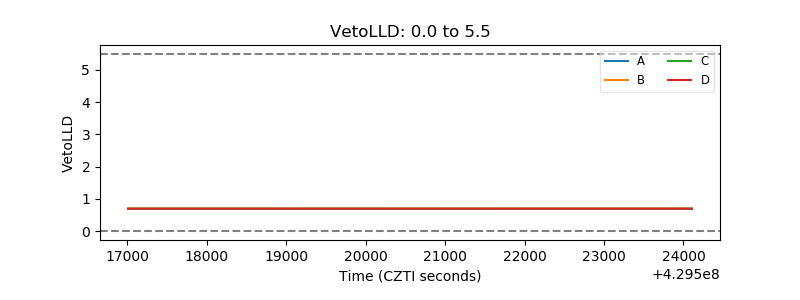 |
| Alpha Counter | 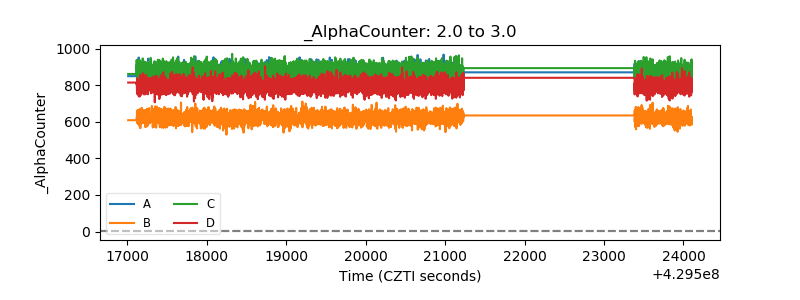 |
| _CPM_Rate | 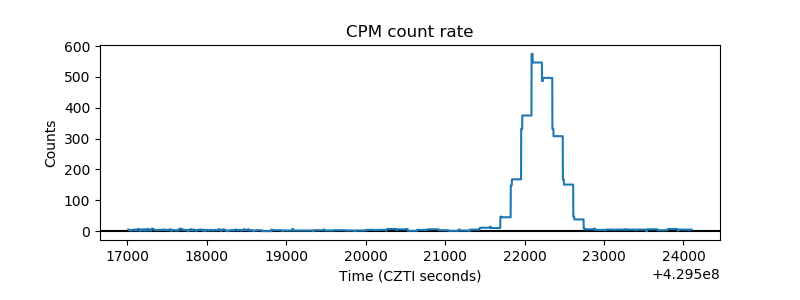 |
| CZT Counter | 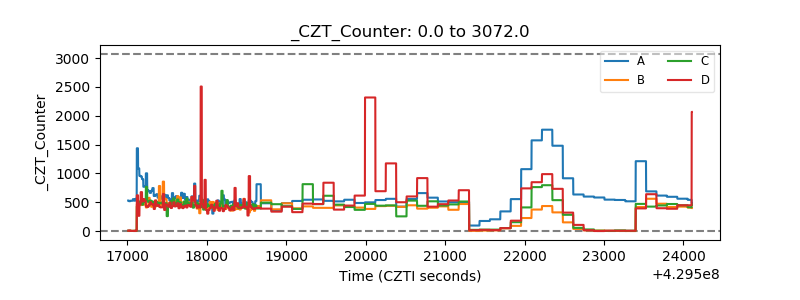 |
| +2.5 Volts monitor | 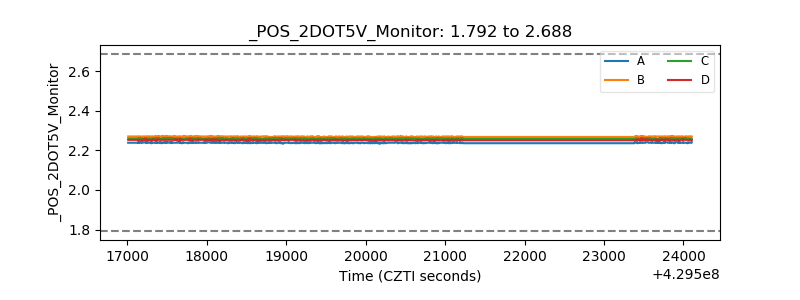 |
| +5 Volts monitor | 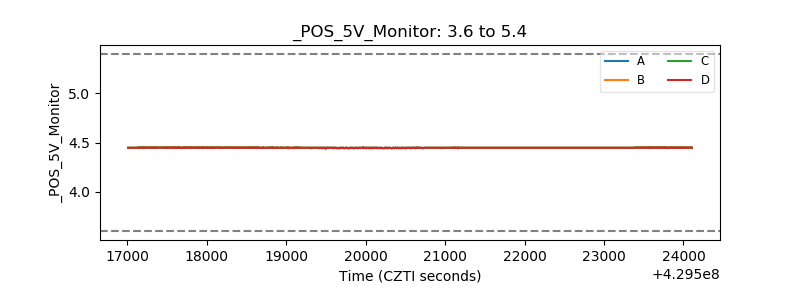 |
| _ROLL_ROT | 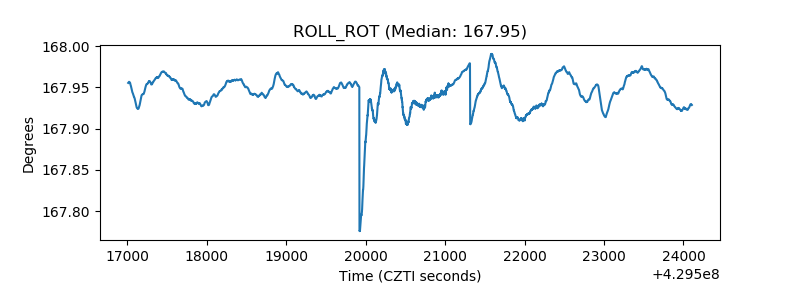 |
| _Roll_DEC | 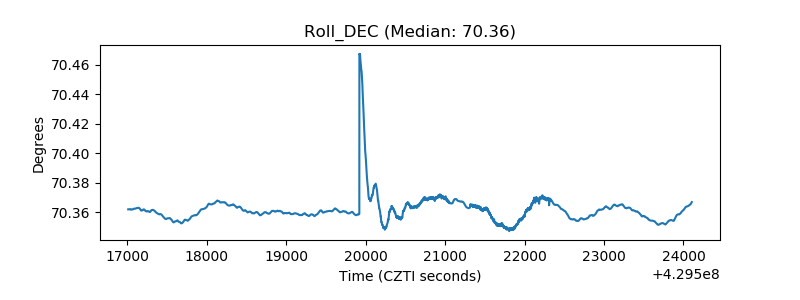 |
| _Roll_RA | 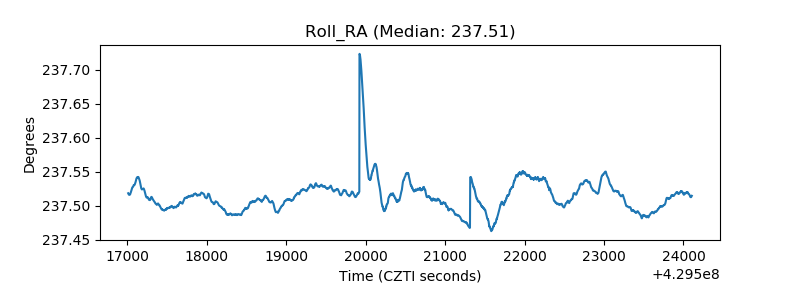 |
| Veto Counter | 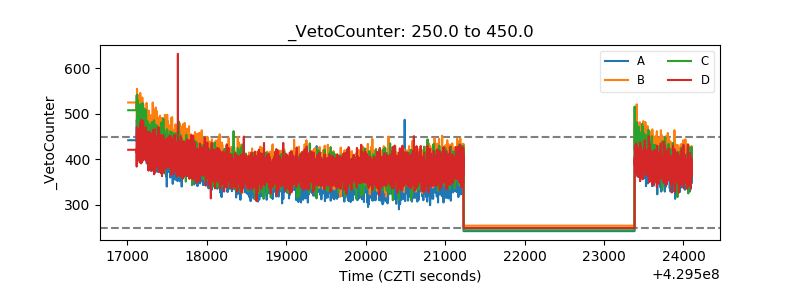 |