| Param | Original file | Final file |
|---|---|---|
| Filename | modeM0/AS1C07_001T10_9000005814_42563cztM0_level2.fits | modeM0/AS1C07_001T10_9000005814_42563cztM0_level2_quad_clean.evt |
| Size (bytes) | 291,697,920 | 83,445,120 |
| Size | 278.2 MB | 79.6 MB |
| Events in quadrant A | 2,688,732 | 569,002 |
| Events in quadrant B | 2,420,487 | 566,495 |
| Events in quadrant C | 2,271,302 | 544,046 |
| Events in quadrant D | 3,032,311 | 500,837 |
| Mode M0 | |||
|---|---|---|---|
| Quadrant | BADHDUFLAG | Total packets | Discarded packets |
| A | 0 | 10794 | 2 |
| B | 0 | 10779 | 2 |
| C | 0 | 9961 | 2 |
| D | 0 | 12424 | 2 |
| Mode M9 | |||
|---|---|---|---|
| Quadrant | BADHDUFLAG | Total packets | Discarded packets |
| A | 0 | 23 | 0 |
| B | 0 | 24 | 0 |
| C | 0 | 24 | 0 |
| D | 0 | 24 | 0 |
| Mode SS | |||
|---|---|---|---|
| Quadrant | BADHDUFLAG | Total packets | Discarded packets |
| A | 0 | 102 | 0 |
| B | 0 | 102 | 0 |
| C | 0 | 102 | 0 |
| D | 0 | 102 | 0 |
| Quadrant | Total seconds | Saturated seconds | Saturation percentage |
|---|---|---|---|
| A | 4934 | 11 | 0.222943% |
| B | 4934 | 77 | 1.560600% |
| C | 4934 | 4 | 0.081070% |
| D | 4934 | 110 | 2.229428% |
Noise dominated data is calculated using 1-second bins in cleaned event files. If a bin has >2000 counts, and if more than 50% of those come from <1% of pixels, then it is considered to be noise-dominated and hence unusable.
| Quadrant | # 1 sec bins | Bins with >0 counts | Bins with >2000 counts | High rate bins dominated by noise | Noise dominated (total time) | Noise dominated (detector-on time) | Marked lightcurve |
|---|---|---|---|---|---|---|---|
| A | 7027 | 4935 | 2 | 2 | 0.03% | 0.04% | 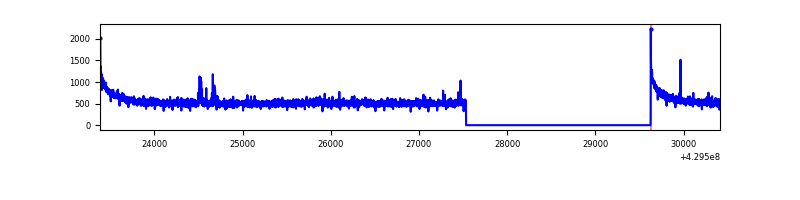 |
| B | 7027 | 4935 | 61 | 61 | 0.87% | 1.24% | 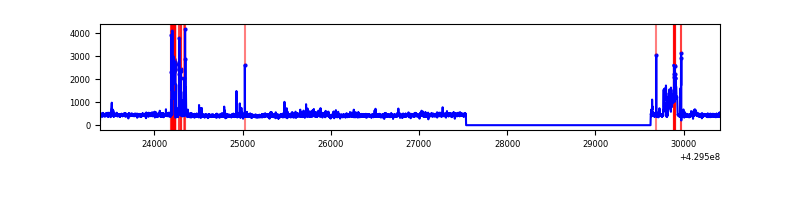 |
| C | 7027 | 4935 | 0 | 0 | 0.00% | 0.00% | 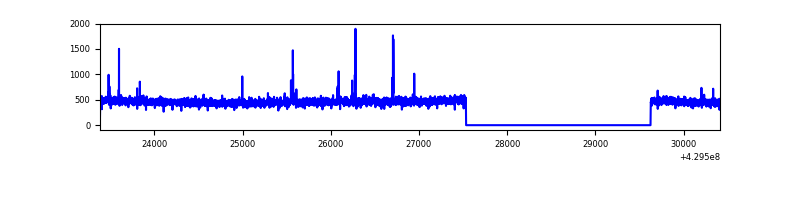 |
| D | 7027 | 4935 | 104 | 104 | 1.48% | 2.11% | 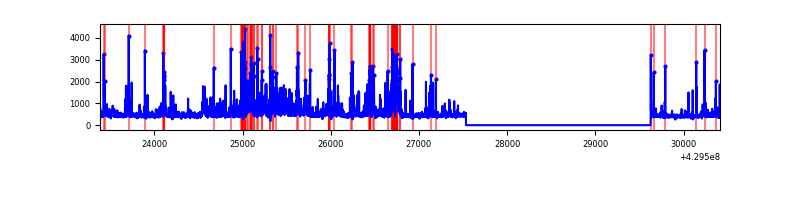 |
Top three noisy pixels from each quadrant. If the there are fewer than three noisy pixels in the level2.evt file, extra rows are filled as -1
| Pixel properties | Quadrant properties | ||||||
|---|---|---|---|---|---|---|---|
| Quadrant | DetID | PixID | Counts | Sigma | Mean | Median | Sigma |
| A | 10 | 83 | 554746 | 5045.52 | 541 | 531 | 109.8 |
| A | 13 | 248 | 21683 | 192.57 | 541 | 531 | 109.8 |
| A | 2 | 79 | 10286 | 88.81 | 541 | 531 | 109.8 |
| B | 5 | 172 | 189076 | 1867.64 | 526 | 512 | 101.0 |
| B | 5 | 255 | 129824 | 1280.78 | 526 | 512 | 101.0 |
| B | 0 | 245 | 33704 | 328.75 | 526 | 512 | 101.0 |
| C | 15 | 214 | 211404 | 1767.87 | 518 | 521 | 119.3 |
| C | 14 | 254 | 30081 | 247.81 | 518 | 521 | 119.3 |
| C | 9 | 54 | 5935 | 45.39 | 518 | 521 | 119.3 |
| D | 1 | 52 | 489790 | 3852.77 | 522 | 507 | 127.0 |
| D | 10 | 199 | 115384 | 904.58 | 522 | 507 | 127.0 |
| D | 1 | 47 | 83440 | 653.04 | 522 | 507 | 127.0 |
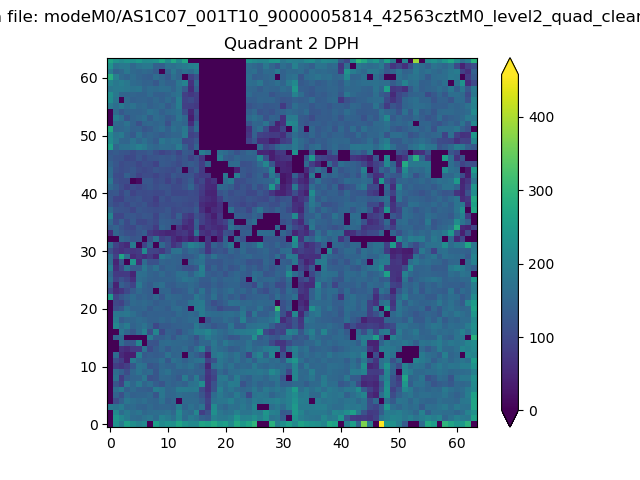
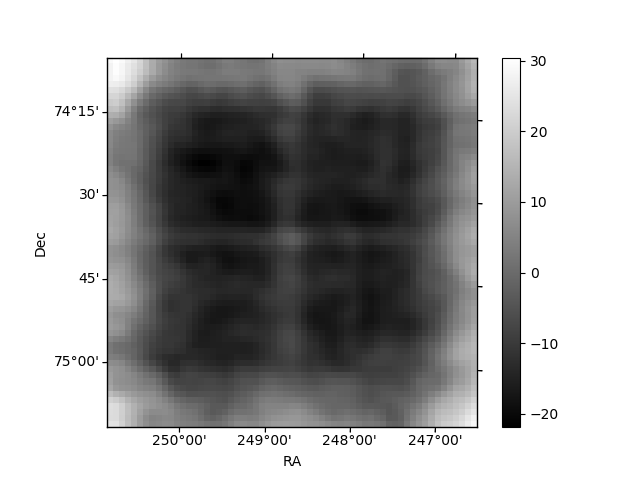
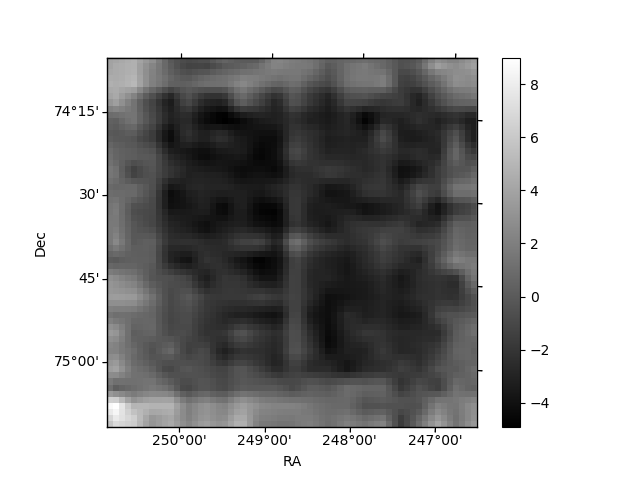
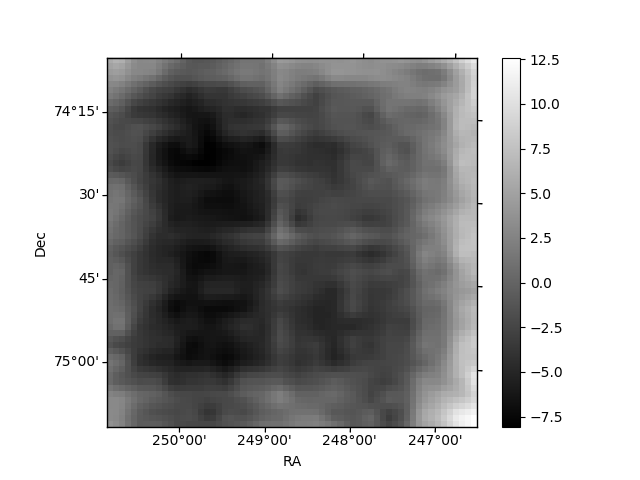
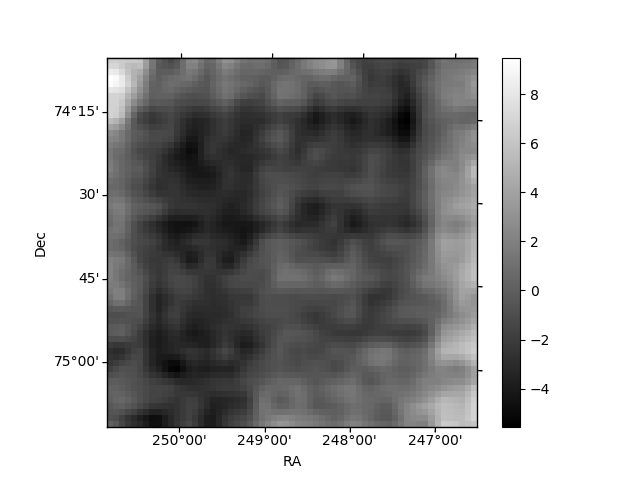
Histogram calculated using DETX and DETY for each event in the final _common_clean file
| Quadrant A | 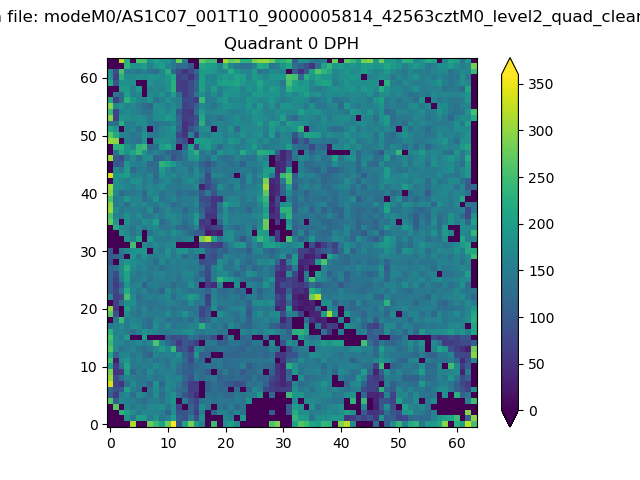 |
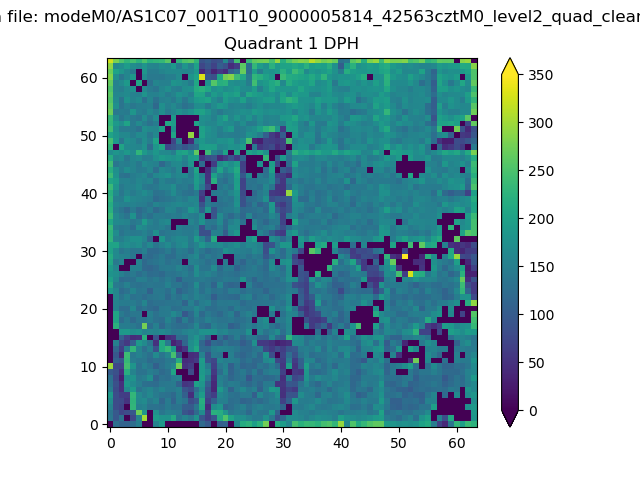 |
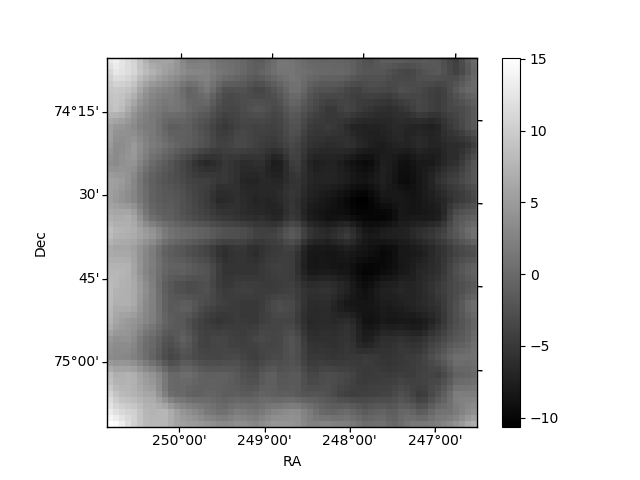
Quadrant B |
|---|---|---|---|
| Quadrant D | 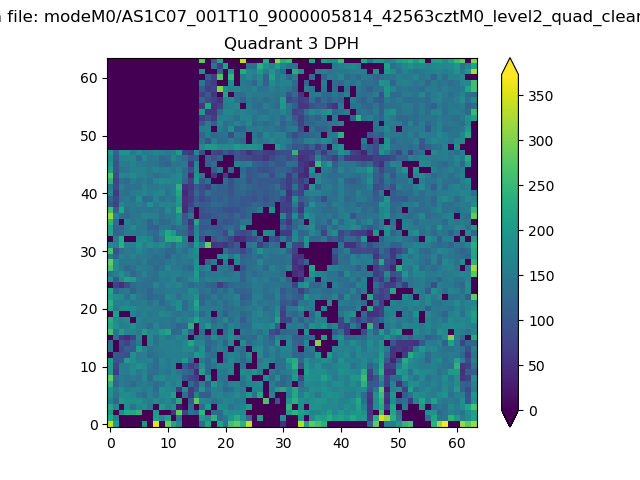 |
 |
Quadrant C |
| Plot type | Count rate plots | Images |
|---|---|---|
| Comparison with Poisson distribution Blue bars denote a histogram of data divided into 1 sec bins. Red curve is a Poisson curve with rate = median count rate of data. |
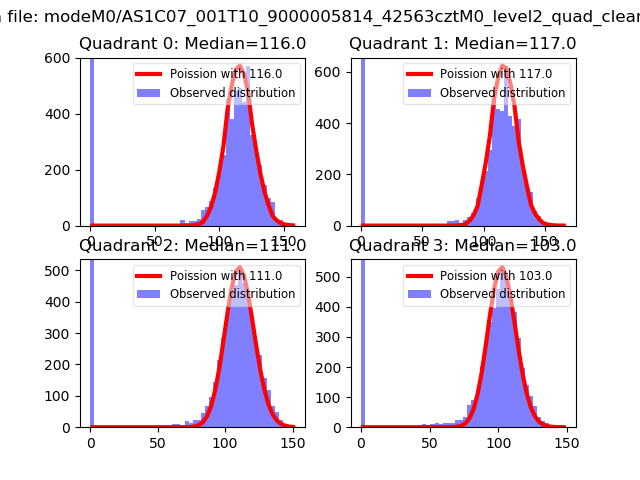 |
 |
| Quadrant-wise count rates Data is divided into 100 sec bins |
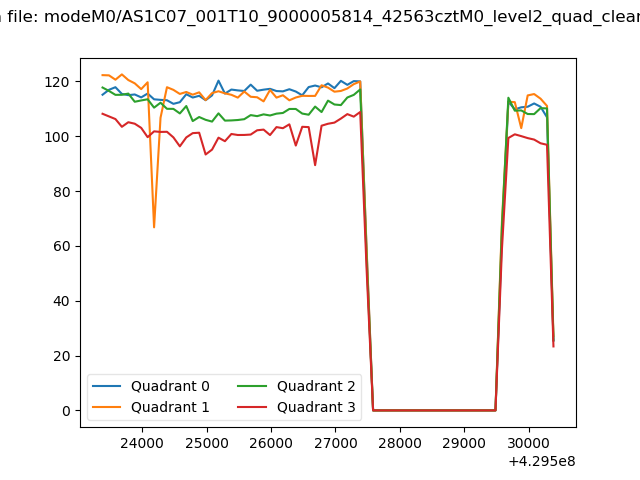 |
|
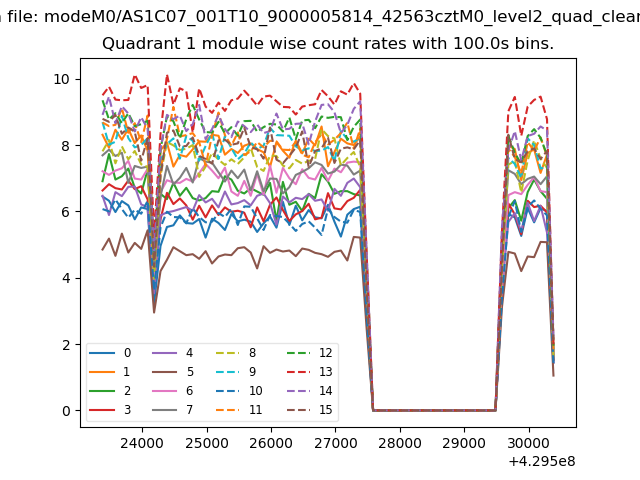
| Module-wise count rates for Quadrant A Data is divided into 100 sec bins |
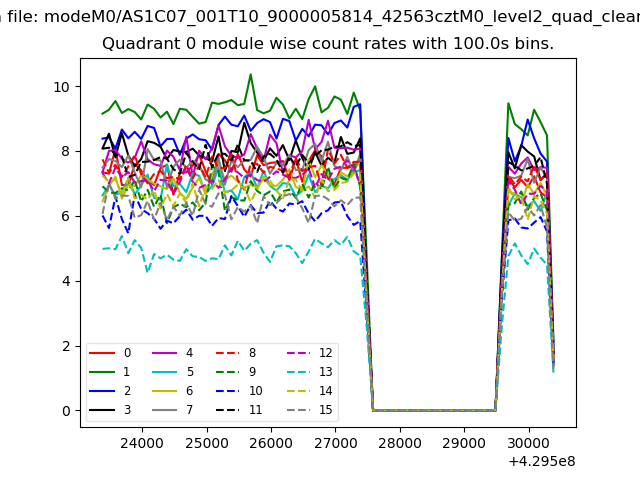 |
 |
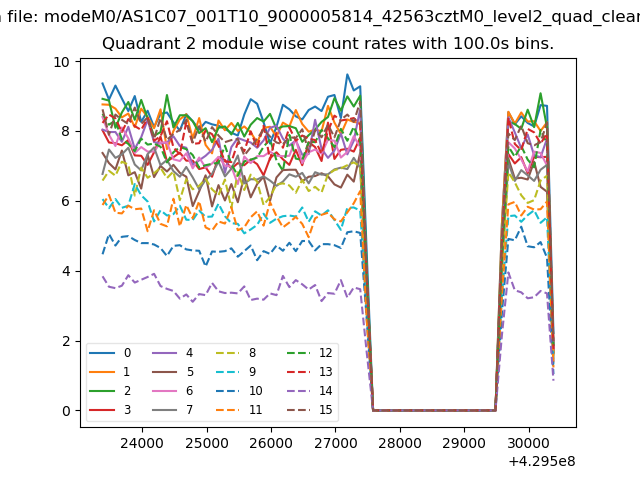
| Module-wise count rates for Quadrant B Data is divided into 100 sec bins |
 |
 |
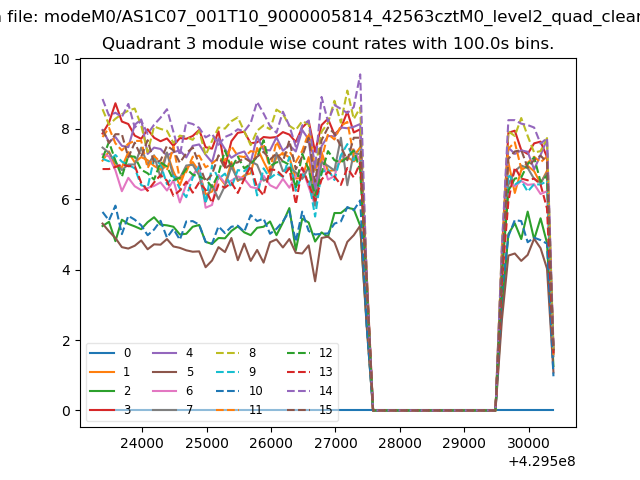
| Module-wise count rates for Quadrant C Data is divided into 100 sec bins |
 |
 |
| Module-wise count rates for Quadrant D Data is divided into 100 sec bins |
 |
 |
| Parameter | Plot |
|---|---|
| CZT HV Monitor | 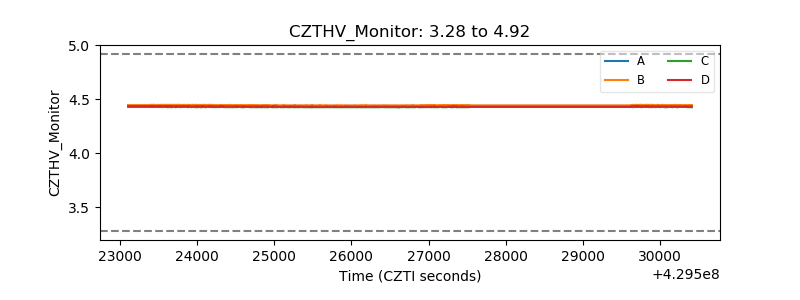 |
| D_VDD | 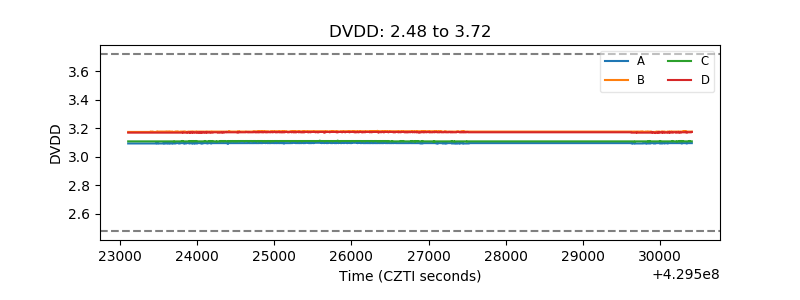 |
| Temperature 1 | 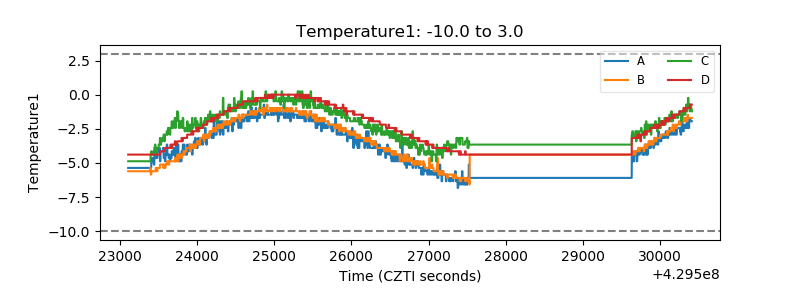 |
| Veto HV Monitor | 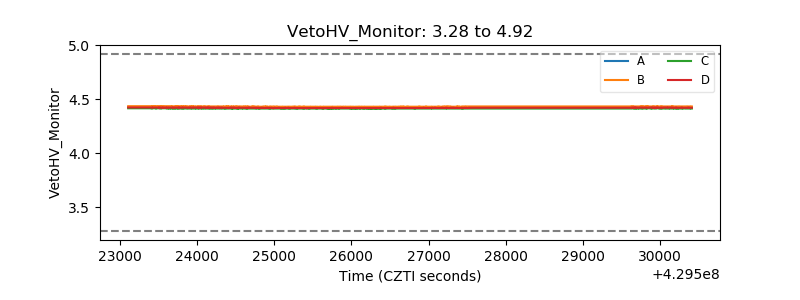 |
| Veto LLD | 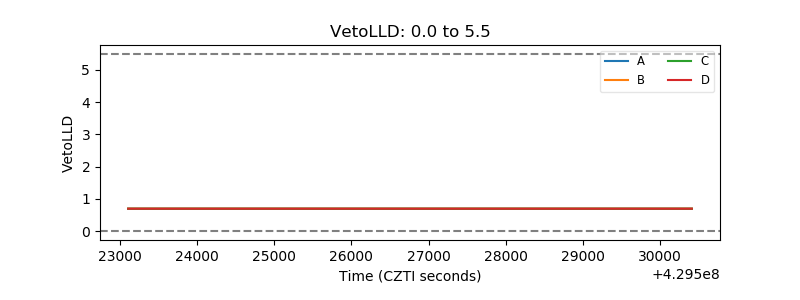 |
| Alpha Counter | 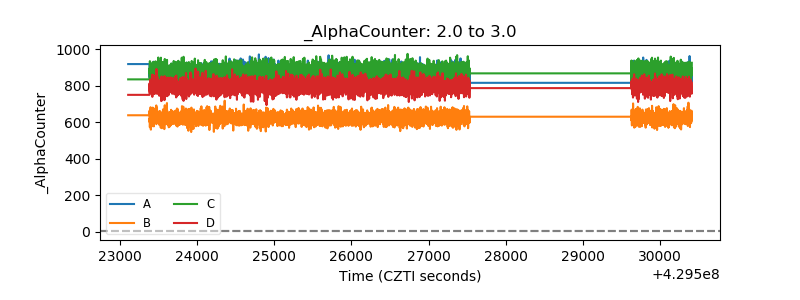 |
| _CPM_Rate |  |
| CZT Counter | 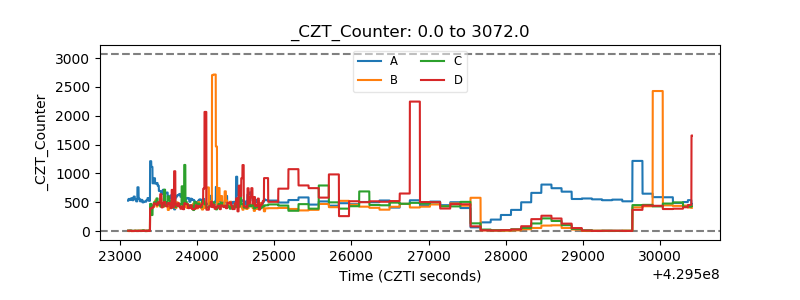 |
| +2.5 Volts monitor | 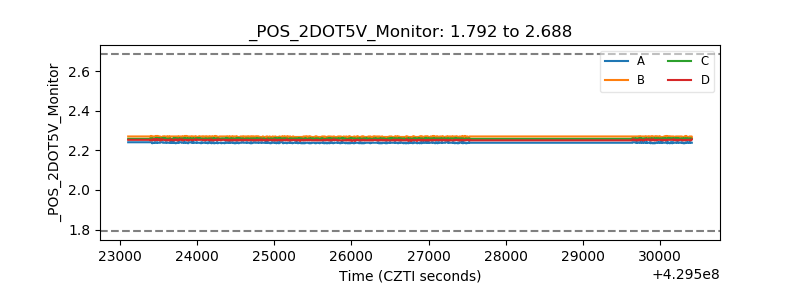 |
| +5 Volts monitor | 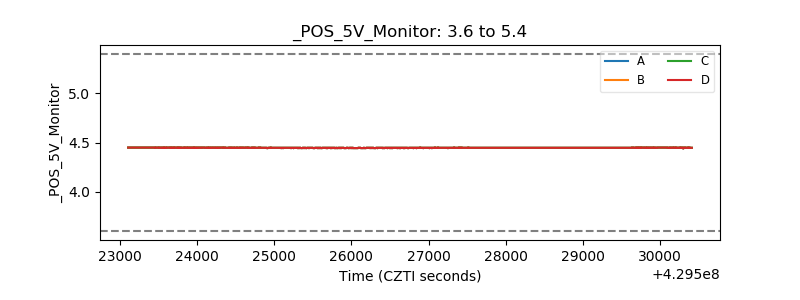 |
| _ROLL_ROT | 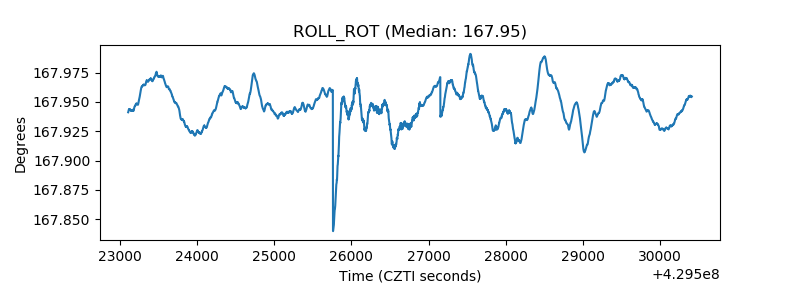 |
| _Roll_DEC | 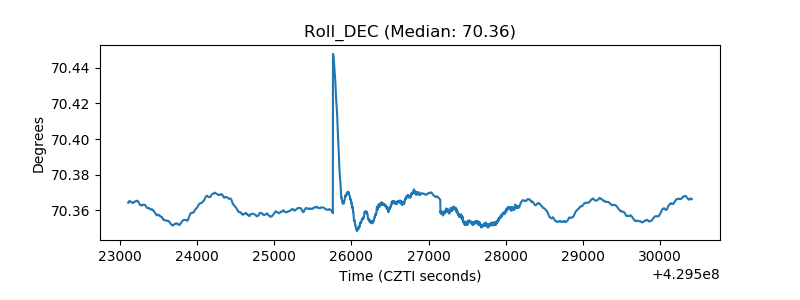 |
| _Roll_RA | 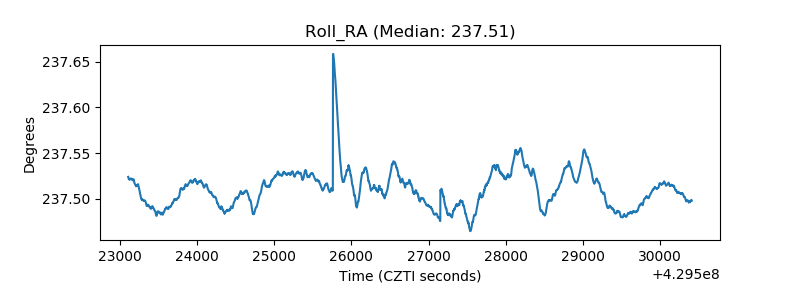 |
| Veto Counter | 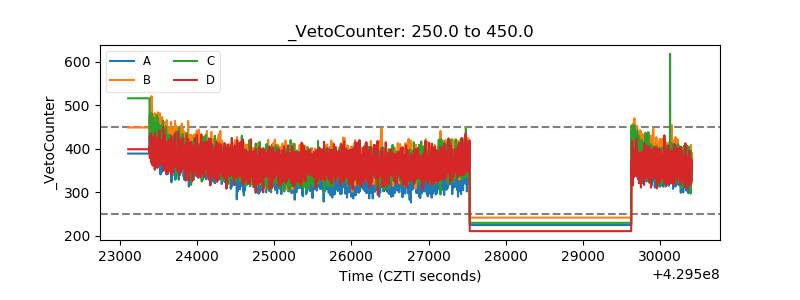 |