| Param | Original file | Final file |
|---|---|---|
| Filename | modeM0/AS1C07_001T10_9000005814_42564cztM0_level2.fits | modeM0/AS1C07_001T10_9000005814_42564cztM0_level2_quad_clean.evt |
| Size (bytes) | 294,471,360 | 85,504,320 |
| Size | 280.8 MB | 81.5 MB |
| Events in quadrant A | 2,874,077 | 579,481 |
| Events in quadrant B | 2,419,447 | 578,037 |
| Events in quadrant C | 2,352,854 | 553,638 |
| Events in quadrant D | 2,849,896 | 514,897 |
| Mode M0 | |||
|---|---|---|---|
| Quadrant | BADHDUFLAG | Total packets | Discarded packets |
| A | 0 | 11587 | 2 |
| B | 0 | 11023 | 3 |
| C | 0 | 10442 | 2 |
| D | 0 | 12110 | 2 |
| Mode M9 | |||
|---|---|---|---|
| Quadrant | BADHDUFLAG | Total packets | Discarded packets |
| A | 0 | 22 | 0 |
| B | 0 | 23 | 0 |
| C | 0 | 23 | 0 |
| D | 0 | 23 | 0 |
| Mode SS | |||
|---|---|---|---|
| Quadrant | BADHDUFLAG | Total packets | Discarded packets |
| A | 0 | 106 | 0 |
| B | 0 | 106 | 0 |
| C | 0 | 106 | 0 |
| D | 0 | 106 | 0 |
| Quadrant | Total seconds | Saturated seconds | Saturation percentage |
|---|---|---|---|
| A | 5181 | 17 | 0.328122% |
| B | 5180 | 36 | 0.694981% |
| C | 5180 | 4 | 0.077220% |
| D | 5180 | 61 | 1.177606% |
Noise dominated data is calculated using 1-second bins in cleaned event files. If a bin has >2000 counts, and if more than 50% of those come from <1% of pixels, then it is considered to be noise-dominated and hence unusable.
| Quadrant | # 1 sec bins | Bins with >0 counts | Bins with >2000 counts | High rate bins dominated by noise | Noise dominated (total time) | Noise dominated (detector-on time) | Marked lightcurve |
|---|---|---|---|---|---|---|---|
| A | 7093 | 5182 | 3 | 3 | 0.04% | 0.06% | 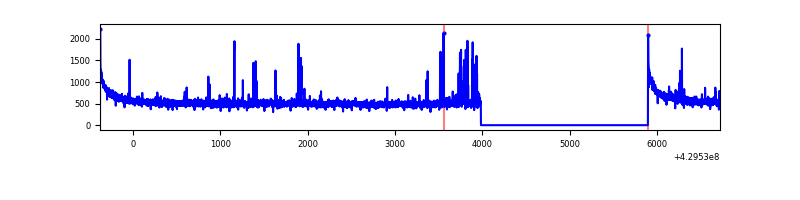 |
| B | 7092 | 5181 | 23 | 23 | 0.32% | 0.44% | 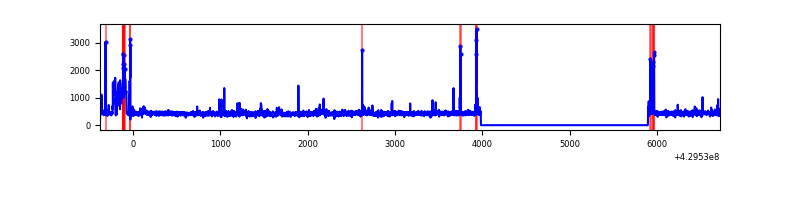 |
| C | 7092 | 5181 | 0 | 0 | 0.00% | 0.00% | 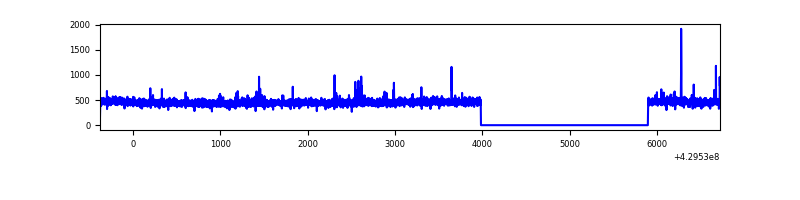 |
| D | 7092 | 5181 | 55 | 55 | 0.78% | 1.06% | 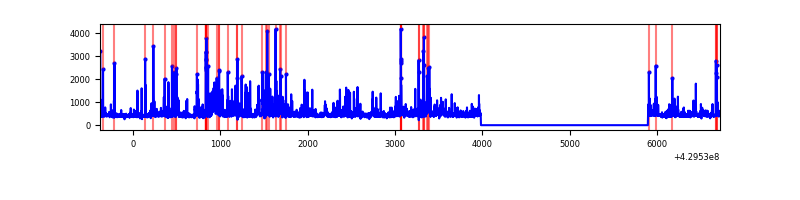 |
Top three noisy pixels from each quadrant. If the there are fewer than three noisy pixels in the level2.evt file, extra rows are filled as -1
| Pixel properties | Quadrant properties | ||||||
|---|---|---|---|---|---|---|---|
| Quadrant | DetID | PixID | Counts | Sigma | Mean | Median | Sigma |
| A | 10 | 83 | 583336 | 5105.97 | 557 | 546 | 114.1 |
| A | 2 | 79 | 98699 | 859.94 | 557 | 546 | 114.1 |
| A | 13 | 248 | 31747 | 273.36 | 557 | 546 | 114.1 |
| B | 5 | 172 | 169744 | 1620.11 | 545 | 529 | 104.4 |
| B | 5 | 255 | 47393 | 448.69 | 545 | 529 | 104.4 |
| B | 0 | 245 | 28792 | 270.6 | 545 | 529 | 104.4 |
| C | 15 | 214 | 221631 | 1779.17 | 537 | 539 | 124.3 |
| C | 7 | 220 | 14809 | 114.83 | 537 | 539 | 124.3 |
| C | 3 | 233 | 13587 | 105.0 | 537 | 539 | 124.3 |
| D | 1 | 52 | 221223 | 1662.0 | 542 | 525 | 132.8 |
| D | 12 | 218 | 167878 | 1260.27 | 542 | 525 | 132.8 |
| D | 1 | 47 | 92403 | 691.9 | 542 | 525 | 132.8 |
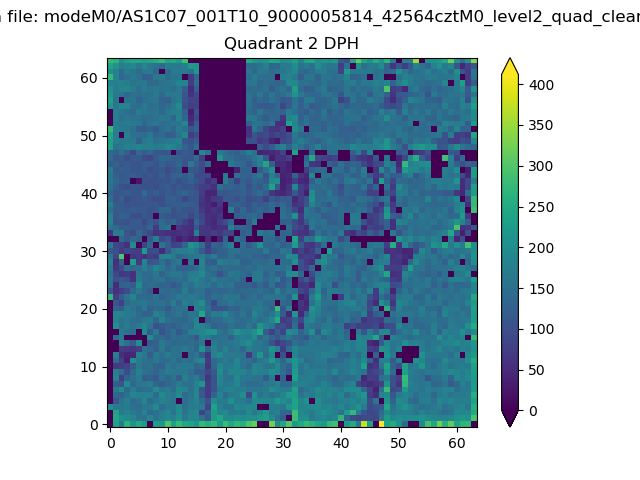
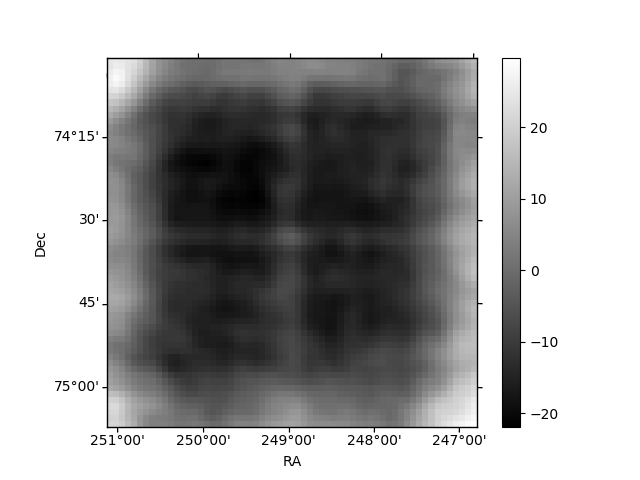
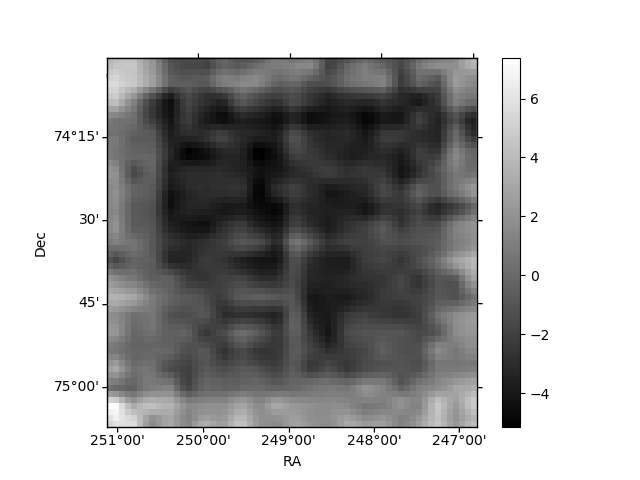
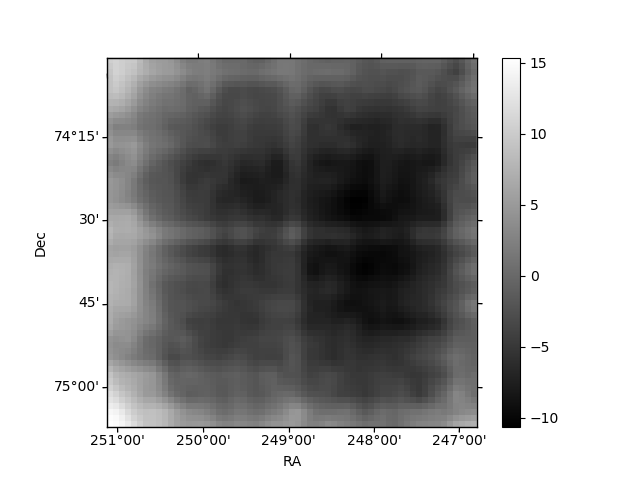
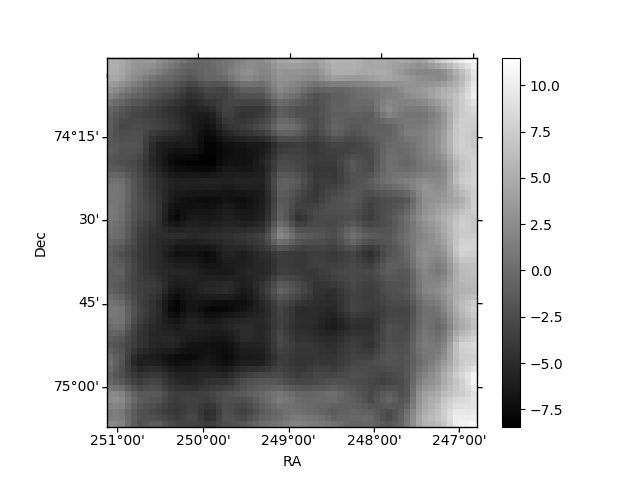
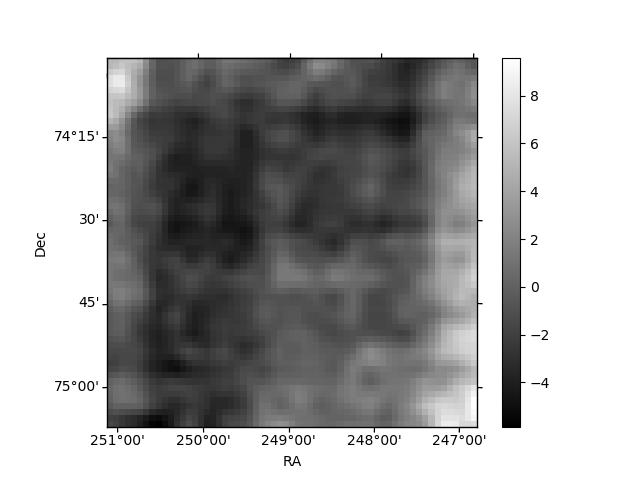
Histogram calculated using DETX and DETY for each event in the final _common_clean file
| Quadrant A | 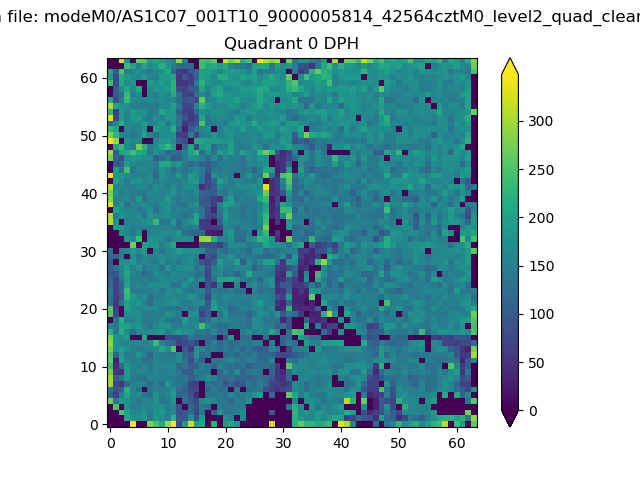 |
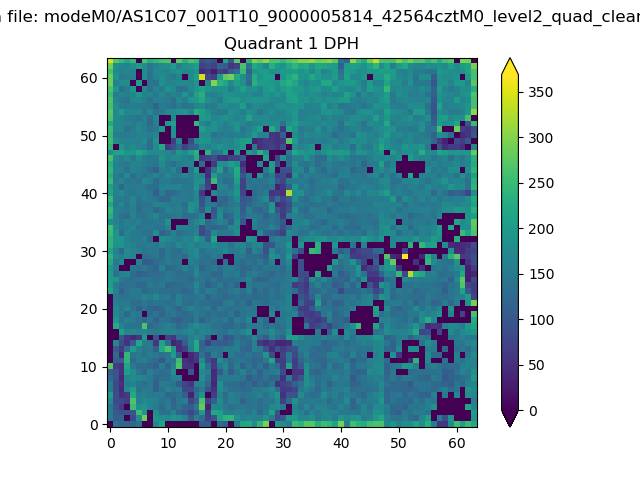 |
Quadrant B |
|---|---|---|---|
| Quadrant D | 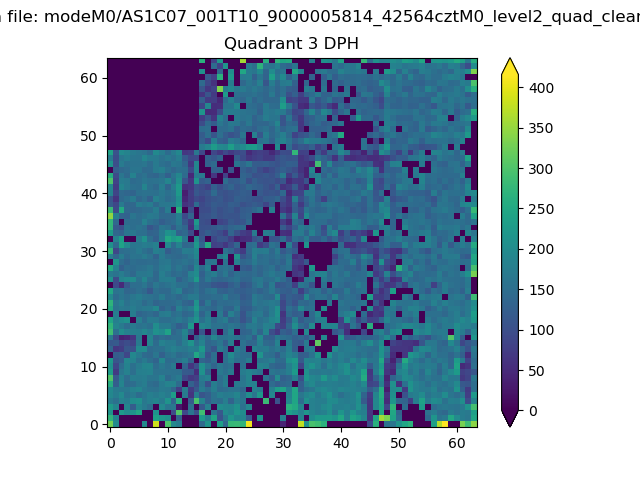 |
 |
Quadrant C |
| Plot type | Count rate plots | Images |
|---|---|---|
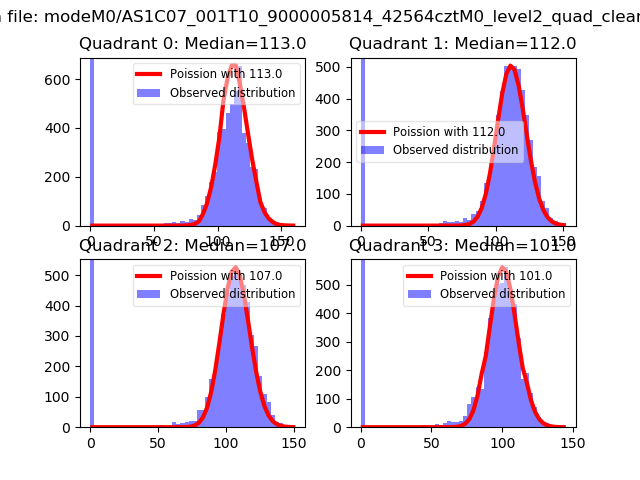
| Comparison with Poisson distribution Blue bars denote a histogram of data divided into 1 sec bins. Red curve is a Poisson curve with rate = median count rate of data. |
 |
 |
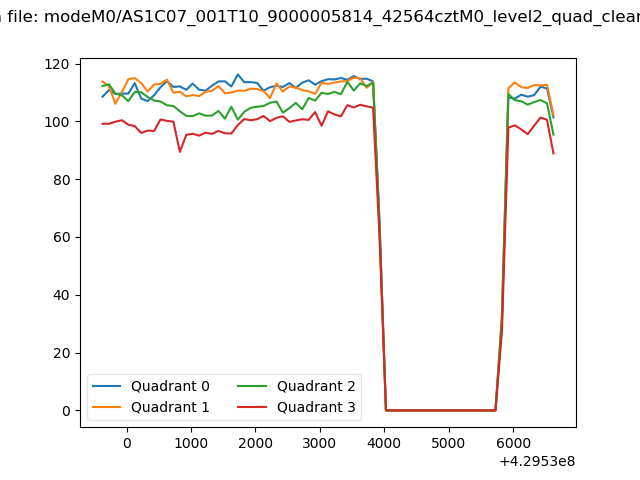
| Quadrant-wise count rates Data is divided into 100 sec bins |
 |
|
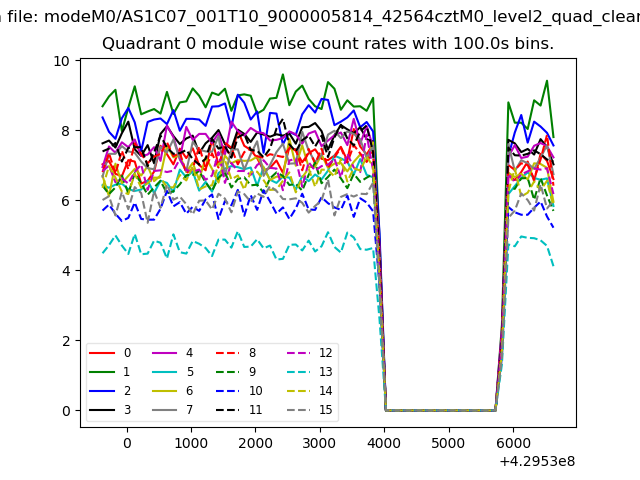
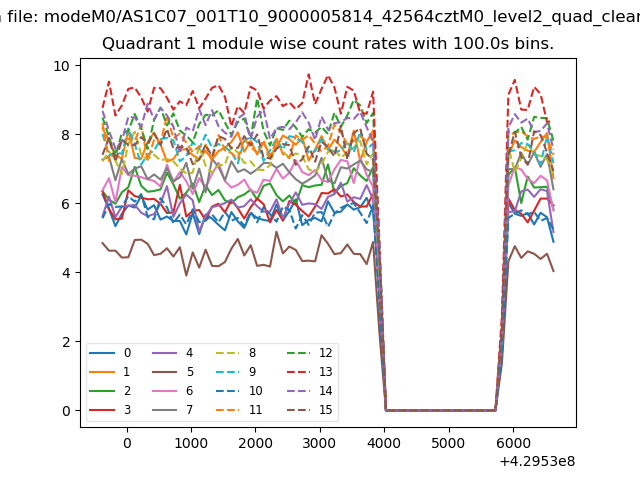
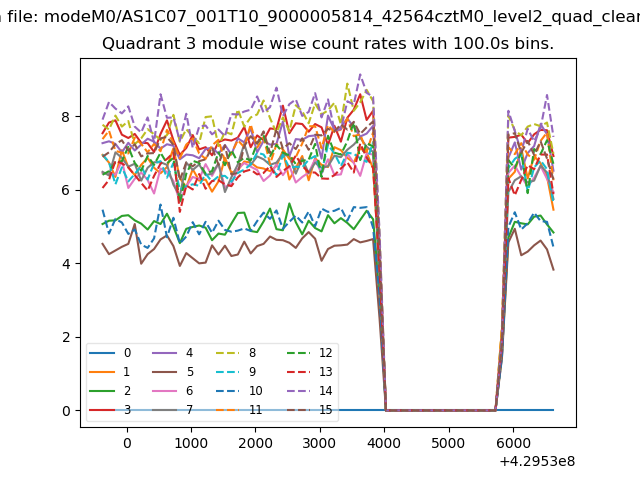
| Module-wise count rates for Quadrant A Data is divided into 100 sec bins |
 |
 |
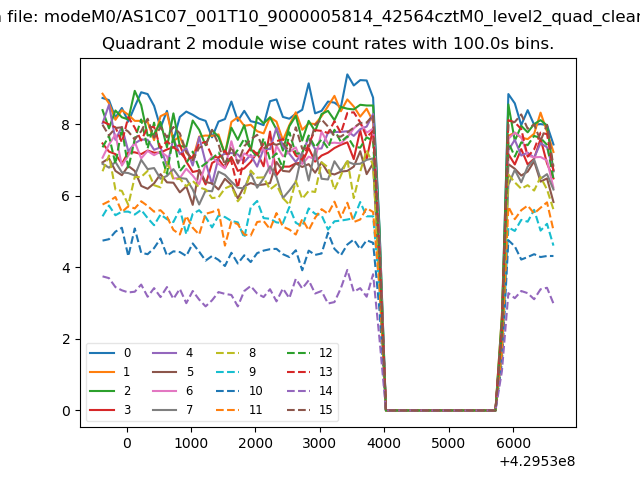
| Module-wise count rates for Quadrant B Data is divided into 100 sec bins |
 |
 |
| Module-wise count rates for Quadrant C Data is divided into 100 sec bins |
 |
 |
| Module-wise count rates for Quadrant D Data is divided into 100 sec bins |
 |
 |
| Parameter | Plot |
|---|---|
| CZT HV Monitor | 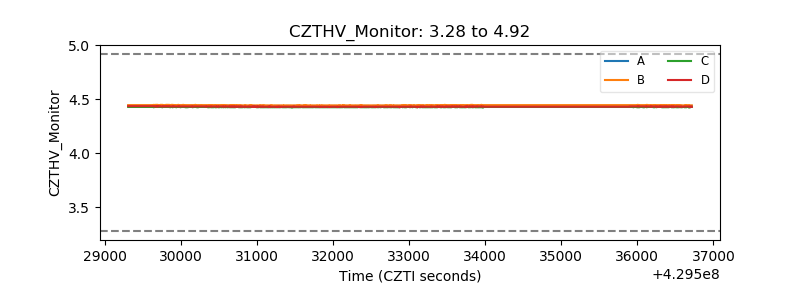 |
| D_VDD | 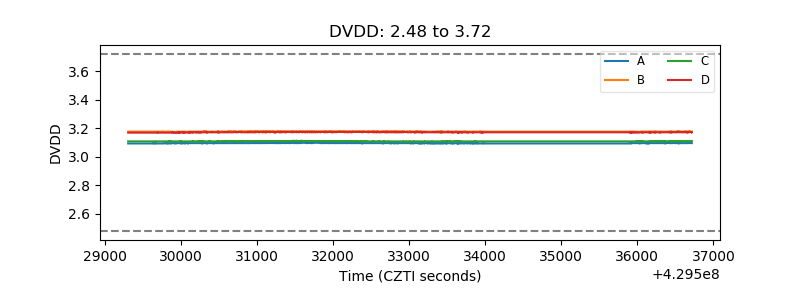 |
| Temperature 1 | 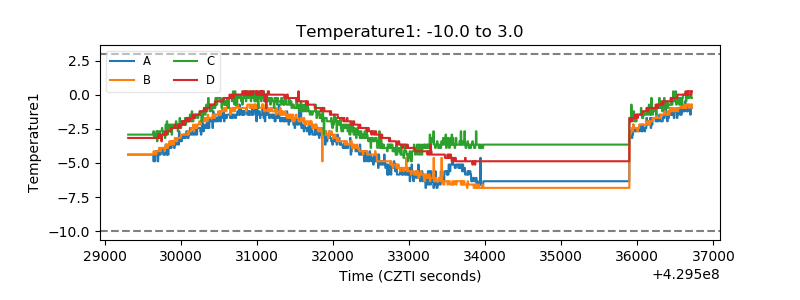 |
| Veto HV Monitor | 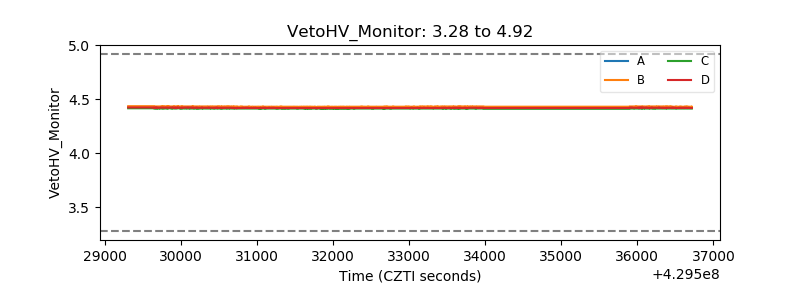 |
| Veto LLD | 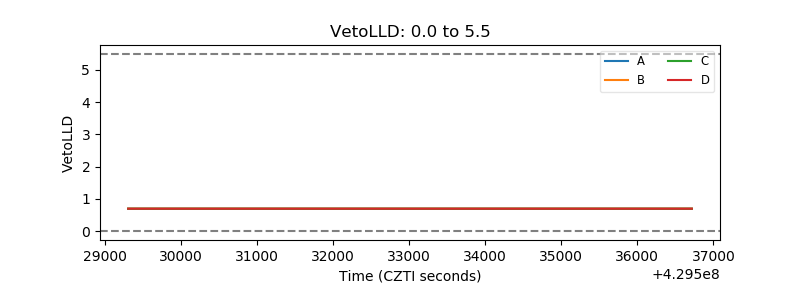 |
| Alpha Counter | 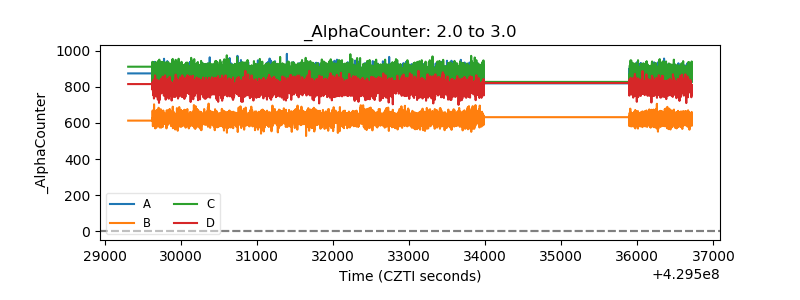 |
| _CPM_Rate | 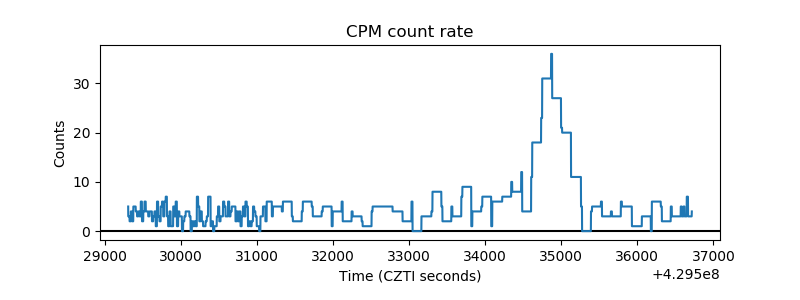 |
| CZT Counter | 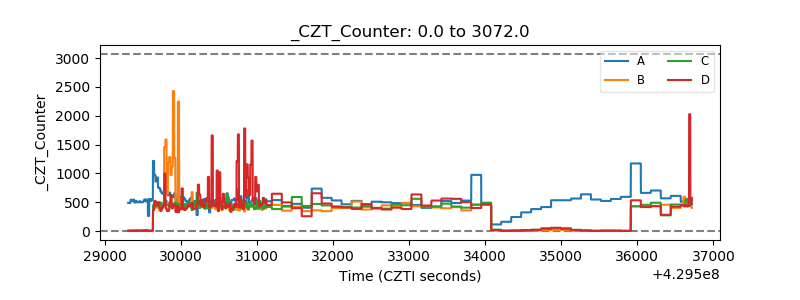 |
| +2.5 Volts monitor | 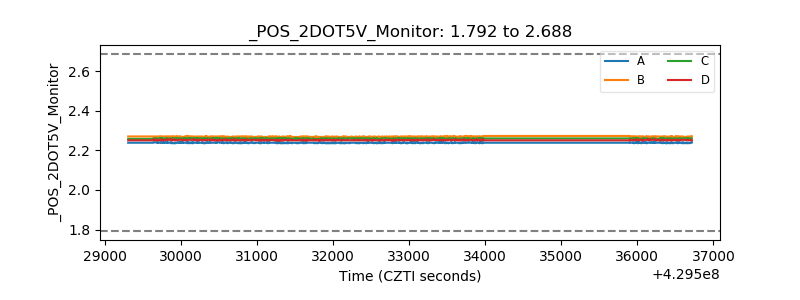 |
| +5 Volts monitor | 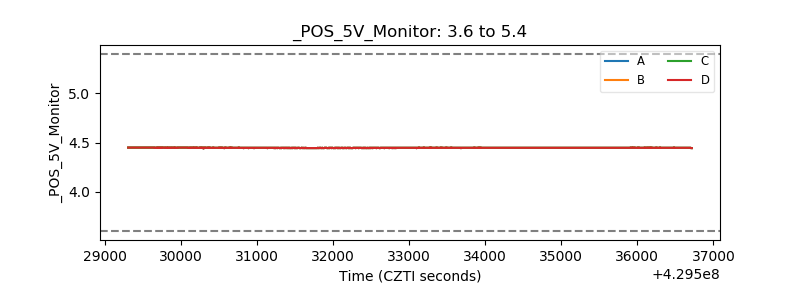 |
| _ROLL_ROT | 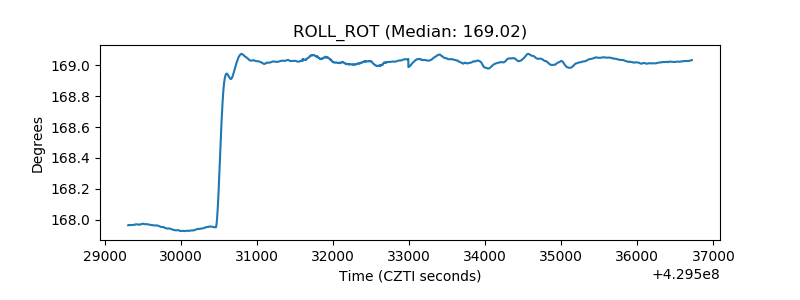 |
| _Roll_DEC | 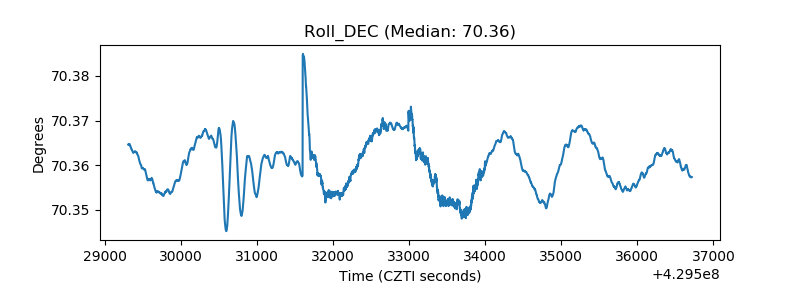 |
| _Roll_RA | 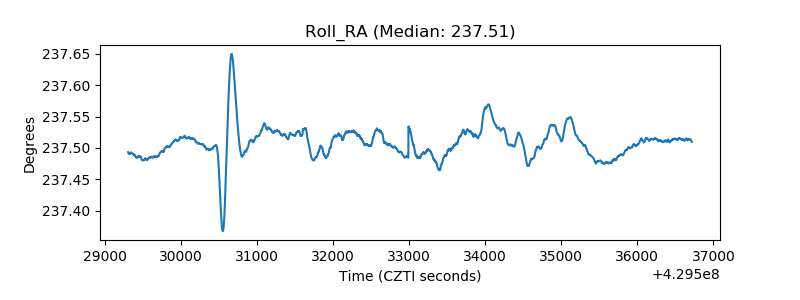 |
| Veto Counter | 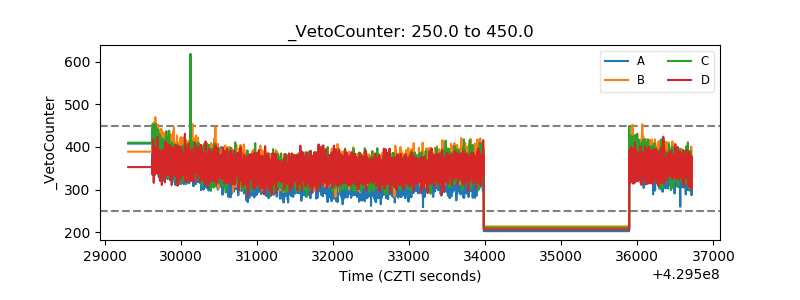 |