| Param | Original file | Final file |
|---|---|---|
| Filename | modeM0/AS1C07_001T10_9000005814_42565cztM0_level2.fits | modeM0/AS1C07_001T10_9000005814_42565cztM0_level2_quad_clean.evt |
| Size (bytes) | 338,408,640 | 93,245,760 |
| Size | 322.7 MB | 88.9 MB |
| Events in quadrant A | 3,080,114 | 632,630 |
| Events in quadrant B | 2,572,632 | 631,690 |
| Events in quadrant C | 2,738,385 | 600,264 |
| Events in quadrant D | 3,689,560 | 558,087 |
| Mode M0 | |||
|---|---|---|---|
| Quadrant | BADHDUFLAG | Total packets | Discarded packets |
| A | 0 | 12523 | 2 |
| B | 0 | 11851 | 2 |
| C | 0 | 11908 | 2 |
| D | 0 | 14984 | 3 |
| Mode M9 | |||
|---|---|---|---|
| Quadrant | BADHDUFLAG | Total packets | Discarded packets |
| A | 0 | 18 | 0 |
| B | 0 | 19 | 0 |
| C | 0 | 19 | 0 |
| D | 0 | 19 | 0 |
| Mode SS | |||
|---|---|---|---|
| Quadrant | BADHDUFLAG | Total packets | Discarded packets |
| A | 0 | 118 | 0 |
| B | 0 | 118 | 0 |
| C | 0 | 118 | 0 |
| D | 0 | 118 | 0 |
| Quadrant | Total seconds | Saturated seconds | Saturation percentage |
|---|---|---|---|
| A | 5726 | 14 | 0.244499% |
| B | 5726 | 18 | 0.314356% |
| C | 5726 | 13 | 0.227035% |
| D | 5725 | 199 | 3.475983% |
Noise dominated data is calculated using 1-second bins in cleaned event files. If a bin has >2000 counts, and if more than 50% of those come from <1% of pixels, then it is considered to be noise-dominated and hence unusable.
| Quadrant | # 1 sec bins | Bins with >0 counts | Bins with >2000 counts | High rate bins dominated by noise | Noise dominated (total time) | Noise dominated (detector-on time) | Marked lightcurve |
|---|---|---|---|---|---|---|---|
| A | 7279 | 5727 | 2 | 2 | 0.03% | 0.03% | 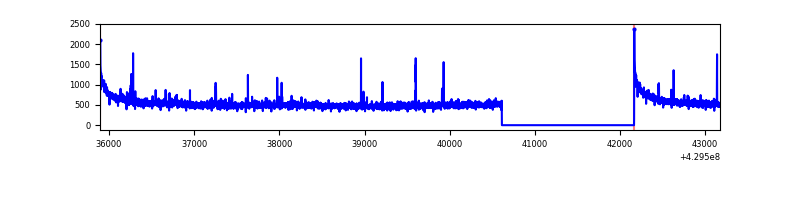 |
| B | 7279 | 5727 | 6 | 6 | 0.08% | 0.10% | 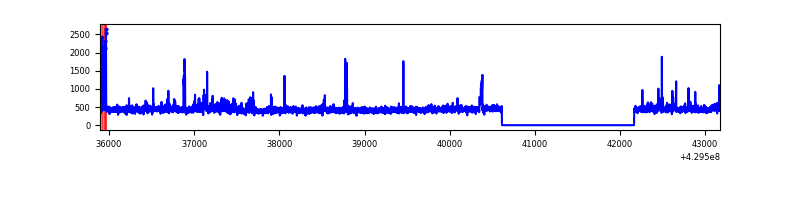 |
| C | 7279 | 5727 | 5 | 5 | 0.07% | 0.09% | 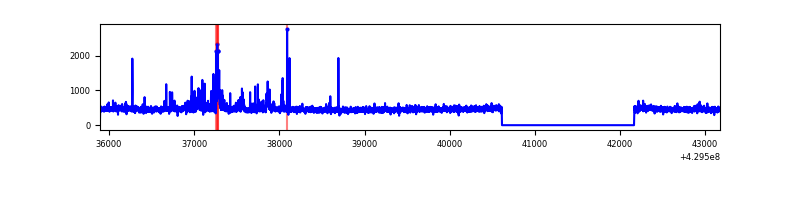 |
| D | 7278 | 5726 | 179 | 179 | 2.46% | 3.13% | 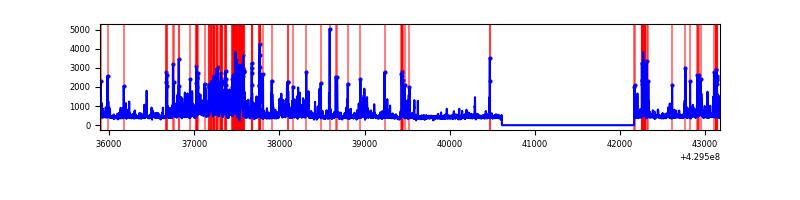 |
Top three noisy pixels from each quadrant. If the there are fewer than three noisy pixels in the level2.evt file, extra rows are filled as -1
| Pixel properties | Quadrant properties | ||||||
|---|---|---|---|---|---|---|---|
| Quadrant | DetID | PixID | Counts | Sigma | Mean | Median | Sigma |
| A | 10 | 83 | 647483 | 5188.02 | 611 | 598 | 124.7 |
| A | 2 | 79 | 23597 | 184.45 | 611 | 598 | 124.7 |
| A | 13 | 248 | 19283 | 149.85 | 611 | 598 | 124.7 |
| B | 0 | 245 | 90034 | 770.54 | 603 | 585 | 116.1 |
| B | 5 | 172 | 40532 | 344.11 | 603 | 585 | 116.1 |
| B | 5 | 255 | 35528 | 301.01 | 603 | 585 | 116.1 |
| C | 15 | 214 | 242895 | 1763.23 | 590 | 592 | 137.4 |
| C | 3 | 233 | 168183 | 1219.55 | 590 | 592 | 137.4 |
| C | 9 | 54 | 9301 | 63.37 | 590 | 592 | 137.4 |
| D | 2 | 249 | 828624 | 5617.08 | 593 | 575 | 147.4 |
| D | 1 | 52 | 158714 | 1072.74 | 593 | 575 | 147.4 |
| D | 1 | 47 | 109096 | 736.15 | 593 | 575 | 147.4 |
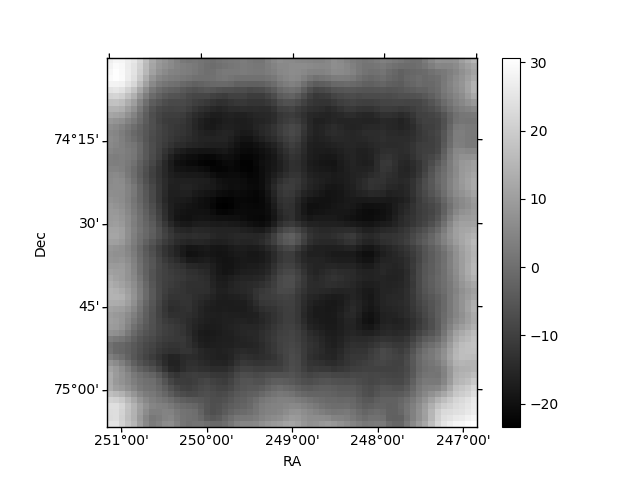
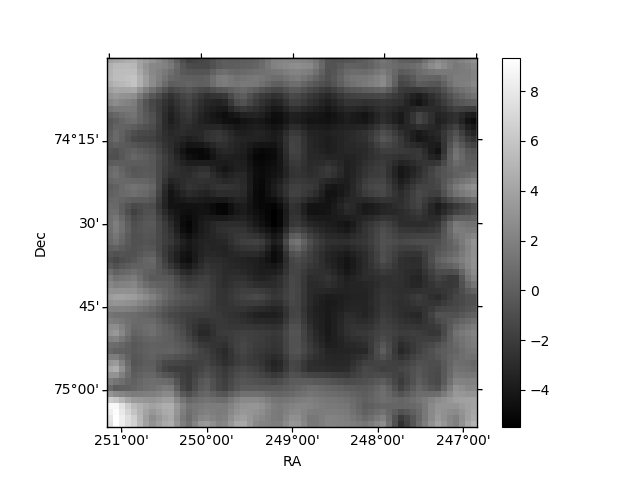
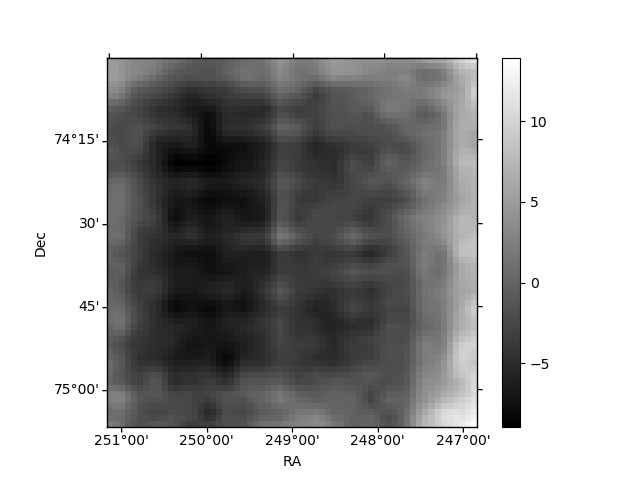
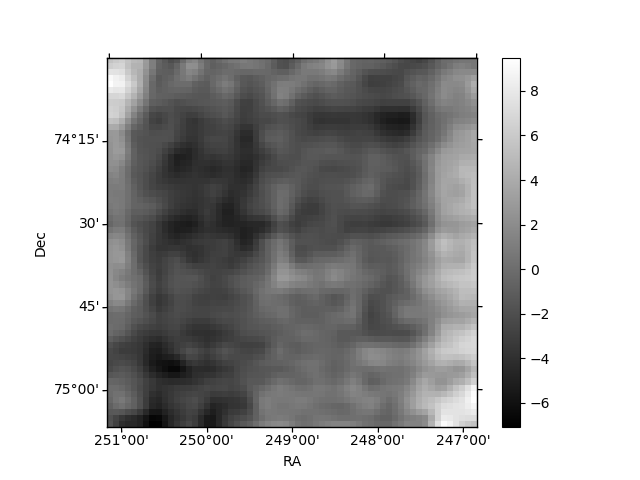
Histogram calculated using DETX and DETY for each event in the final _common_clean file
| Quadrant A | 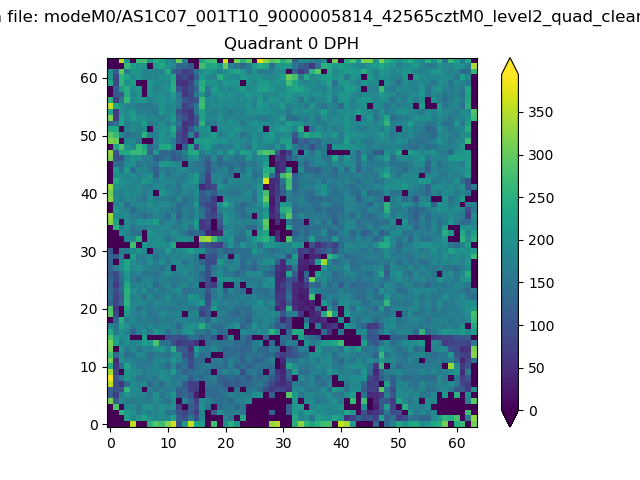 |
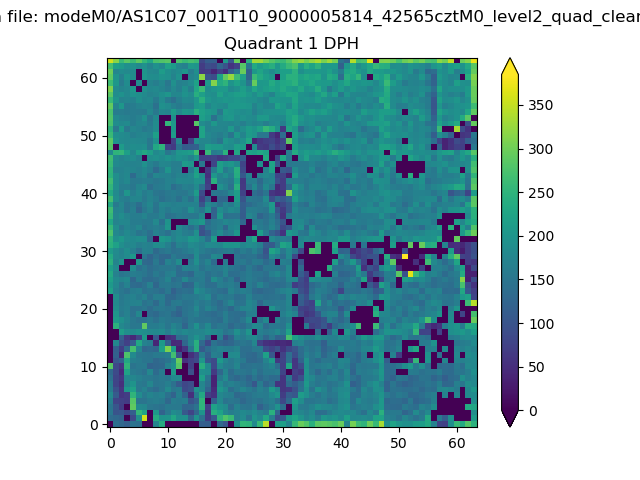 |
Quadrant B |
|---|---|---|---|
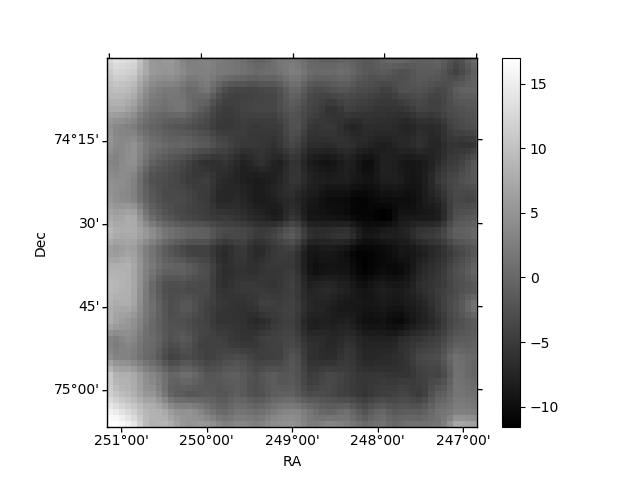
| Quadrant D | 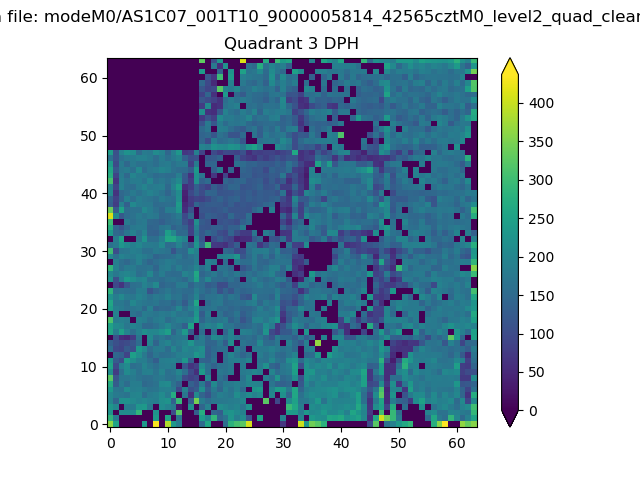 |
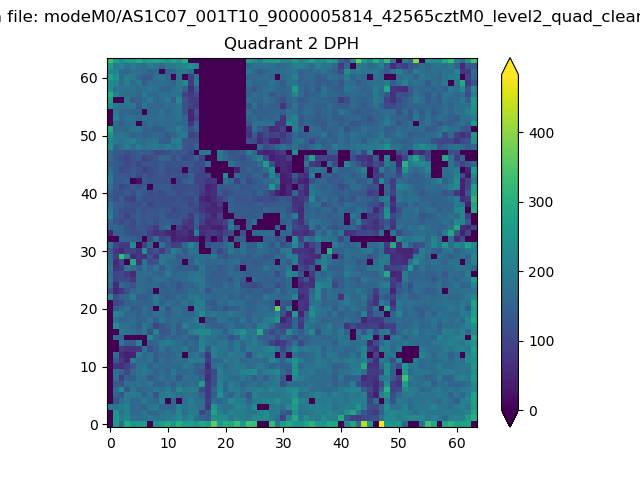 |
Quadrant C |
| Plot type | Count rate plots | Images |
|---|---|---|
| Comparison with Poisson distribution Blue bars denote a histogram of data divided into 1 sec bins. Red curve is a Poisson curve with rate = median count rate of data. |
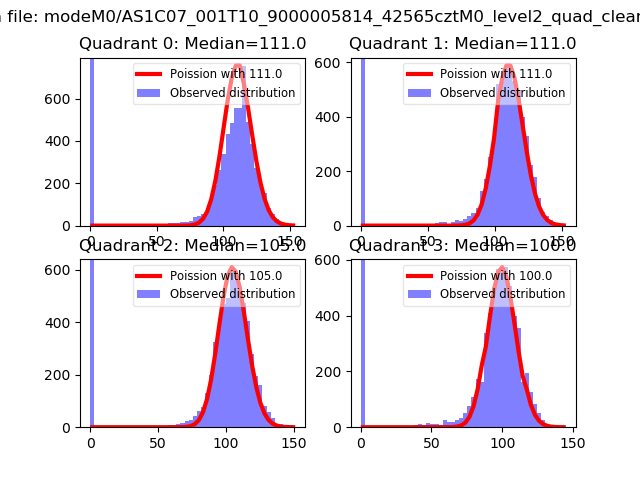 |
 |
| Quadrant-wise count rates Data is divided into 100 sec bins |
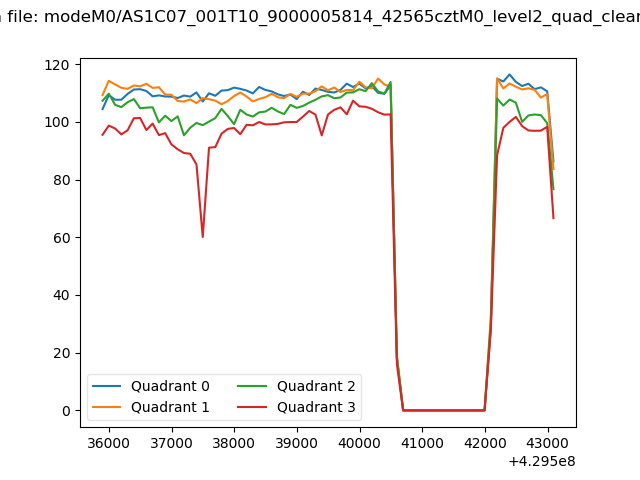 |
|
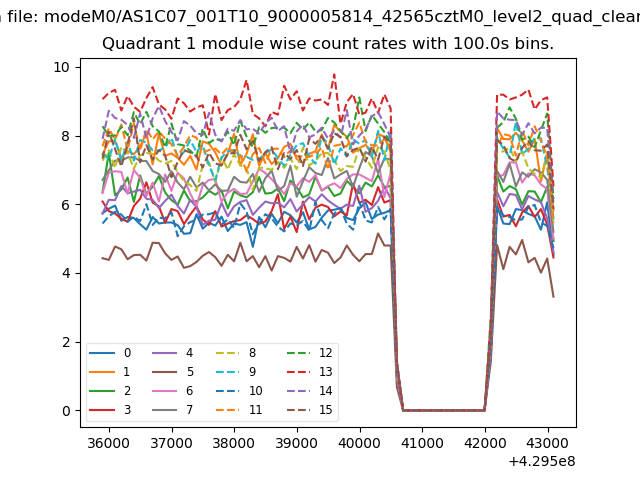
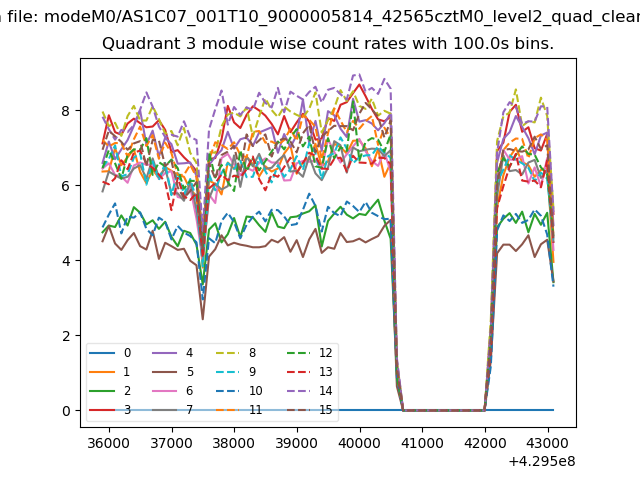
| Module-wise count rates for Quadrant A Data is divided into 100 sec bins |
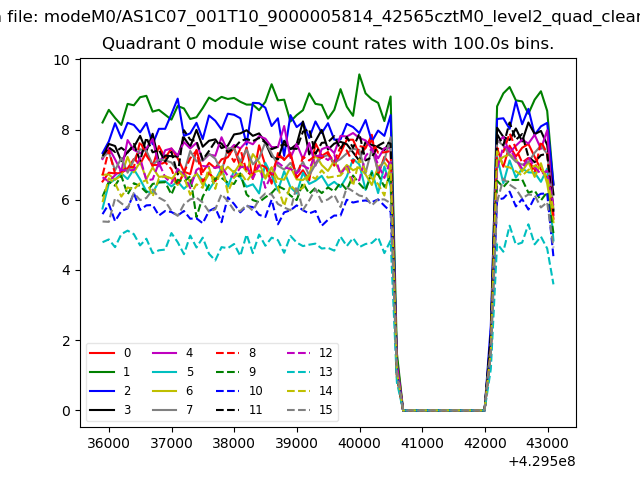 |
 |
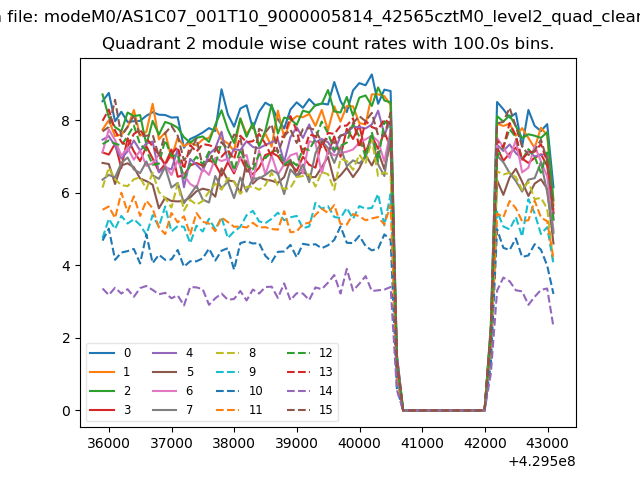
| Module-wise count rates for Quadrant B Data is divided into 100 sec bins |
 |
 |
| Module-wise count rates for Quadrant C Data is divided into 100 sec bins |
 |
 |
| Module-wise count rates for Quadrant D Data is divided into 100 sec bins |
 |
 |
| Parameter | Plot |
|---|---|
| CZT HV Monitor | 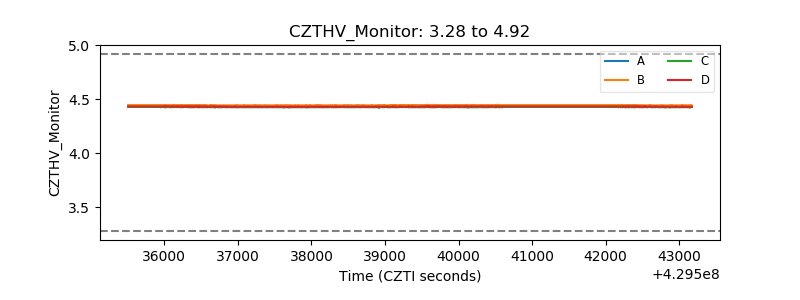 |
| D_VDD | 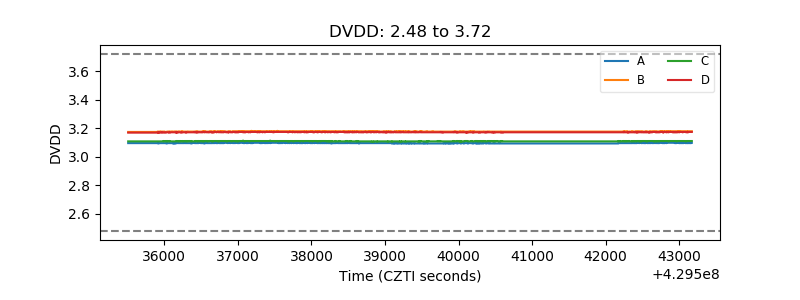 |
| Temperature 1 | 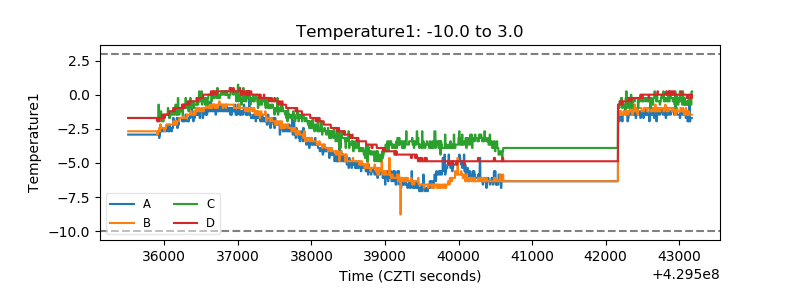 |
| Veto HV Monitor | 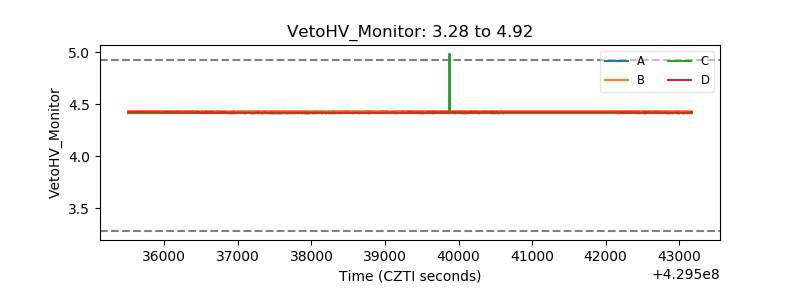 |
| Veto LLD | 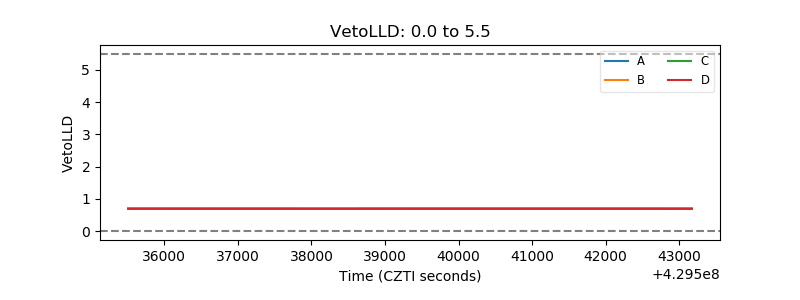 |
| Alpha Counter | 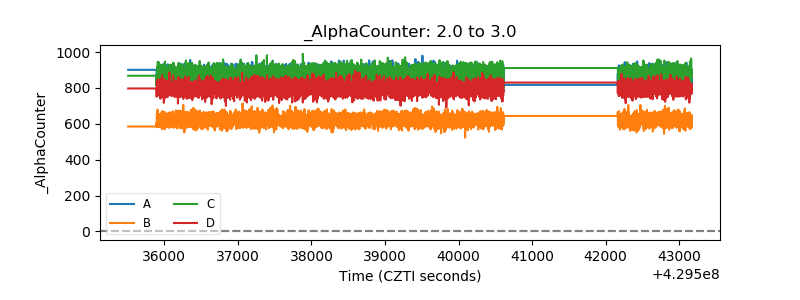 |
| _CPM_Rate | 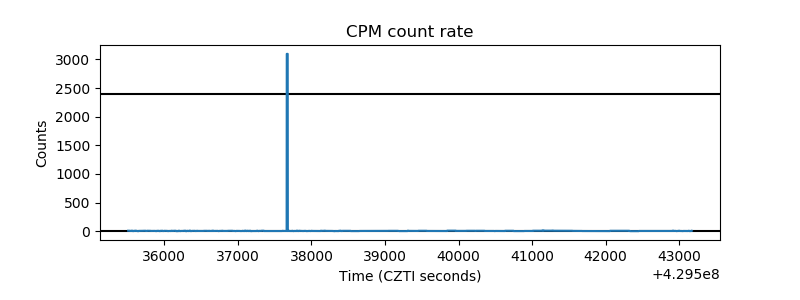 |
| CZT Counter | 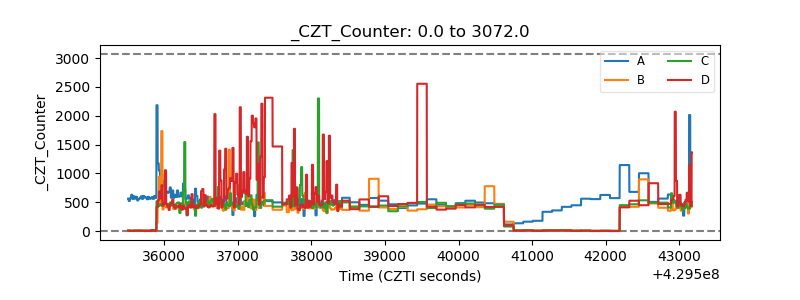 |
| +2.5 Volts monitor | 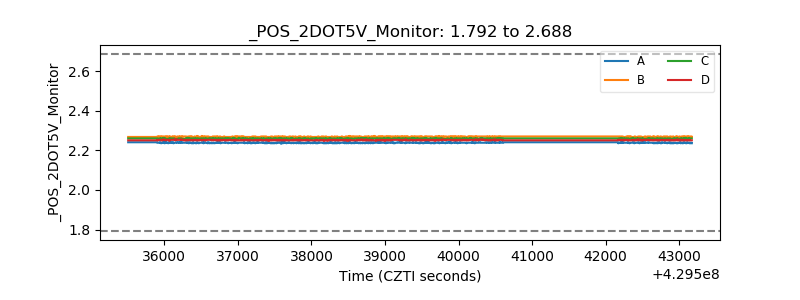 |
| +5 Volts monitor | 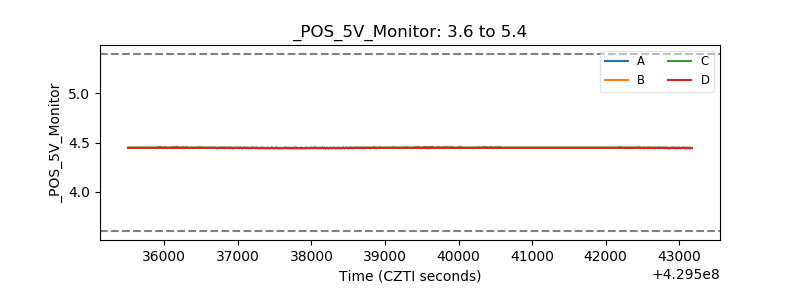 |
| _ROLL_ROT | 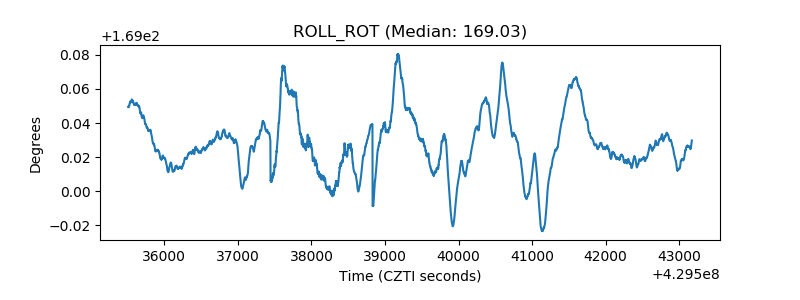 |
| _Roll_DEC | 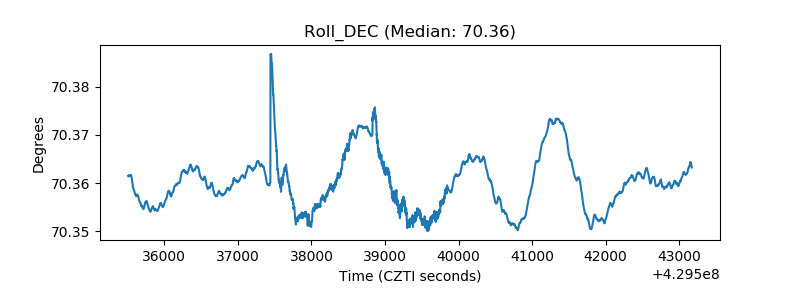 |
| _Roll_RA | 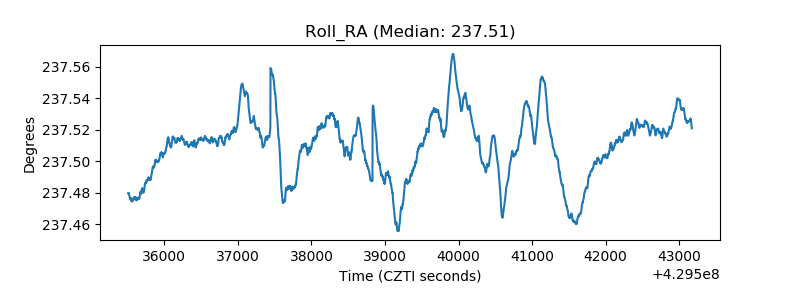 |
| Veto Counter | 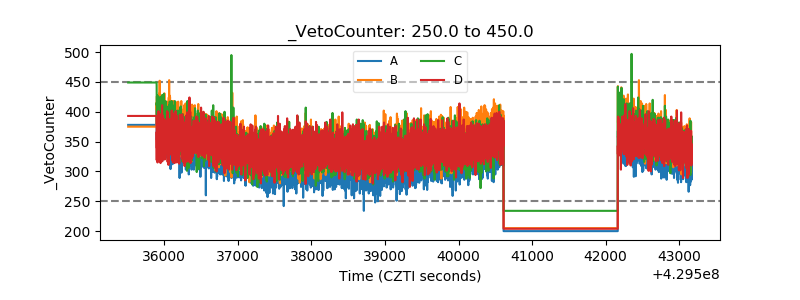 |