| Param | Original file | Final file |
|---|---|---|
| Filename | modeM0/AS1C07_001T10_9000005814_42566cztM0_level2.fits | modeM0/AS1C07_001T10_9000005814_42566cztM0_level2_quad_clean.evt |
| Size (bytes) | 337,337,280 | 91,465,920 |
| Size | 321.7 MB | 87.2 MB |
| Events in quadrant A | 2,975,445 | 624,197 |
| Events in quadrant B | 2,694,666 | 613,216 |
| Events in quadrant C | 2,582,896 | 590,555 |
| Events in quadrant D | 3,794,295 | 546,642 |
| Mode M0 | |||
|---|---|---|---|
| Quadrant | BADHDUFLAG | Total packets | Discarded packets |
| A | 0 | 12169 | 1 |
| B | 0 | 12020 | 1 |
| C | 0 | 11453 | 1 |
| D | 0 | 15261 | 1 |
| Mode M9 | |||
|---|---|---|---|
| Quadrant | BADHDUFLAG | Total packets | Discarded packets |
| A | 0 | 14 | 0 |
| B | 0 | 14 | 0 |
| C | 0 | 14 | 0 |
| D | 0 | 14 | 0 |
| Mode SS | |||
|---|---|---|---|
| Quadrant | BADHDUFLAG | Total packets | Discarded packets |
| A | 0 | 114 | 0 |
| B | 0 | 114 | 0 |
| C | 0 | 114 | 0 |
| D | 0 | 114 | 0 |
| Quadrant | Total seconds | Saturated seconds | Saturation percentage |
|---|---|---|---|
| A | 5647 | 14 | 0.247919% |
| B | 5647 | 42 | 0.743758% |
| C | 5647 | 8 | 0.141668% |
| D | 5647 | 232 | 4.108376% |
Noise dominated data is calculated using 1-second bins in cleaned event files. If a bin has >2000 counts, and if more than 50% of those come from <1% of pixels, then it is considered to be noise-dominated and hence unusable.
| Quadrant | # 1 sec bins | Bins with >0 counts | Bins with >2000 counts | High rate bins dominated by noise | Noise dominated (total time) | Noise dominated (detector-on time) | Marked lightcurve |
|---|---|---|---|---|---|---|---|
| A | 6990 | 5648 | 4 | 4 | 0.06% | 0.07% | 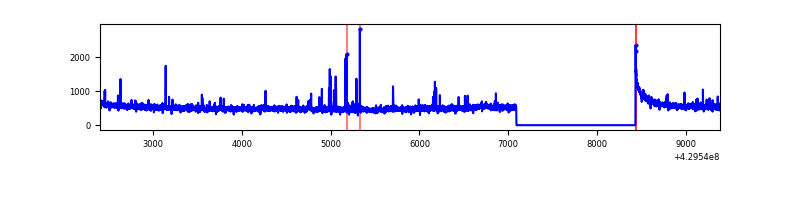 |
| B | 6990 | 5648 | 27 | 27 | 0.39% | 0.48% | 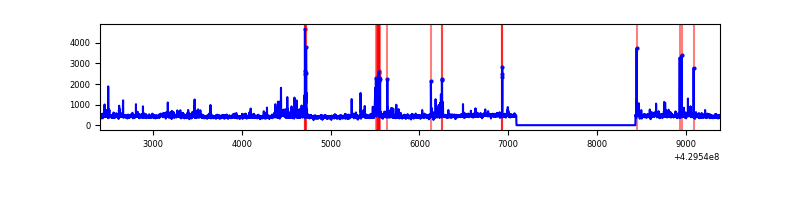 |
| C | 6990 | 5648 | 5 | 5 | 0.07% | 0.09% | 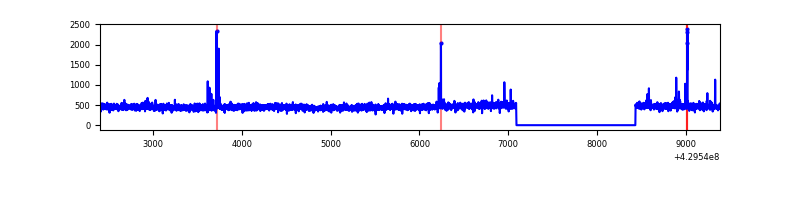 |
| D | 6990 | 5648 | 229 | 229 | 3.28% | 4.05% | 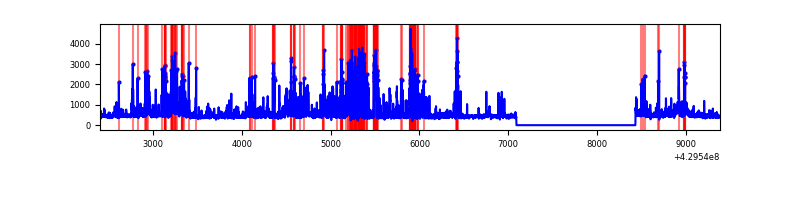 |
Top three noisy pixels from each quadrant. If the there are fewer than three noisy pixels in the level2.evt file, extra rows are filled as -1
| Pixel properties | Quadrant properties | ||||||
|---|---|---|---|---|---|---|---|
| Quadrant | DetID | PixID | Counts | Sigma | Mean | Median | Sigma |
| A | 10 | 83 | 564163 | 4542.95 | 603 | 590 | 124.1 |
| A | 2 | 79 | 51830 | 413.04 | 603 | 590 | 124.1 |
| A | 15 | 237 | 12095 | 92.74 | 603 | 590 | 124.1 |
| B | 0 | 245 | 213682 | 1867.4 | 594 | 578 | 114.1 |
| B | 5 | 172 | 95965 | 835.86 | 594 | 578 | 114.1 |
| B | 3 | 112 | 20802 | 177.22 | 594 | 578 | 114.1 |
| C | 15 | 214 | 233829 | 1707.88 | 585 | 586 | 136.6 |
| C | 14 | 254 | 25151 | 179.87 | 585 | 586 | 136.6 |
| C | 3 | 233 | 18935 | 134.36 | 585 | 586 | 136.6 |
| D | 13 | 138 | 771608 | 5404.93 | 583 | 567 | 142.7 |
| D | 2 | 249 | 158327 | 1105.88 | 583 | 567 | 142.7 |
| D | 1 | 52 | 143081 | 999.01 | 583 | 567 | 142.7 |
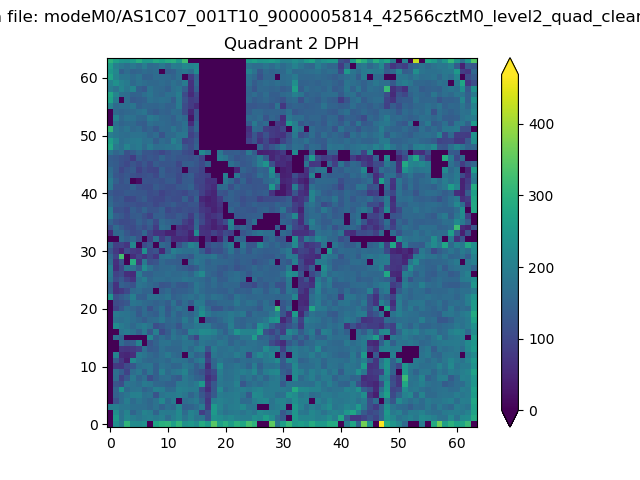
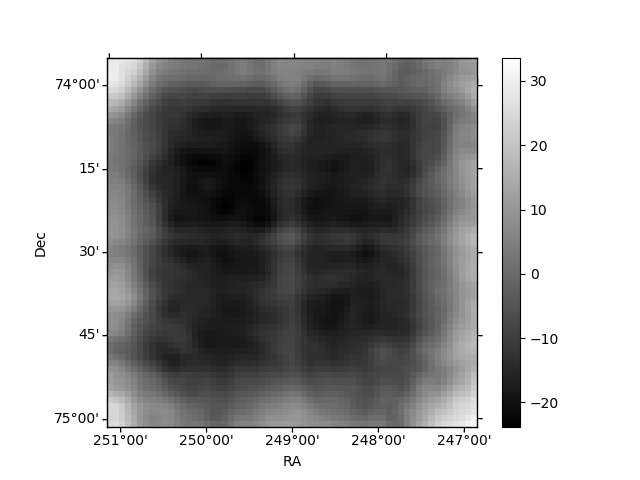
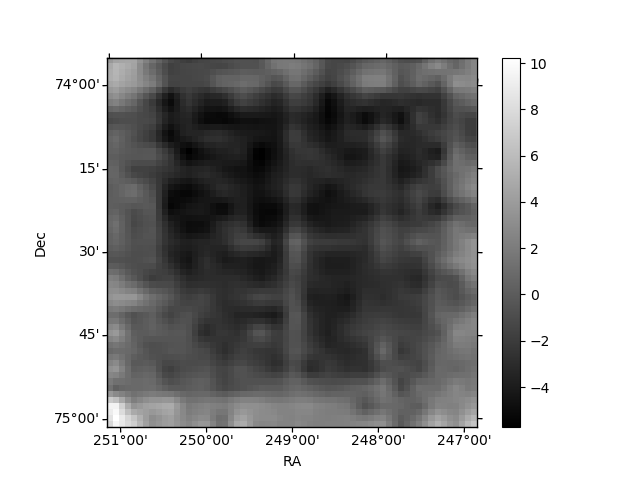
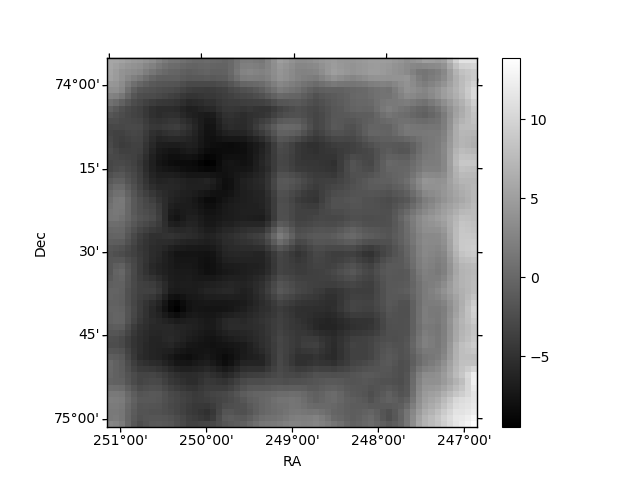
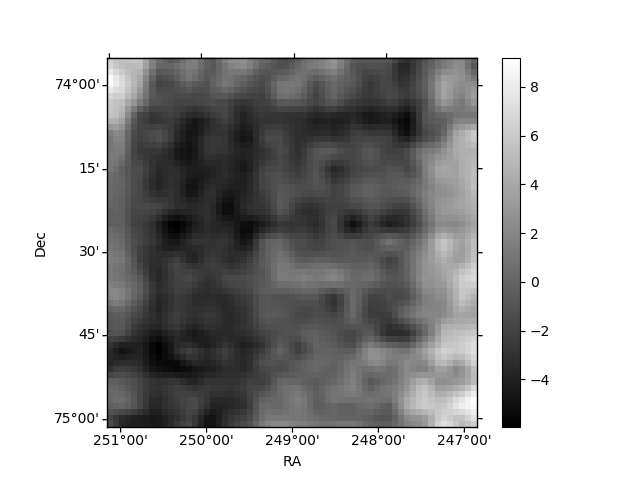
Histogram calculated using DETX and DETY for each event in the final _common_clean file
| Quadrant A | 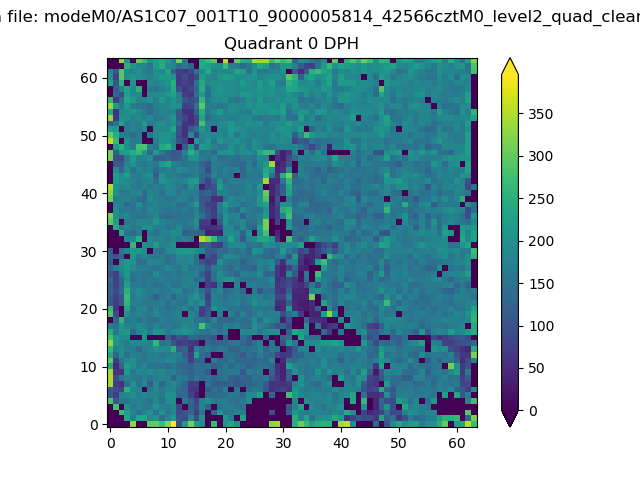 |
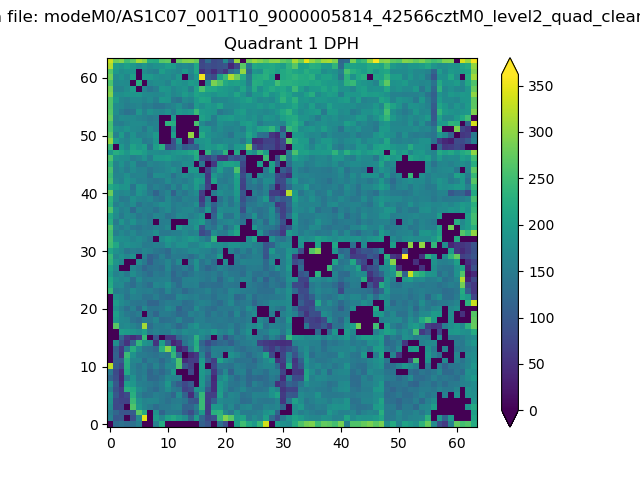 |
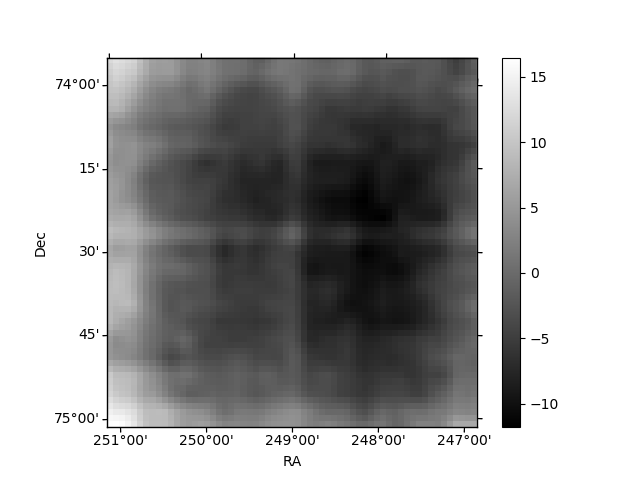
Quadrant B |
|---|---|---|---|
| Quadrant D | 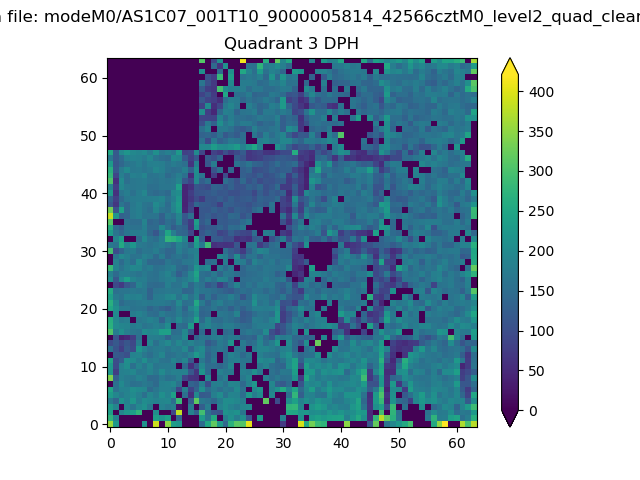 |
 |
Quadrant C |
| Plot type | Count rate plots | Images |
|---|---|---|
| Comparison with Poisson distribution Blue bars denote a histogram of data divided into 1 sec bins. Red curve is a Poisson curve with rate = median count rate of data. |
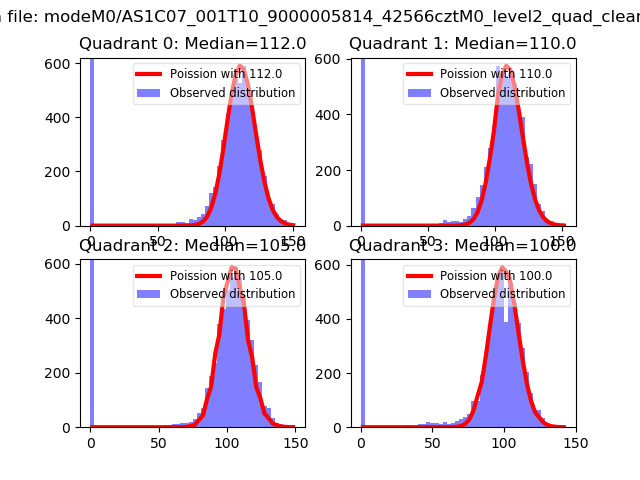 |
 |
| Quadrant-wise count rates Data is divided into 100 sec bins |
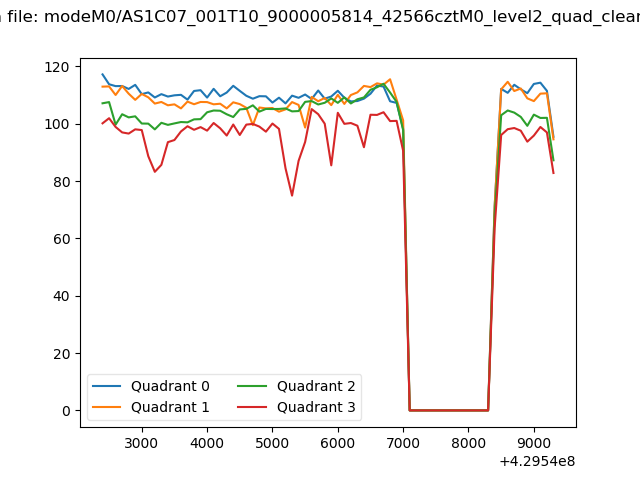 |
|
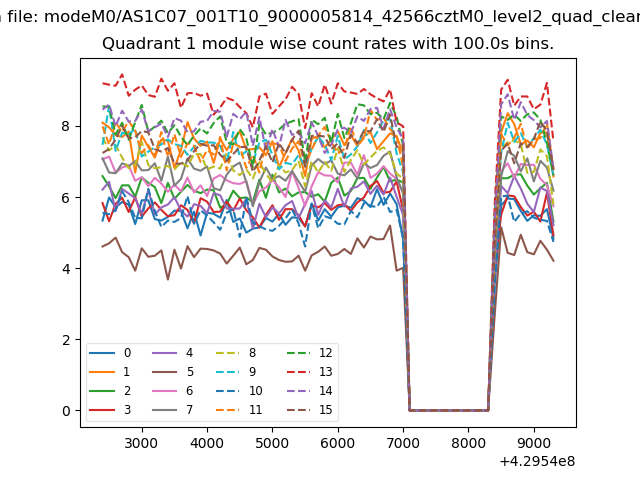
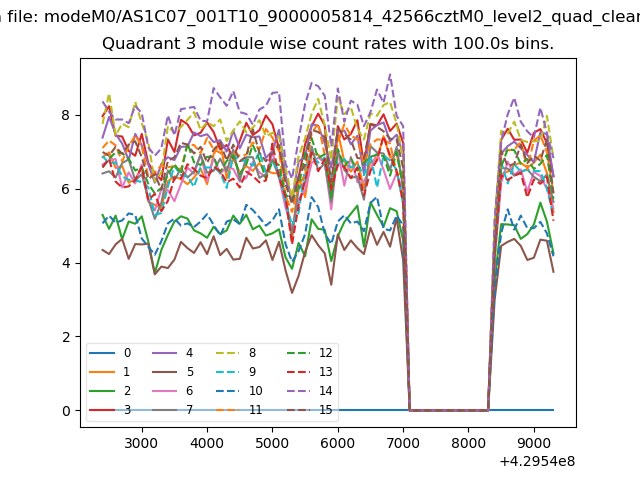
| Module-wise count rates for Quadrant A Data is divided into 100 sec bins |
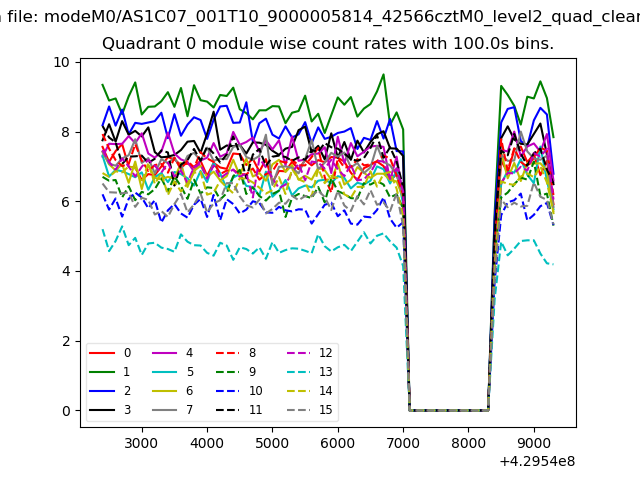 |
 |
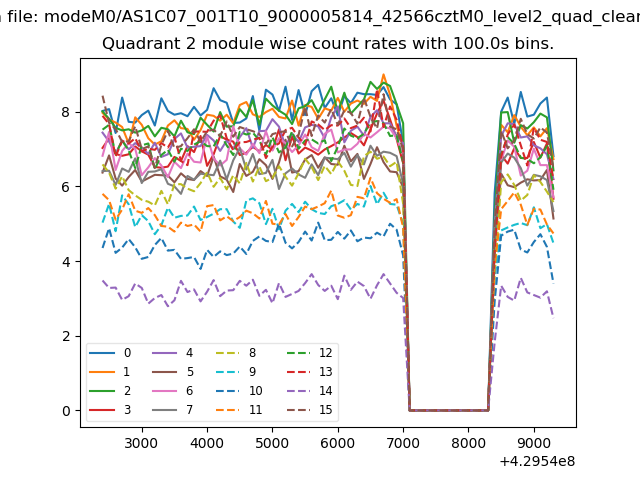
| Module-wise count rates for Quadrant B Data is divided into 100 sec bins |
 |
 |
| Module-wise count rates for Quadrant C Data is divided into 100 sec bins |
 |
 |
| Module-wise count rates for Quadrant D Data is divided into 100 sec bins |
 |
 |
| Parameter | Plot |
|---|---|
| CZT HV Monitor | 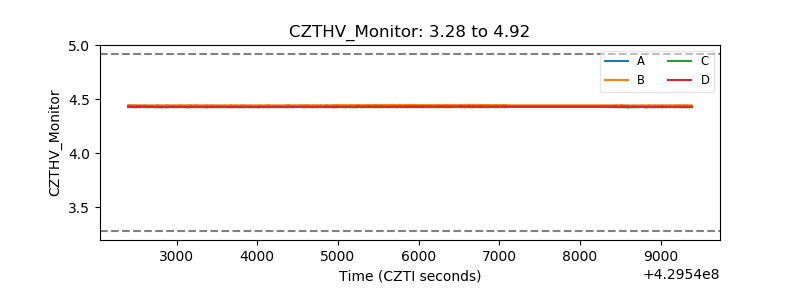 |
| D_VDD | 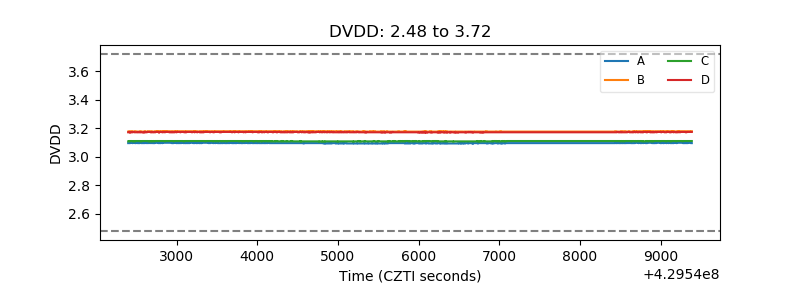 |
| Temperature 1 | 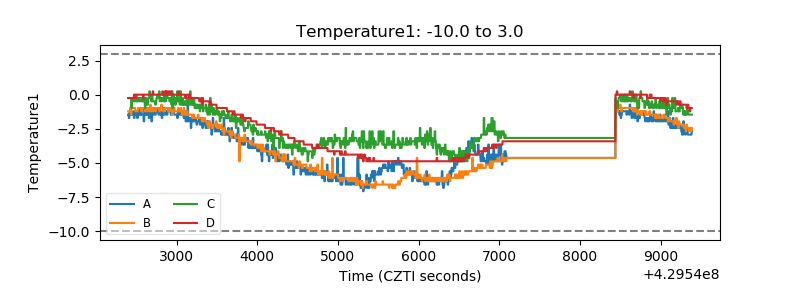 |
| Veto HV Monitor | 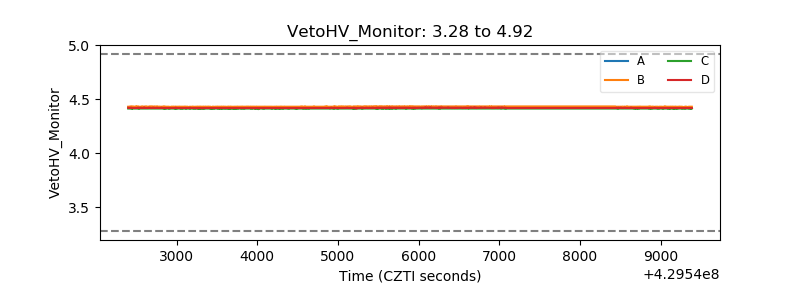 |
| Veto LLD | 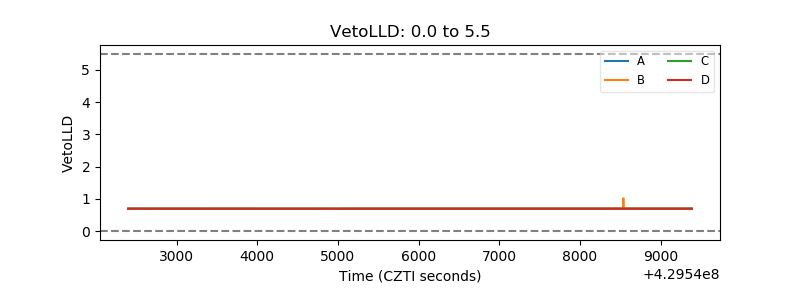 |
| Alpha Counter | 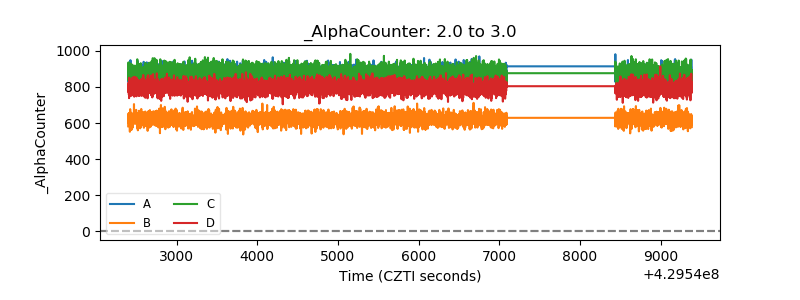 |
| _CPM_Rate | 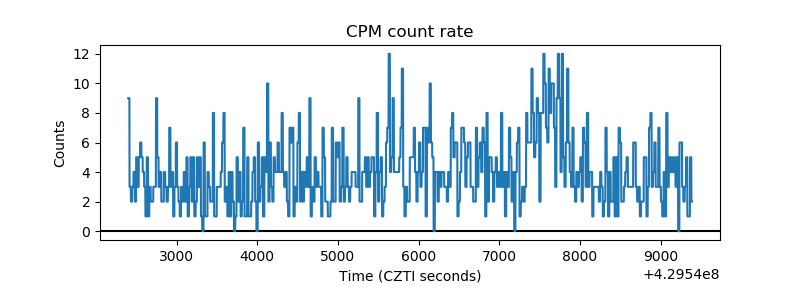 |
| CZT Counter | 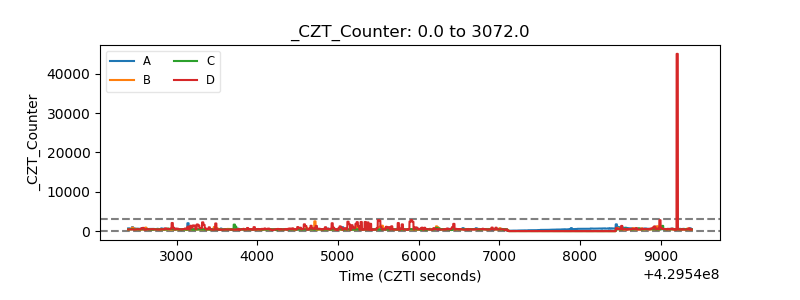 |
| +2.5 Volts monitor | 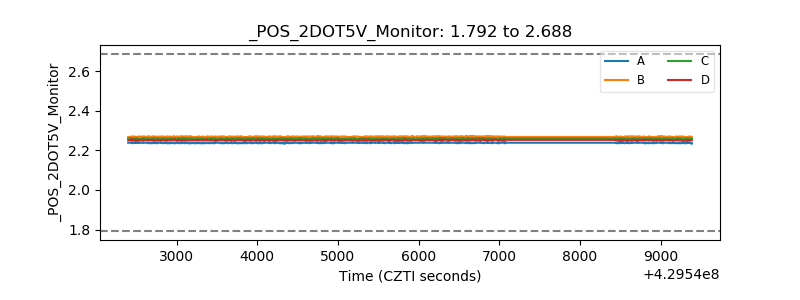 |
| +5 Volts monitor | 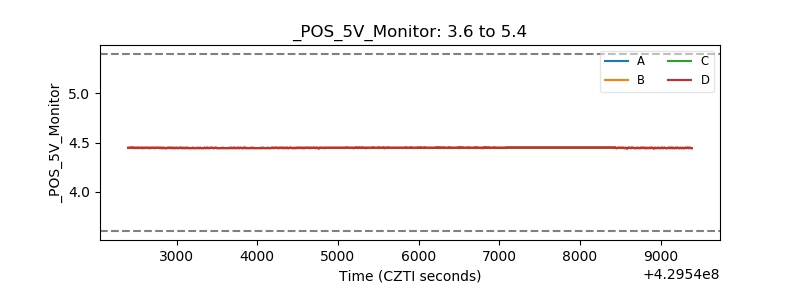 |
| _ROLL_ROT | 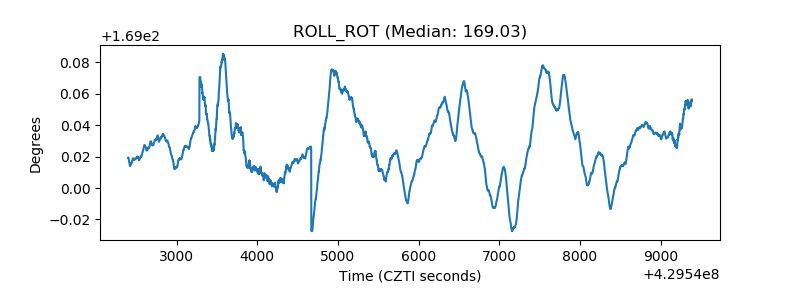 |
| _Roll_DEC | 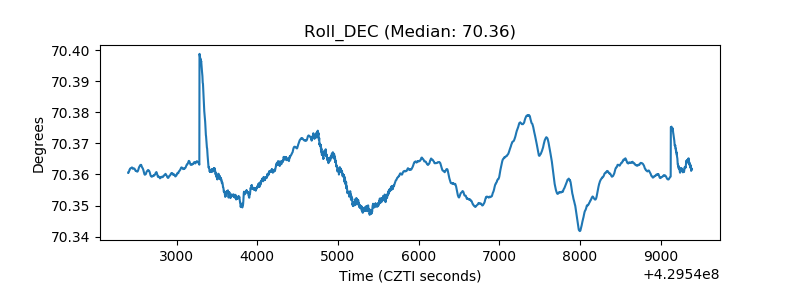 |
| _Roll_RA | 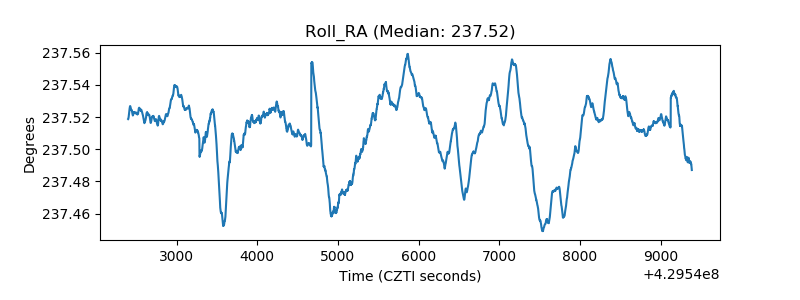 |
| Veto Counter | 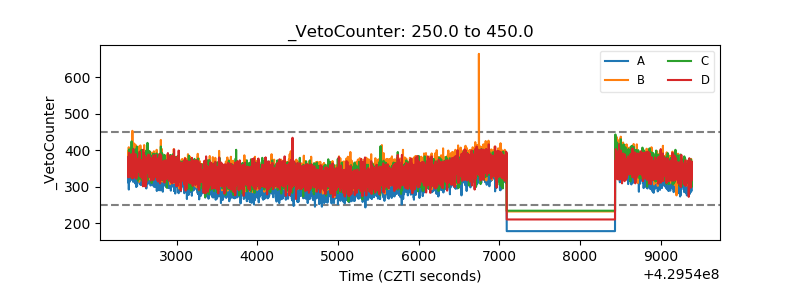 |