| Param | Original file | Final file |
|---|---|---|
| Filename | modeM0/AS1C07_001T10_9000005814_42567cztM0_level2.fits | modeM0/AS1C07_001T10_9000005814_42567cztM0_level2_quad_clean.evt |
| Size (bytes) | 373,368,960 | 93,274,560 |
| Size | 356.1 MB | 89.0 MB |
| Events in quadrant A | 3,140,421 | 636,769 |
| Events in quadrant B | 2,675,870 | 635,879 |
| Events in quadrant C | 2,677,189 | 610,396 |
| Events in quadrant D | 4,873,139 | 533,285 |
| Mode M0 | |||
|---|---|---|---|
| Quadrant | BADHDUFLAG | Total packets | Discarded packets |
| A | 0 | 12890 | 2 |
| B | 0 | 12214 | 2 |
| C | 0 | 11821 | 10 |
| D | 0 | 18689 | 17 |
| Mode M9 | |||
|---|---|---|---|
| Quadrant | BADHDUFLAG | Total packets | Discarded packets |
| A | 0 | 13 | 0 |
| B | 0 | 14 | 0 |
| C | 0 | 14 | 0 |
| D | 0 | 14 | 0 |
| Mode SS | |||
|---|---|---|---|
| Quadrant | BADHDUFLAG | Total packets | Discarded packets |
| A | 0 | 118 | 0 |
| B | 0 | 118 | 0 |
| C | 0 | 118 | 0 |
| D | 0 | 118 | 0 |
| Quadrant | Total seconds | Saturated seconds | Saturation percentage |
|---|---|---|---|
| A | 5836 | 24 | 0.411241% |
| B | 5836 | 29 | 0.496916% |
| C | 5830 | 4 | 0.068611% |
| D | 5833 | 519 | 8.897651% |
Noise dominated data is calculated using 1-second bins in cleaned event files. If a bin has >2000 counts, and if more than 50% of those come from <1% of pixels, then it is considered to be noise-dominated and hence unusable.
| Quadrant | # 1 sec bins | Bins with >0 counts | Bins with >2000 counts | High rate bins dominated by noise | Noise dominated (total time) | Noise dominated (detector-on time) | Marked lightcurve |
|---|---|---|---|---|---|---|---|
| A | 7117 | 5837 | 11 | 11 | 0.15% | 0.19% | 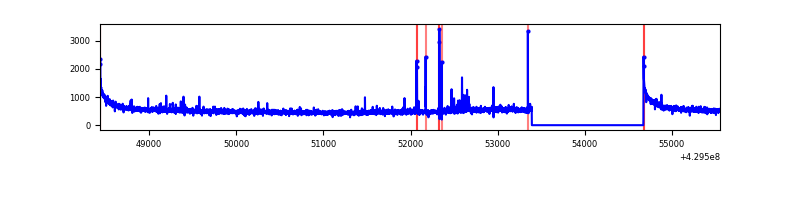 |
| B | 7117 | 5837 | 22 | 22 | 0.31% | 0.38% | 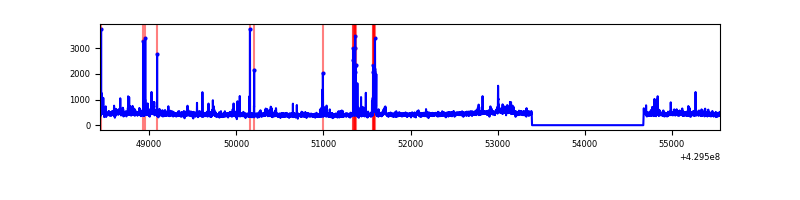 |
| C | 7117 | 5835 | 3 | 3 | 0.04% | 0.05% | 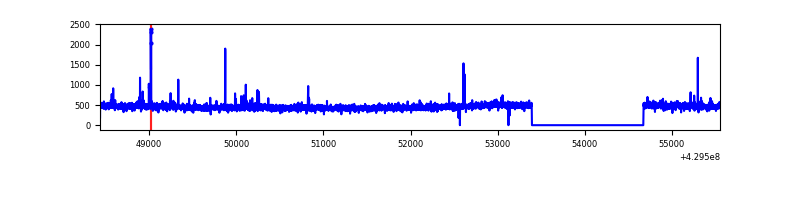 |
| D | 7117 | 5836 | 441 | 441 | 6.20% | 7.56% | 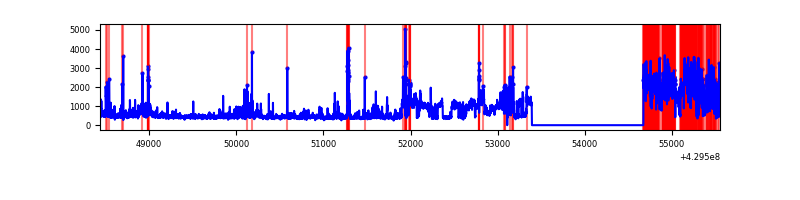 |
Top three noisy pixels from each quadrant. If the there are fewer than three noisy pixels in the level2.evt file, extra rows are filled as -1
| Pixel properties | Quadrant properties | ||||||
|---|---|---|---|---|---|---|---|
| Quadrant | DetID | PixID | Counts | Sigma | Mean | Median | Sigma |
| A | 10 | 83 | 646512 | 5049.99 | 624 | 612 | 127.9 |
| A | 15 | 237 | 31258 | 239.61 | 624 | 612 | 127.9 |
| A | 7 | 3 | 21743 | 165.21 | 624 | 612 | 127.9 |
| B | 5 | 172 | 128491 | 1076.35 | 615 | 597 | 118.8 |
| B | 0 | 245 | 75724 | 632.26 | 615 | 597 | 118.8 |
| B | 3 | 112 | 16649 | 135.09 | 615 | 597 | 118.8 |
| C | 15 | 214 | 243650 | 1725.53 | 606 | 609 | 140.9 |
| C | 3 | 233 | 23028 | 159.17 | 606 | 609 | 140.9 |
| C | 15 | 111 | 17831 | 122.27 | 606 | 609 | 140.9 |
| D | 2 | 16 | 1222107 | 8370.18 | 595 | 577 | 145.9 |
| D | 13 | 138 | 594880 | 4072.29 | 595 | 577 | 145.9 |
| D | 10 | 118 | 143773 | 981.21 | 595 | 577 | 145.9 |
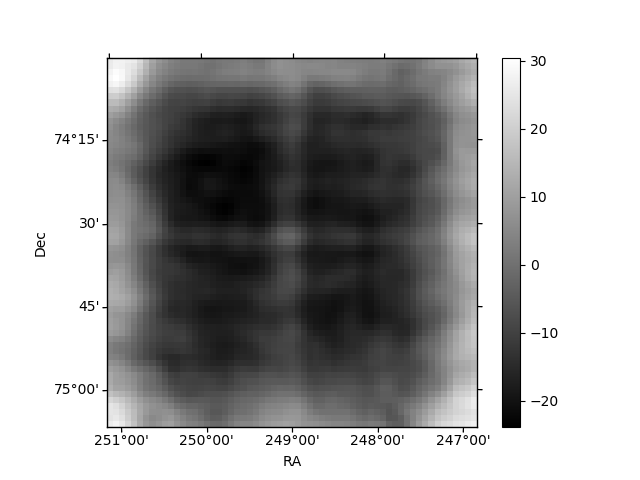
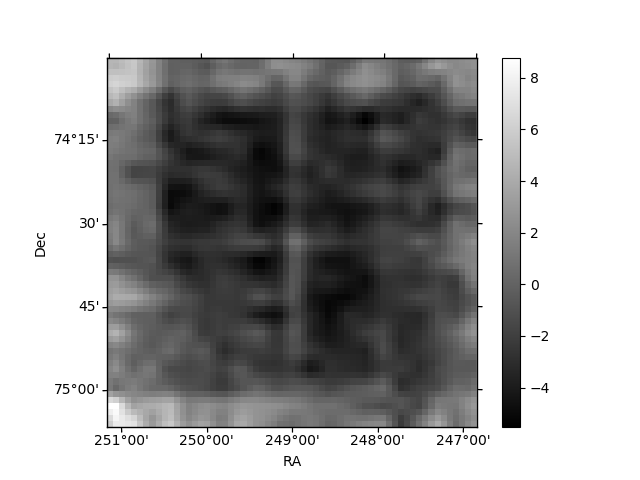
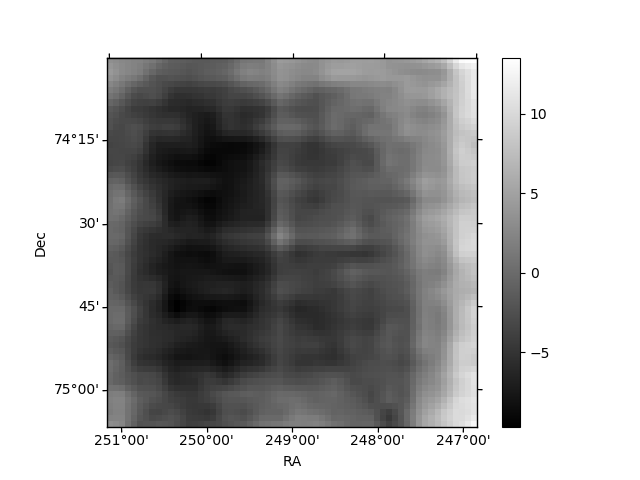
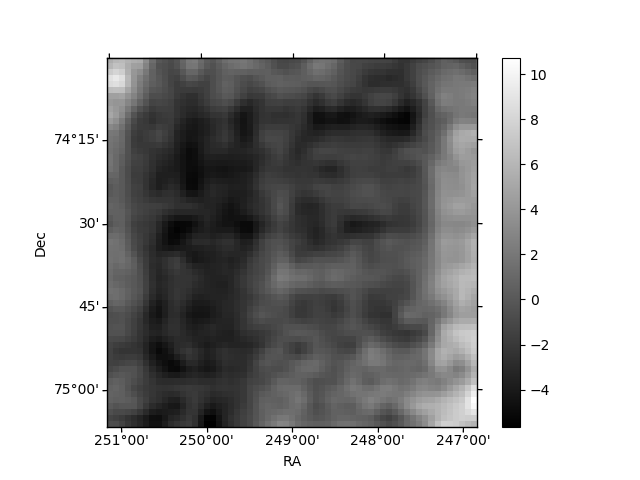
Histogram calculated using DETX and DETY for each event in the final _common_clean file
| Quadrant A | 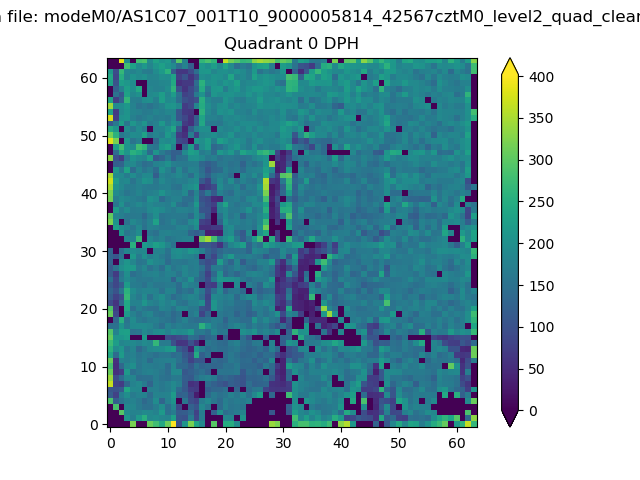 |
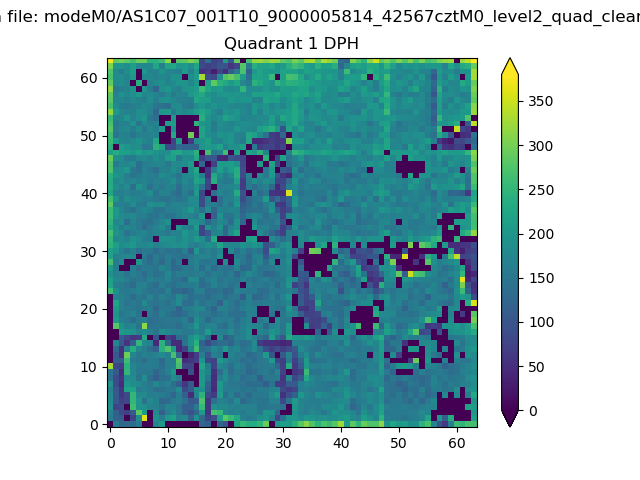 |
Quadrant B |
|---|---|---|---|
| Quadrant D | 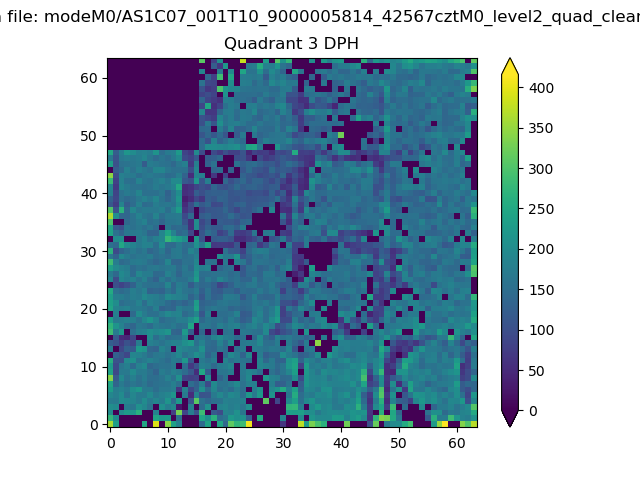 |
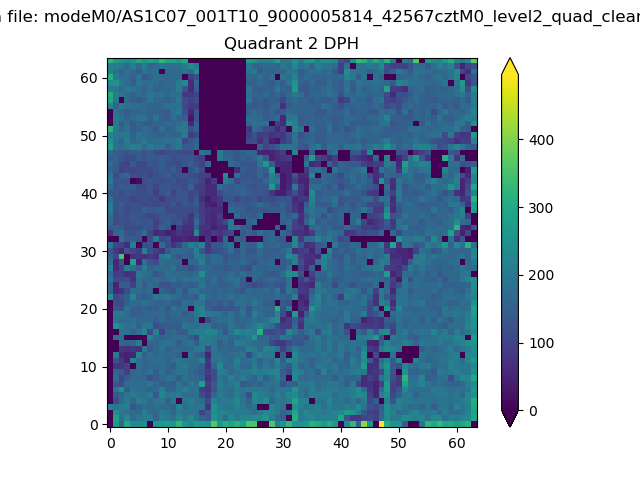 |
Quadrant C |
| Plot type | Count rate plots | Images |
|---|---|---|
| Comparison with Poisson distribution Blue bars denote a histogram of data divided into 1 sec bins. Red curve is a Poisson curve with rate = median count rate of data. |
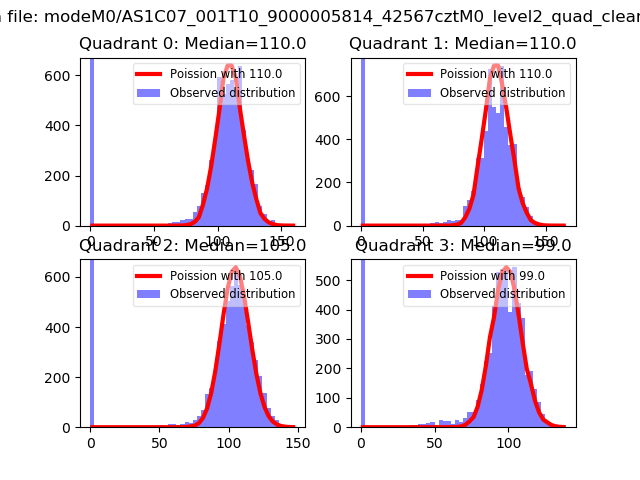 |
 |
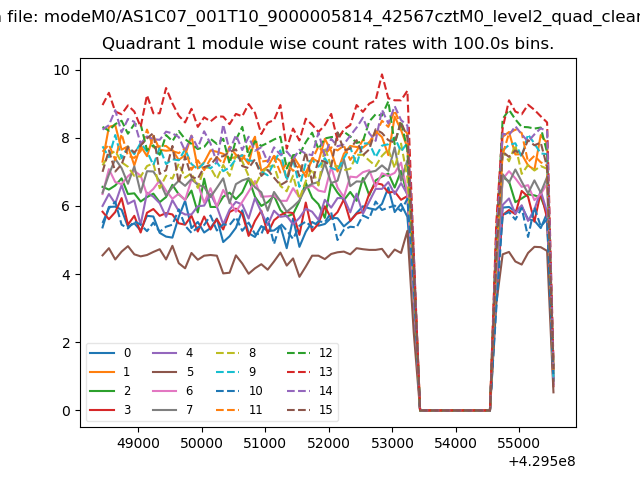
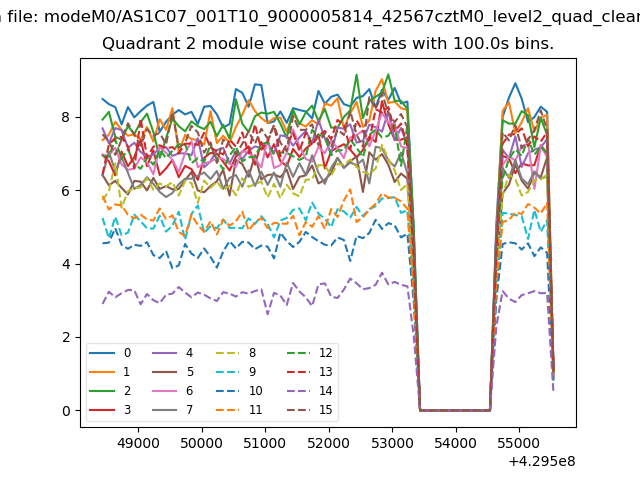
| Quadrant-wise count rates Data is divided into 100 sec bins |
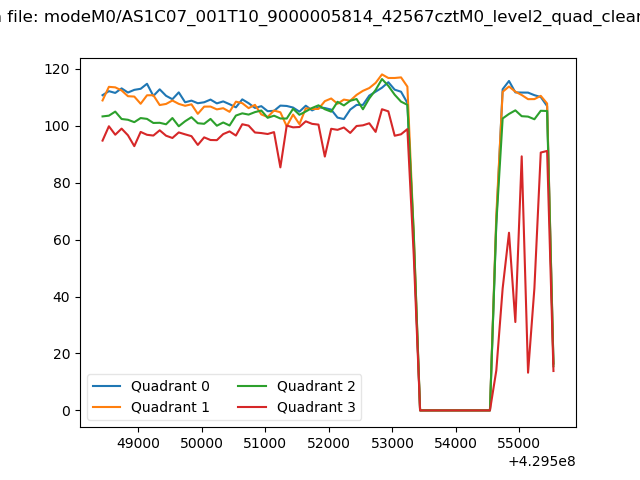 |
|
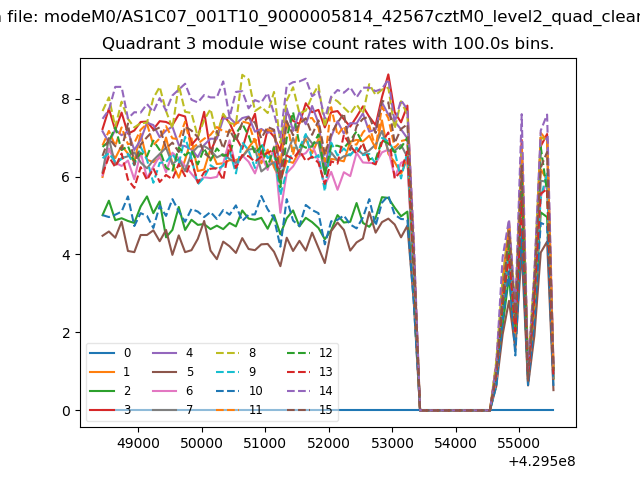
| Module-wise count rates for Quadrant A Data is divided into 100 sec bins |
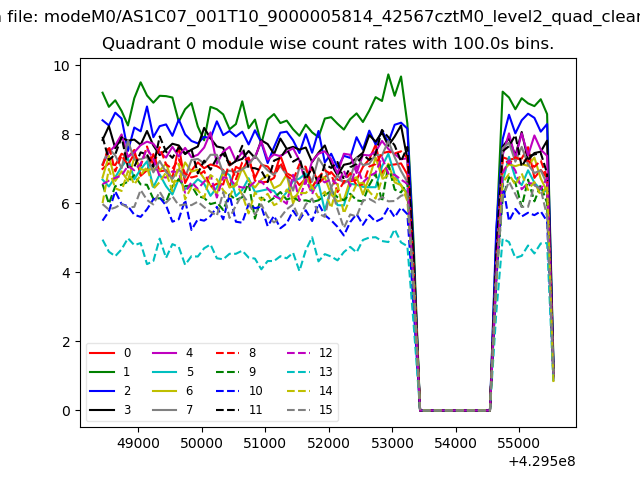 |
 |
| Module-wise count rates for Quadrant B Data is divided into 100 sec bins |
 |
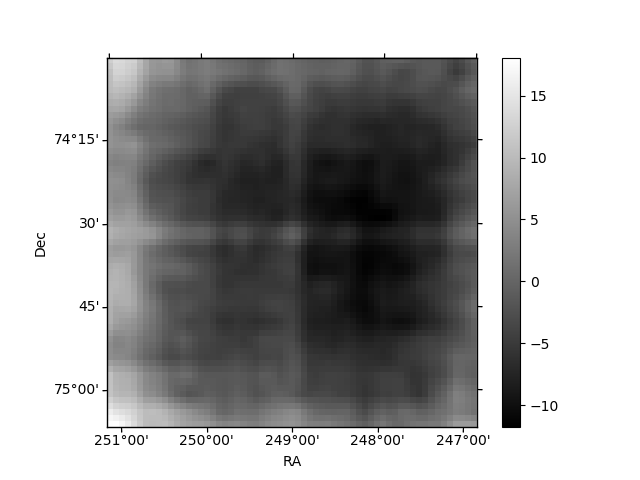 |
| Module-wise count rates for Quadrant C Data is divided into 100 sec bins |
 |
 |
| Module-wise count rates for Quadrant D Data is divided into 100 sec bins |
 |
 |
| Parameter | Plot |
|---|---|
| CZT HV Monitor | 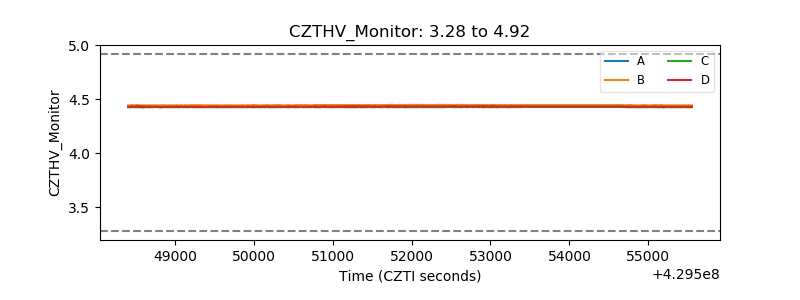 |
| D_VDD | 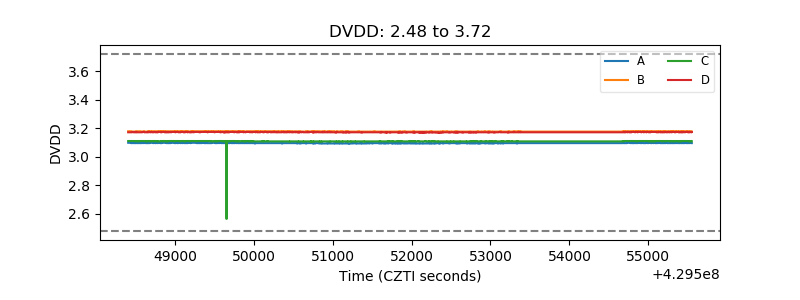 |
| Temperature 1 | 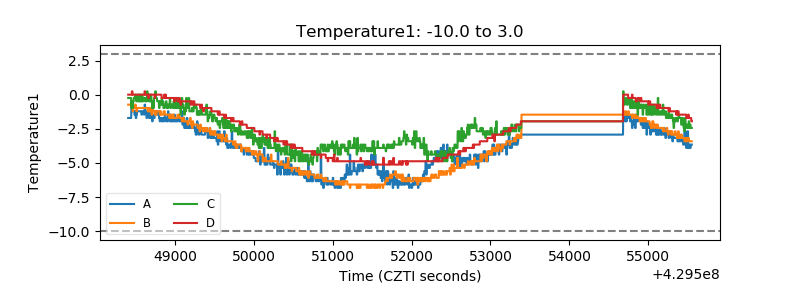 |
| Veto HV Monitor | 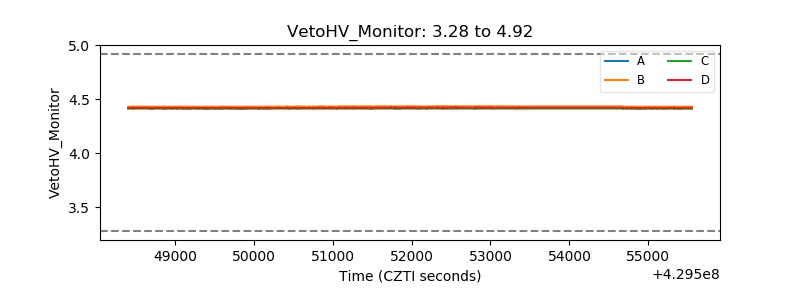 |
| Veto LLD | 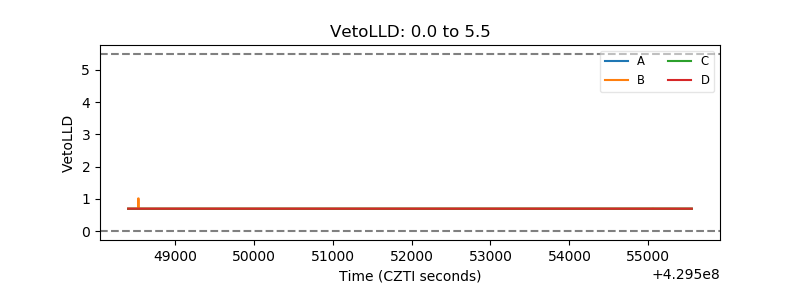 |
| Alpha Counter | 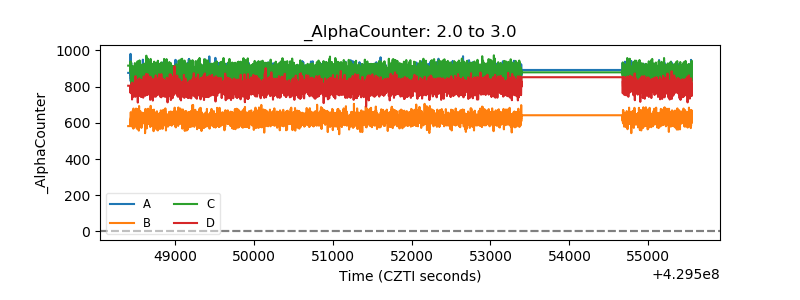 |
| _CPM_Rate | 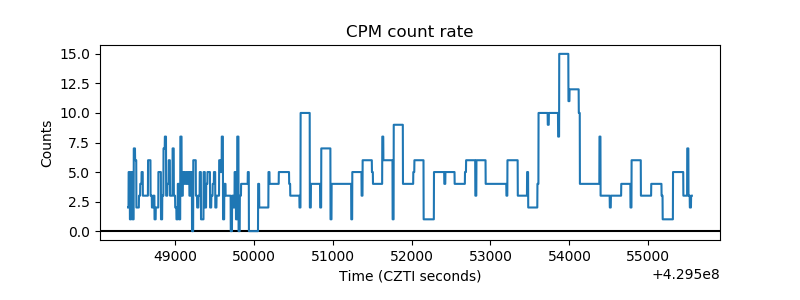 |
| CZT Counter | 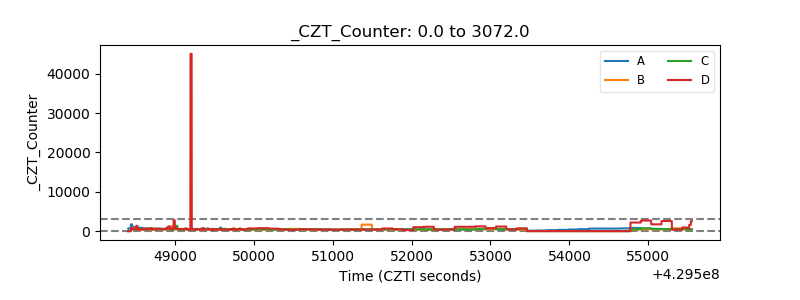 |
| +2.5 Volts monitor | 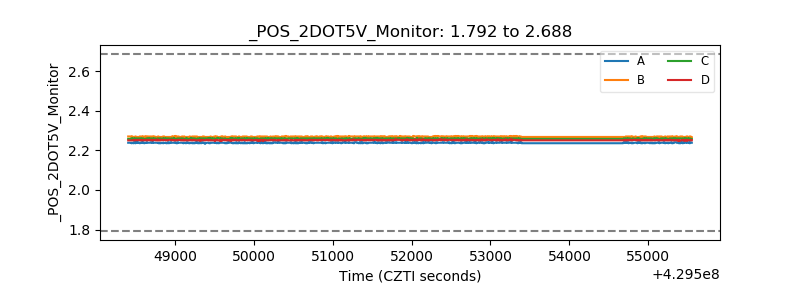 |
| +5 Volts monitor | 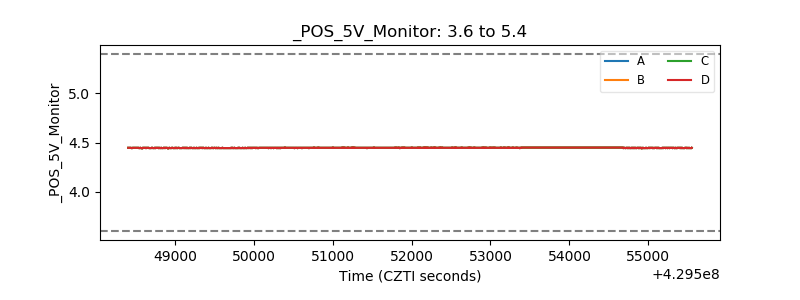 |
| _ROLL_ROT | 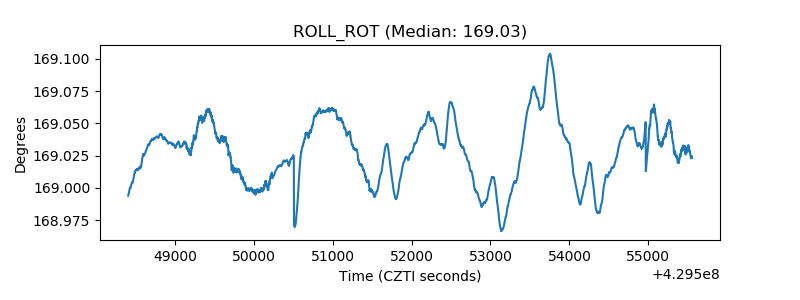 |
| _Roll_DEC | 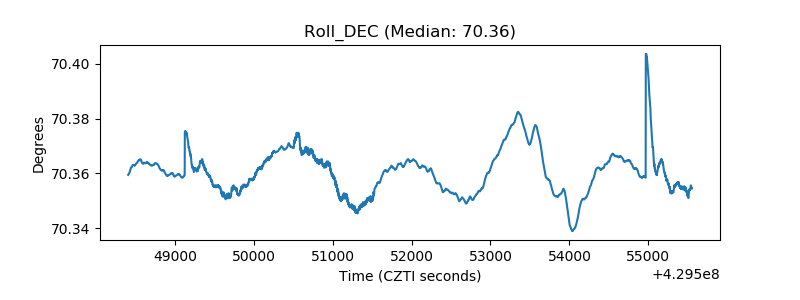 |
| _Roll_RA | 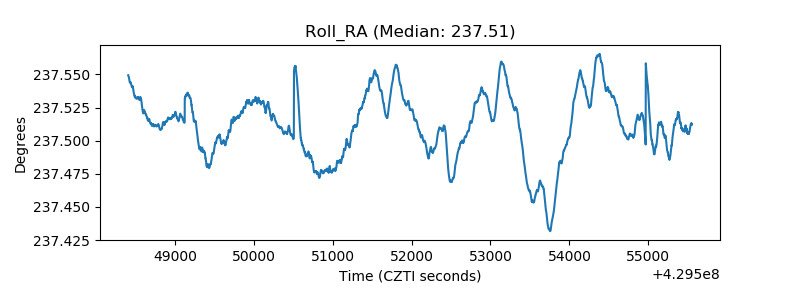 |
| Veto Counter | 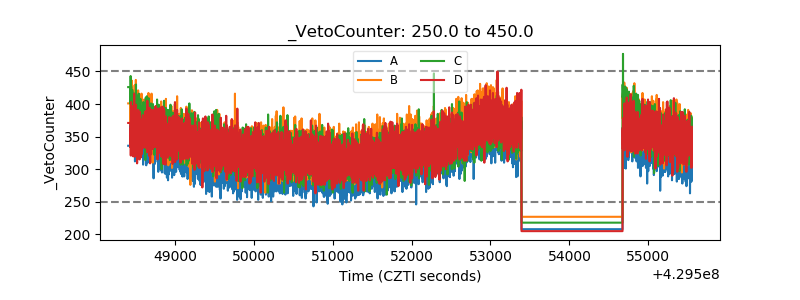 |