| Param | Original file | Final file |
|---|---|---|
| Filename | modeM0/AS1C07_001T10_9000005814_42569cztM0_level2.fits | modeM0/AS1C07_001T10_9000005814_42569cztM0_level2_quad_clean.evt |
| Size (bytes) | 660,568,320 | 168,488,640 |
| Size | 630.0 MB | 160.7 MB |
| Events in quadrant A | 5,686,814 | 1,137,200 |
| Events in quadrant B | 4,806,330 | 1,143,191 |
| Events in quadrant C | 4,942,650 | 1,108,698 |
| Events in quadrant D | 8,188,250 | 973,302 |
| Mode M0 | |||
|---|---|---|---|
| Quadrant | BADHDUFLAG | Total packets | Discarded packets |
| A | 0 | 23598 | 3 |
| B | 0 | 22089 | 3 |
| C | 0 | 21867 | 3 |
| D | 0 | 31829 | 3 |
| Mode M9 | |||
|---|---|---|---|
| Quadrant | BADHDUFLAG | Total packets | Discarded packets |
| A | 0 | 32 | 0 |
| B | 0 | 33 | 0 |
| C | 0 | 33 | 0 |
| D | 0 | 33 | 0 |
| Mode SS | |||
|---|---|---|---|
| Quadrant | BADHDUFLAG | Total packets | Discarded packets |
| A | 0 | 216 | 0 |
| B | 0 | 216 | 0 |
| C | 0 | 216 | 0 |
| D | 0 | 216 | 0 |
| Quadrant | Total seconds | Saturated seconds | Saturation percentage |
|---|---|---|---|
| A | 10673 | 52 | 0.487211% |
| B | 10673 | 59 | 0.552797% |
| C | 10673 | 11 | 0.103064% |
| D | 10673 | 862 | 8.076455% |
Noise dominated data is calculated using 1-second bins in cleaned event files. If a bin has >2000 counts, and if more than 50% of those come from <1% of pixels, then it is considered to be noise-dominated and hence unusable.
| Quadrant | # 1 sec bins | Bins with >0 counts | Bins with >2000 counts | High rate bins dominated by noise | Noise dominated (total time) | Noise dominated (detector-on time) | Marked lightcurve |
|---|---|---|---|---|---|---|---|
| A | 13448 | 10675 | 24 | 24 | 0.18% | 0.22% | 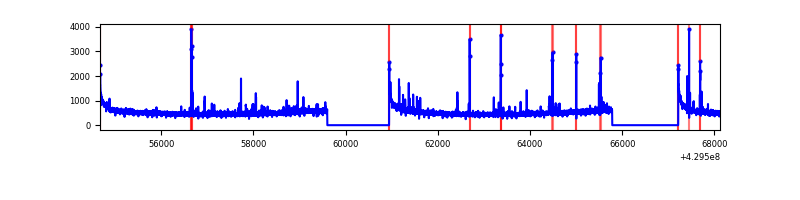 |
| B | 13448 | 10675 | 34 | 34 | 0.25% | 0.32% | 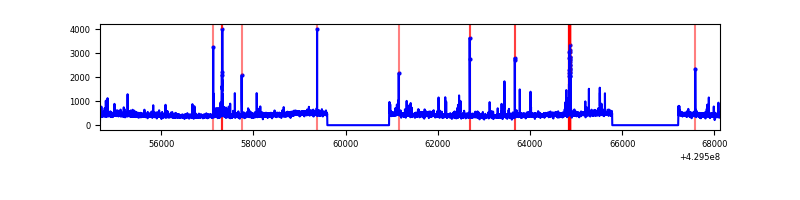 |
| C | 13448 | 10675 | 1 | 1 | 0.01% | 0.01% | 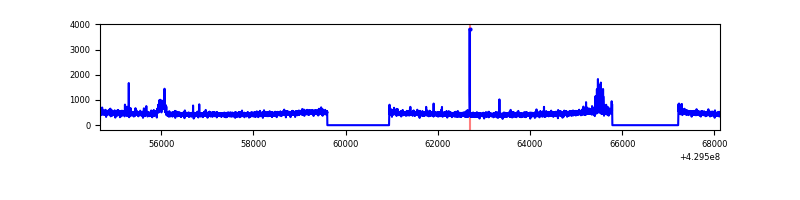 |
| D | 13448 | 10675 | 745 | 745 | 5.54% | 6.98% | 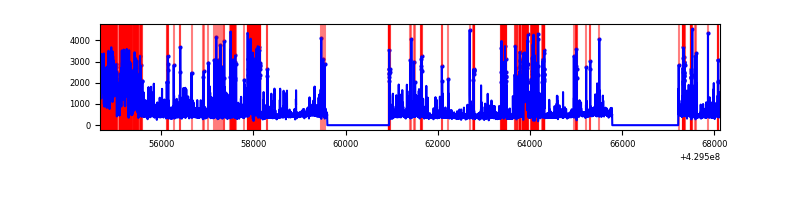 |
Top three noisy pixels from each quadrant. If the there are fewer than three noisy pixels in the level2.evt file, extra rows are filled as -1
| Pixel properties | Quadrant properties | ||||||
|---|---|---|---|---|---|---|---|
| Quadrant | DetID | PixID | Counts | Sigma | Mean | Median | Sigma |
| A | 10 | 83 | 1070937 | 4592.2 | 1139 | 1115 | 233.0 |
| A | 2 | 79 | 122584 | 521.4 | 1139 | 1115 | 233.0 |
| A | 15 | 237 | 38224 | 159.29 | 1139 | 1115 | 233.0 |
| B | 5 | 172 | 170103 | 774.09 | 1131 | 1100 | 218.3 |
| B | 0 | 245 | 110528 | 501.22 | 1131 | 1100 | 218.3 |
| B | 12 | 111 | 27654 | 121.62 | 1131 | 1100 | 218.3 |
| C | 15 | 214 | 438647 | 1692.03 | 1114 | 1119 | 258.6 |
| C | 3 | 233 | 68004 | 258.66 | 1114 | 1119 | 258.6 |
| C | 12 | 175 | 64914 | 246.71 | 1114 | 1119 | 258.6 |
| D | 12 | 6 | 1161268 | 4400.16 | 1086 | 1057 | 263.7 |
| D | 13 | 138 | 994502 | 3767.69 | 1086 | 1057 | 263.7 |
| D | 2 | 16 | 577428 | 2185.92 | 1086 | 1057 | 263.7 |
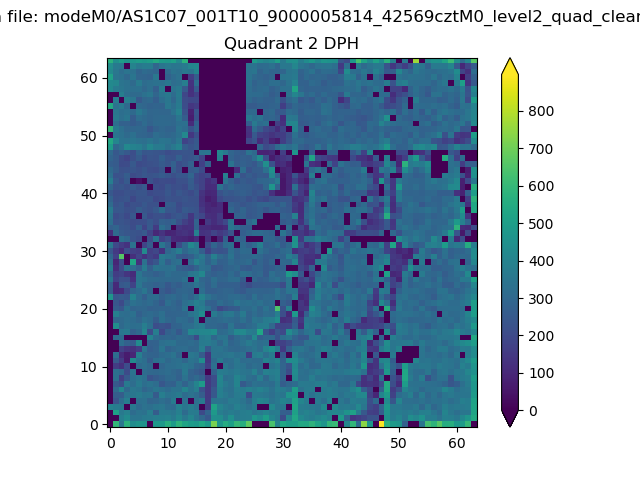
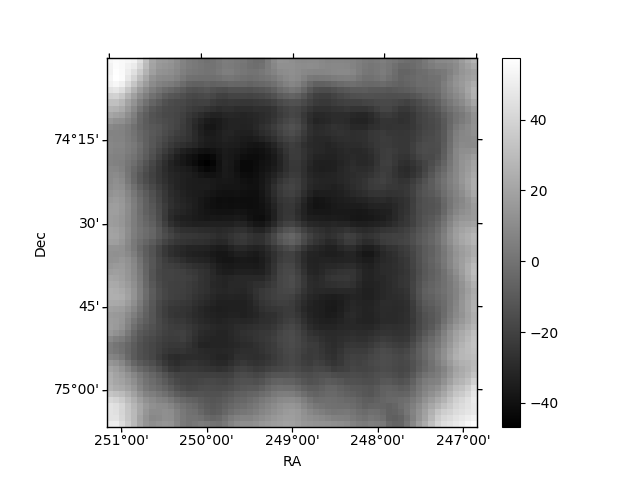
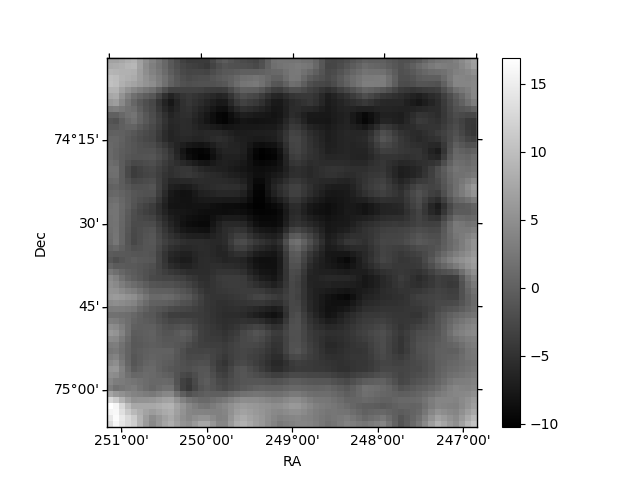
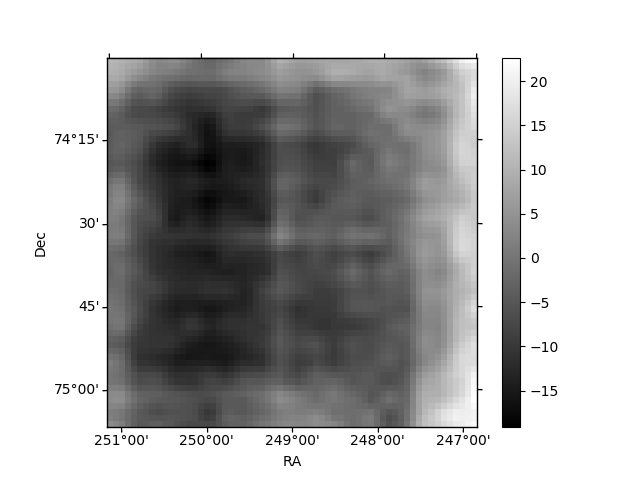
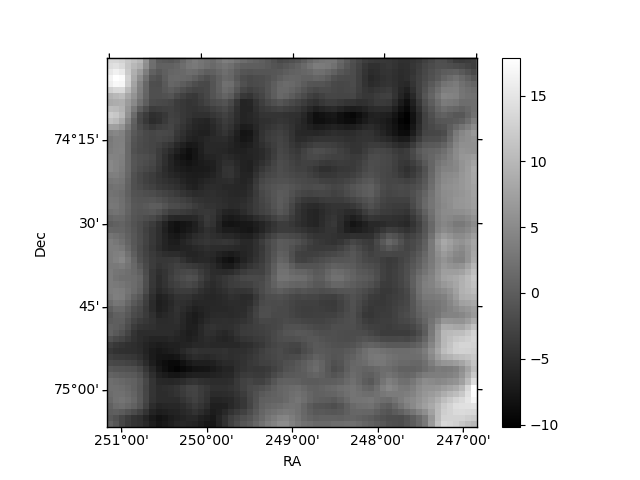
Histogram calculated using DETX and DETY for each event in the final _common_clean file
| Quadrant A | 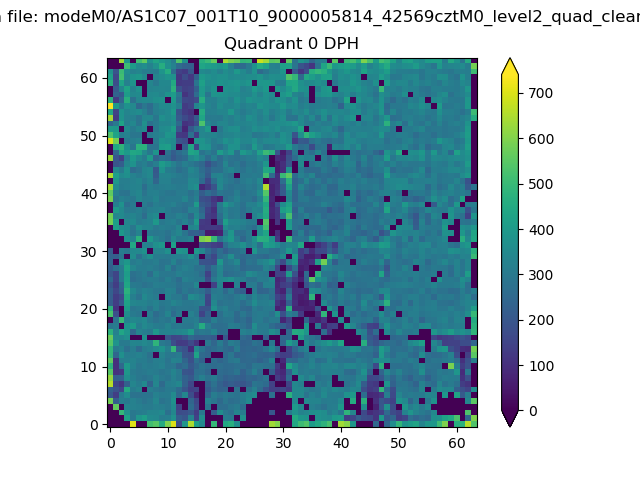 |
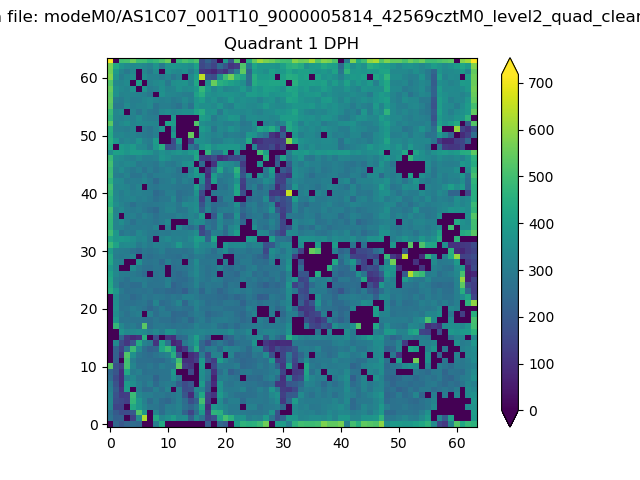 |
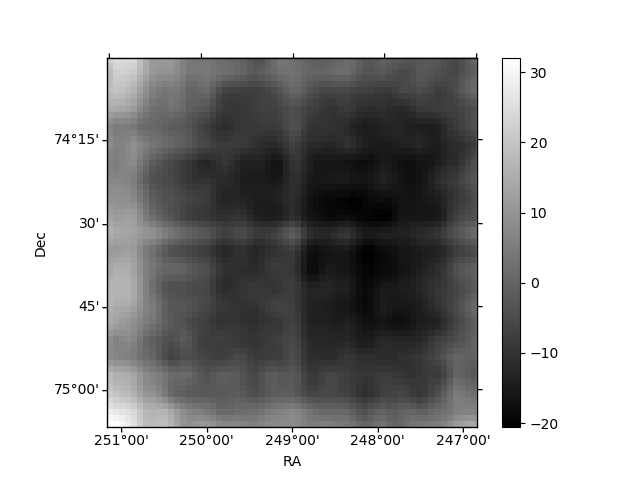
Quadrant B |
|---|---|---|---|
| Quadrant D | 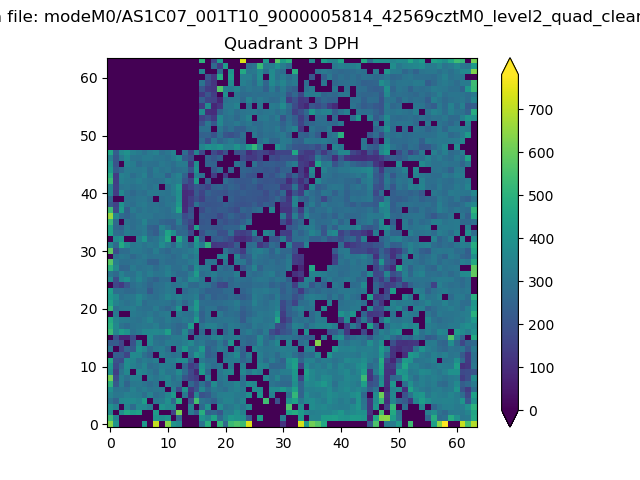 |
 |
Quadrant C |
| Plot type | Count rate plots | Images |
|---|---|---|
| Comparison with Poisson distribution Blue bars denote a histogram of data divided into 1 sec bins. Red curve is a Poisson curve with rate = median count rate of data. |
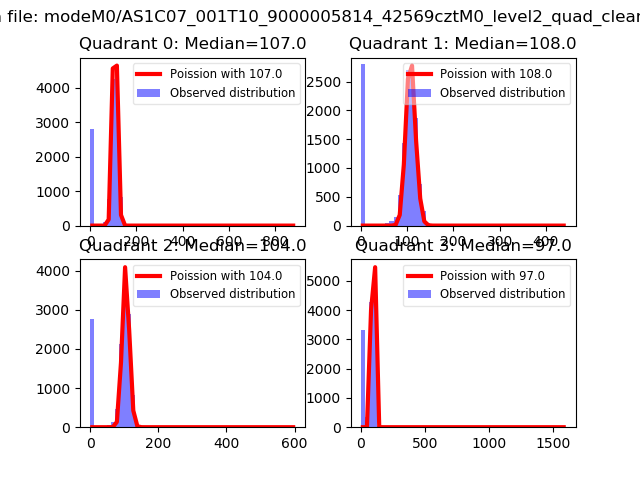 |
 |
| Quadrant-wise count rates Data is divided into 100 sec bins |
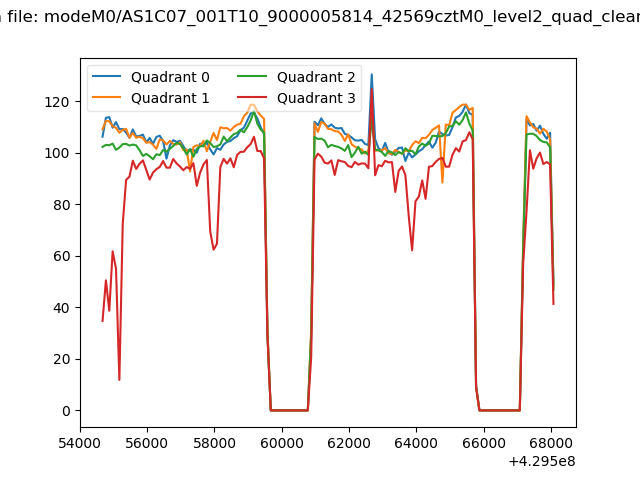 |
|
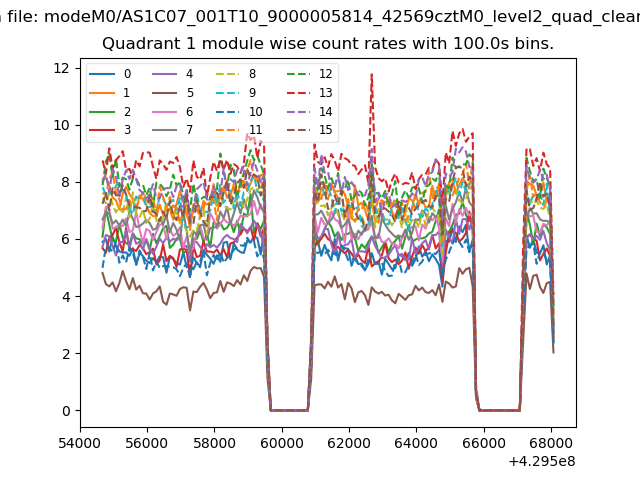
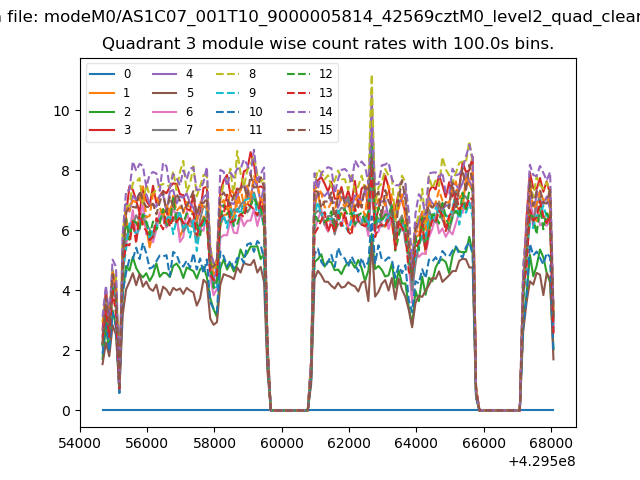
| Module-wise count rates for Quadrant A Data is divided into 100 sec bins |
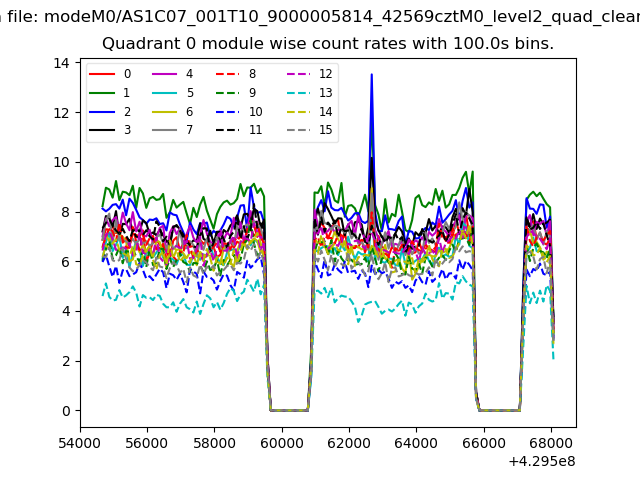 |
 |
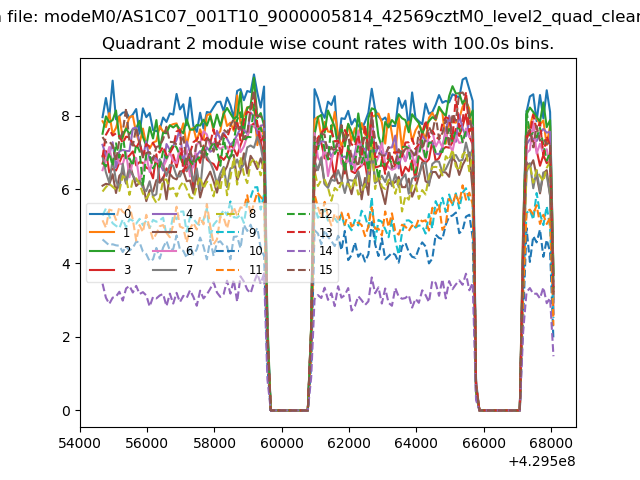
| Module-wise count rates for Quadrant B Data is divided into 100 sec bins |
 |
 |
| Module-wise count rates for Quadrant C Data is divided into 100 sec bins |
 |
 |
| Module-wise count rates for Quadrant D Data is divided into 100 sec bins |
 |
 |
| Parameter | Plot |
|---|---|
| CZT HV Monitor | 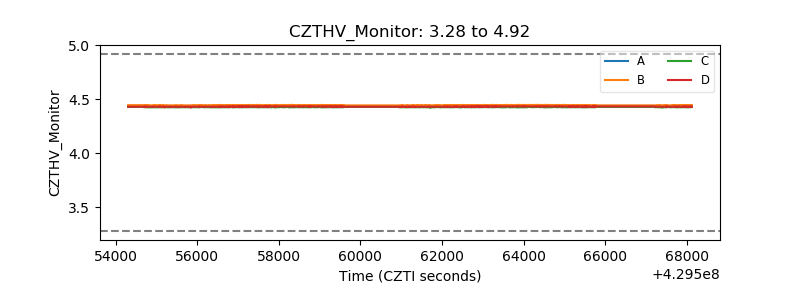 |
| D_VDD | 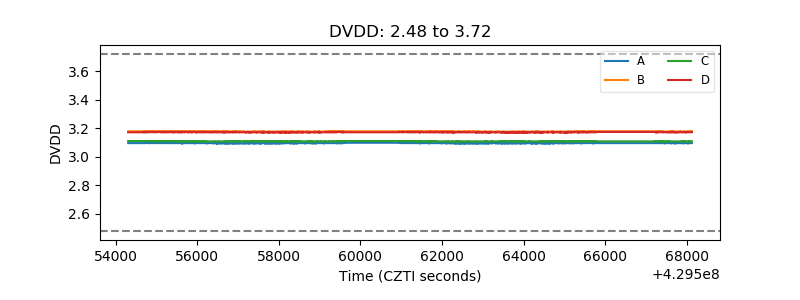 |
| Temperature 1 | 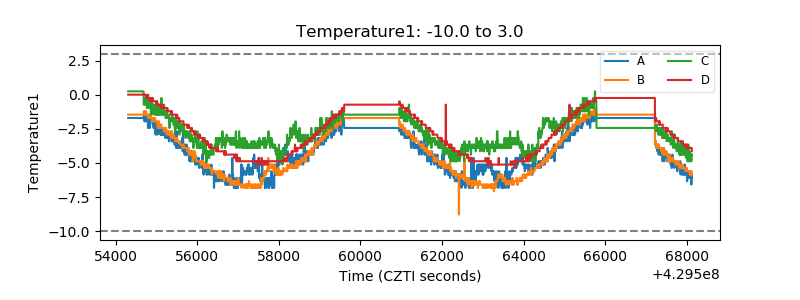 |
| Veto HV Monitor | 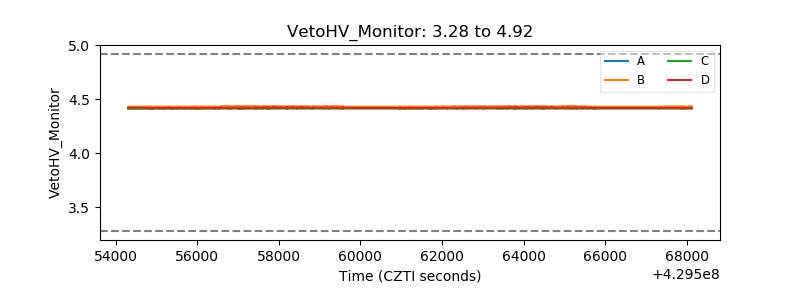 |
| Veto LLD | 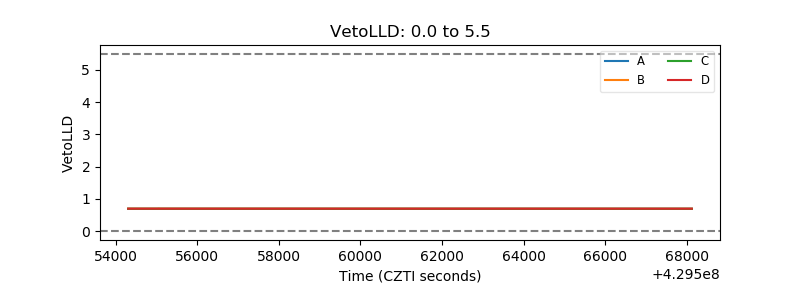 |
| Alpha Counter | 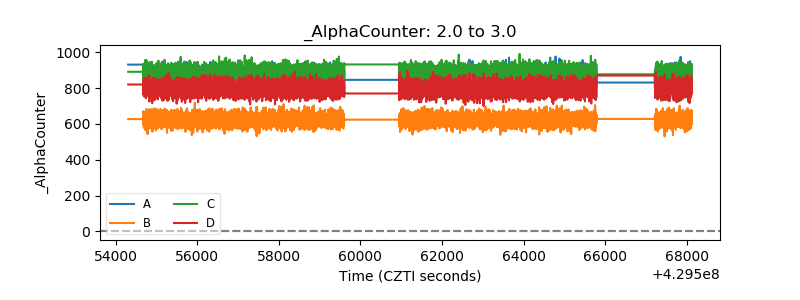 |
| _CPM_Rate | 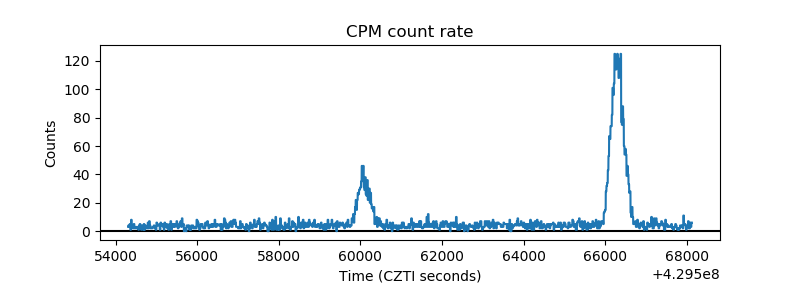 |
| CZT Counter | 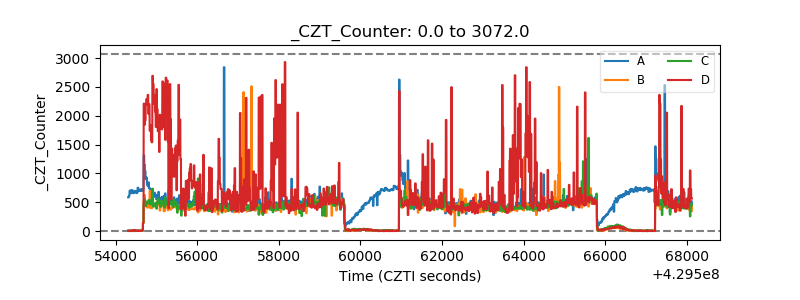 |
| +2.5 Volts monitor | 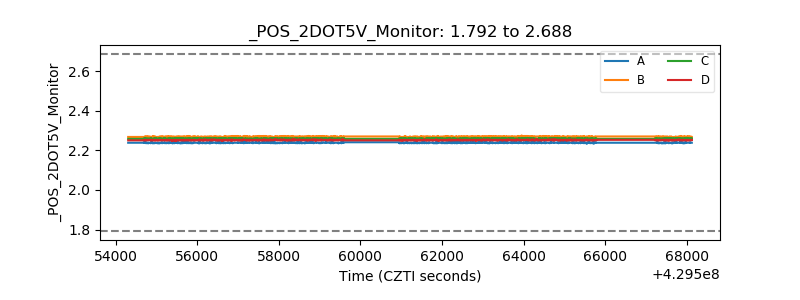 |
| +5 Volts monitor | 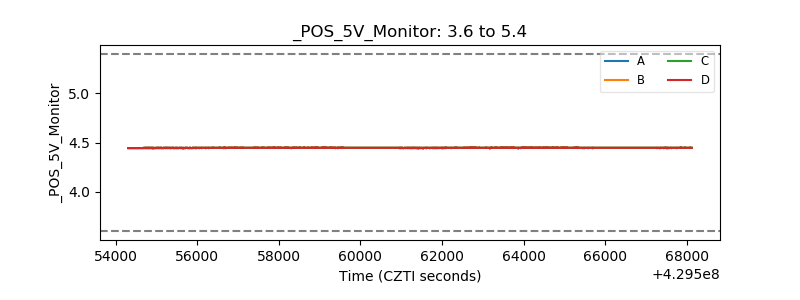 |
| _ROLL_ROT | 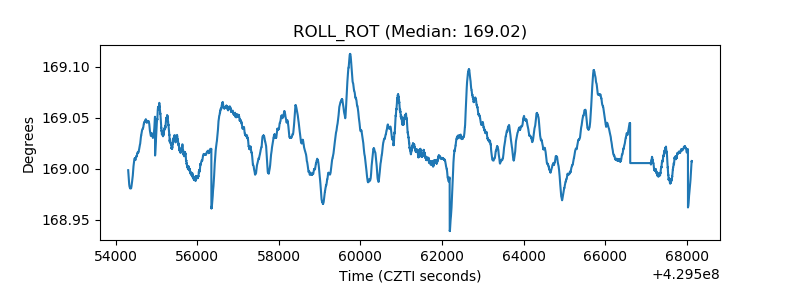 |
| _Roll_DEC | 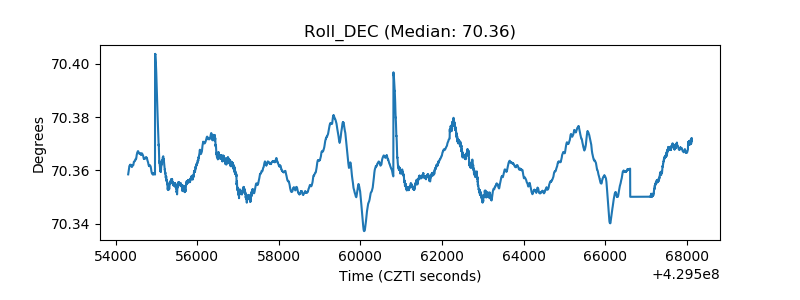 |
| _Roll_RA | 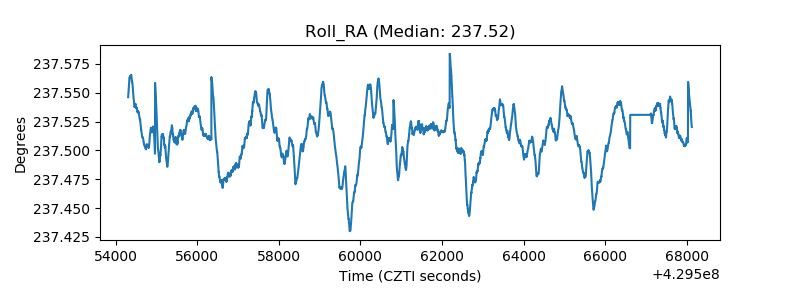 |
| Veto Counter | 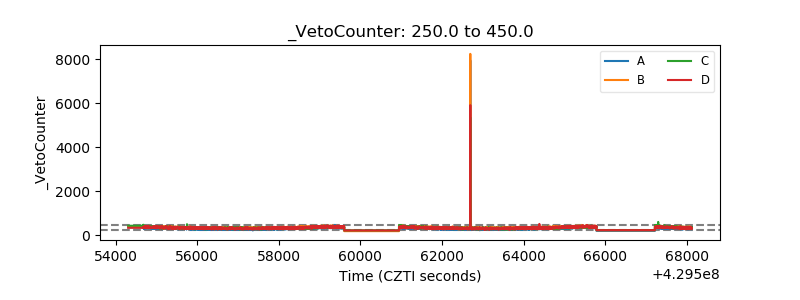 |