| Param | Original file | Final file |
|---|---|---|
| Filename | modeM0/AS1C07_001T10_9000005814_42570cztM0_level2.fits | modeM0/AS1C07_001T10_9000005814_42570cztM0_level2_quad_clean.evt |
| Size (bytes) | 319,443,840 | 91,679,040 |
| Size | 304.6 MB | 87.4 MB |
| Events in quadrant A | 3,044,926 | 610,221 |
| Events in quadrant B | 2,480,743 | 616,844 |
| Events in quadrant C | 2,628,694 | 599,696 |
| Events in quadrant D | 3,227,016 | 551,460 |
| Mode M0 | |||
|---|---|---|---|
| Quadrant | BADHDUFLAG | Total packets | Discarded packets |
| A | 0 | 12717 | 2 |
| B | 0 | 11636 | 2 |
| C | 0 | 11629 | 2 |
| D | 0 | 13715 | 2 |
| Mode M9 | |||
|---|---|---|---|
| Quadrant | BADHDUFLAG | Total packets | Discarded packets |
| A | 0 | 26 | 0 |
| B | 0 | 27 | 0 |
| C | 0 | 27 | 0 |
| D | 0 | 27 | 0 |
| Mode SS | |||
|---|---|---|---|
| Quadrant | BADHDUFLAG | Total packets | Discarded packets |
| A | 0 | 116 | 0 |
| B | 0 | 116 | 0 |
| C | 0 | 116 | 0 |
| D | 0 | 116 | 0 |
| Quadrant | Total seconds | Saturated seconds | Saturation percentage |
|---|---|---|---|
| A | 5686 | 26 | 0.457263% |
| B | 5686 | 16 | 0.281393% |
| C | 5686 | 15 | 0.263806% |
| D | 5686 | 144 | 2.532536% |
Noise dominated data is calculated using 1-second bins in cleaned event files. If a bin has >2000 counts, and if more than 50% of those come from <1% of pixels, then it is considered to be noise-dominated and hence unusable.
| Quadrant | # 1 sec bins | Bins with >0 counts | Bins with >2000 counts | High rate bins dominated by noise | Noise dominated (total time) | Noise dominated (detector-on time) | Marked lightcurve |
|---|---|---|---|---|---|---|---|
| A | 7239 | 5687 | 18 | 18 | 0.25% | 0.32% | 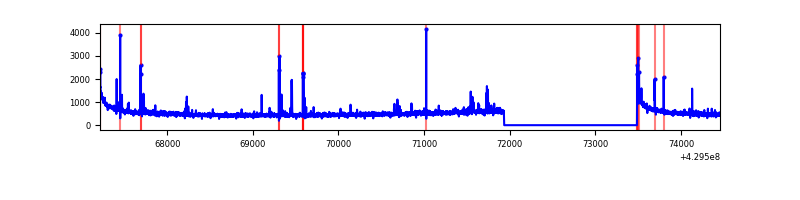 |
| B | 7239 | 5687 | 7 | 7 | 0.10% | 0.12% | 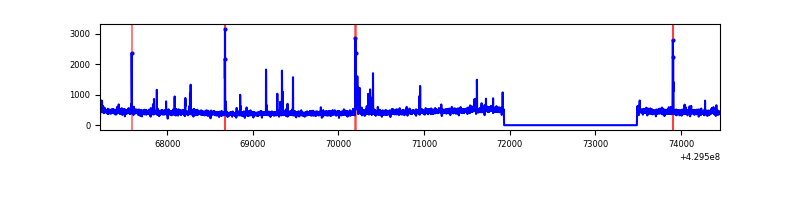 |
| C | 7239 | 5687 | 9 | 9 | 0.12% | 0.16% | 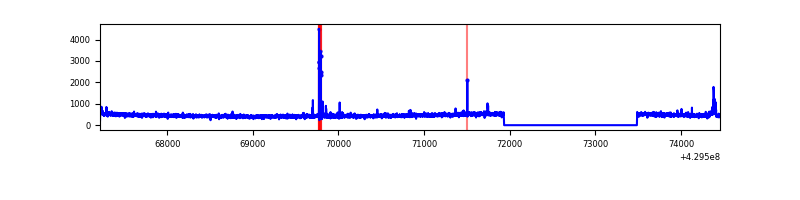 |
| D | 7239 | 5687 | 122 | 122 | 1.69% | 2.15% | 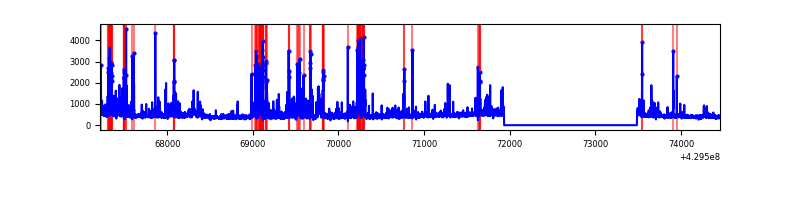 |
Top three noisy pixels from each quadrant. If the there are fewer than three noisy pixels in the level2.evt file, extra rows are filled as -1
| Pixel properties | Quadrant properties | ||||||
|---|---|---|---|---|---|---|---|
| Quadrant | DetID | PixID | Counts | Sigma | Mean | Median | Sigma |
| A | 10 | 83 | 581776 | 4681.29 | 604 | 591 | 124.2 |
| A | 2 | 79 | 74910 | 598.62 | 604 | 591 | 124.2 |
| A | 13 | 248 | 16856 | 131.01 | 604 | 591 | 124.2 |
| B | 5 | 172 | 61960 | 528.79 | 600 | 583 | 116.1 |
| B | 0 | 245 | 22444 | 188.34 | 600 | 583 | 116.1 |
| B | 12 | 111 | 14821 | 122.67 | 600 | 583 | 116.1 |
| C | 15 | 214 | 233550 | 1680.46 | 592 | 595 | 138.6 |
| C | 9 | 54 | 30911 | 218.69 | 592 | 595 | 138.6 |
| C | 5 | 250 | 28957 | 204.59 | 592 | 595 | 138.6 |
| D | 12 | 6 | 255002 | 1755.65 | 588 | 569 | 144.9 |
| D | 1 | 52 | 248203 | 1708.74 | 588 | 569 | 144.9 |
| D | 13 | 249 | 160589 | 1104.18 | 588 | 569 | 144.9 |
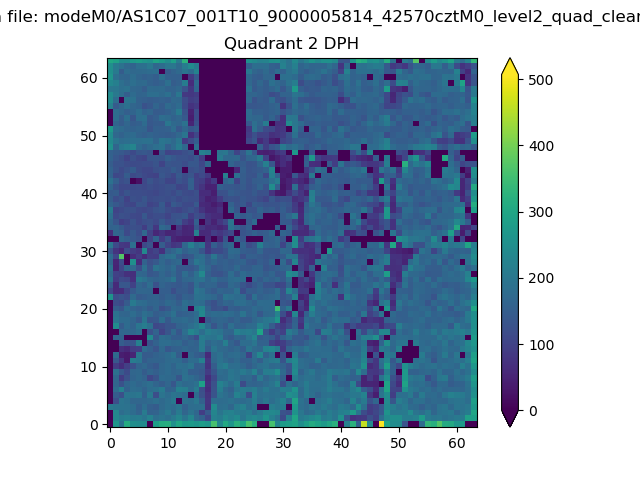
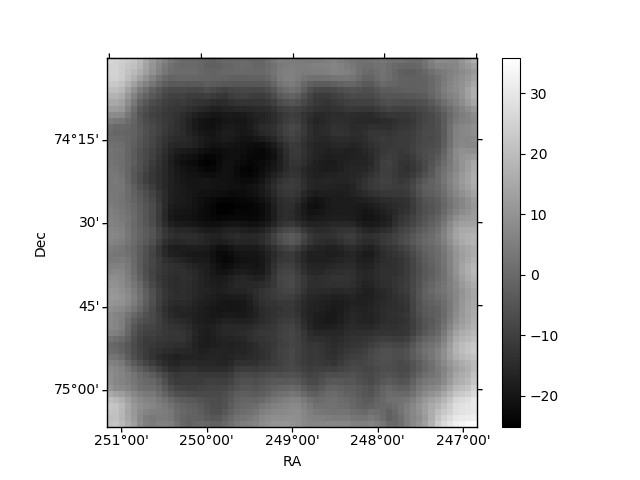
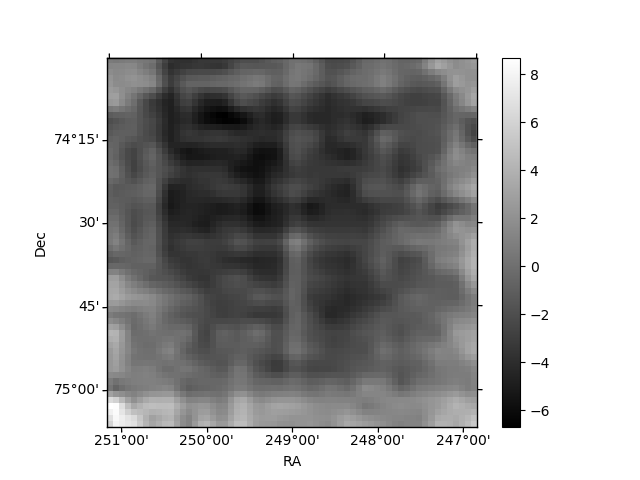
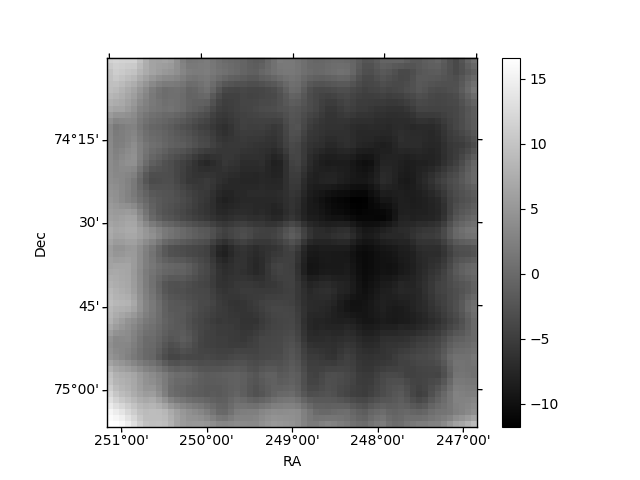
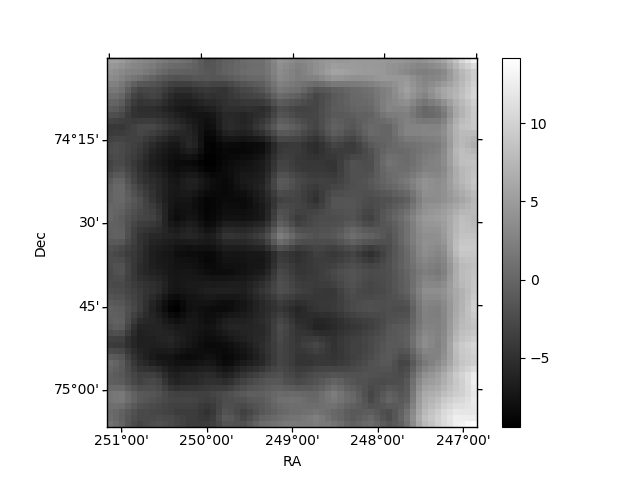
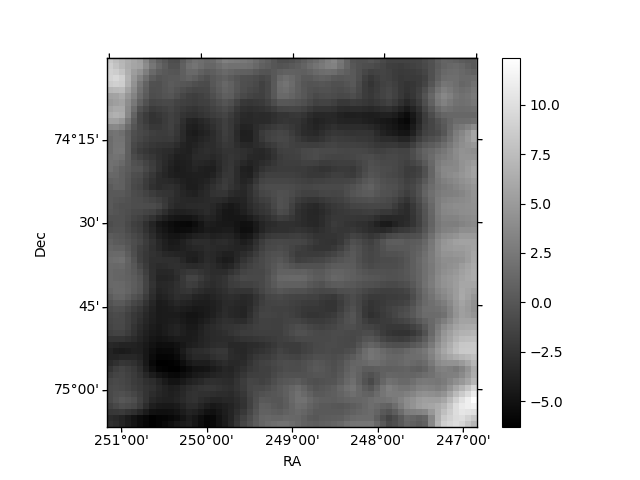
Histogram calculated using DETX and DETY for each event in the final _common_clean file
| Quadrant A | 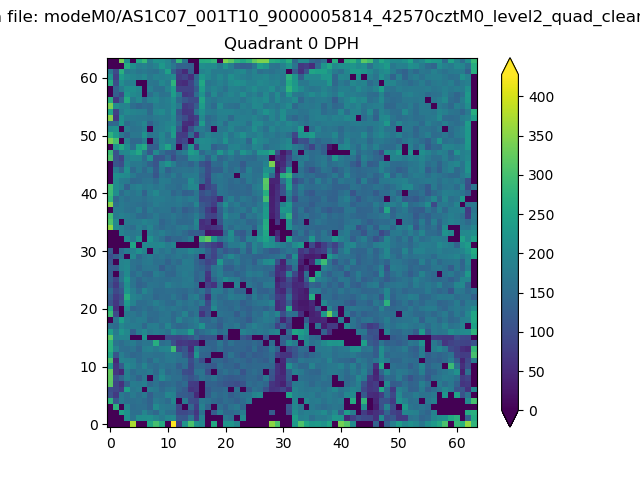 |
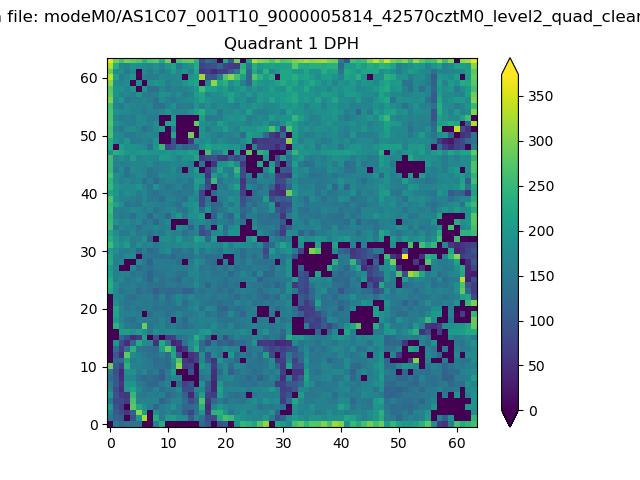 |
Quadrant B |
|---|---|---|---|
| Quadrant D | 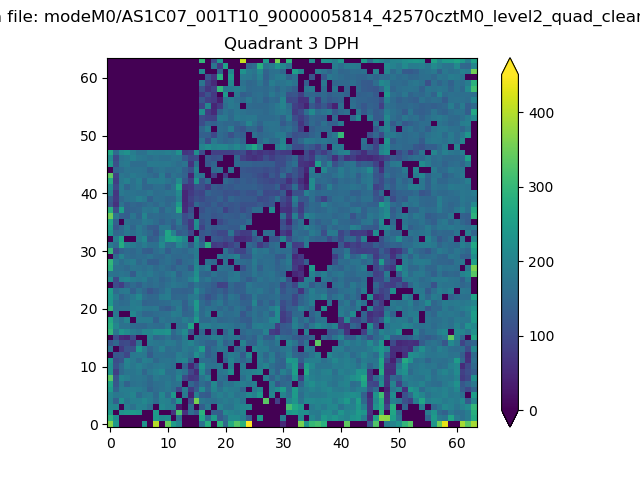 |
 |
Quadrant C |
| Plot type | Count rate plots | Images |
|---|---|---|
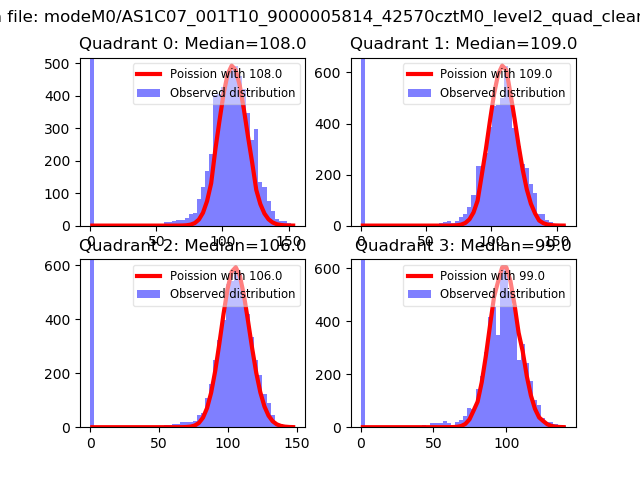
| Comparison with Poisson distribution Blue bars denote a histogram of data divided into 1 sec bins. Red curve is a Poisson curve with rate = median count rate of data. |
 |
 |
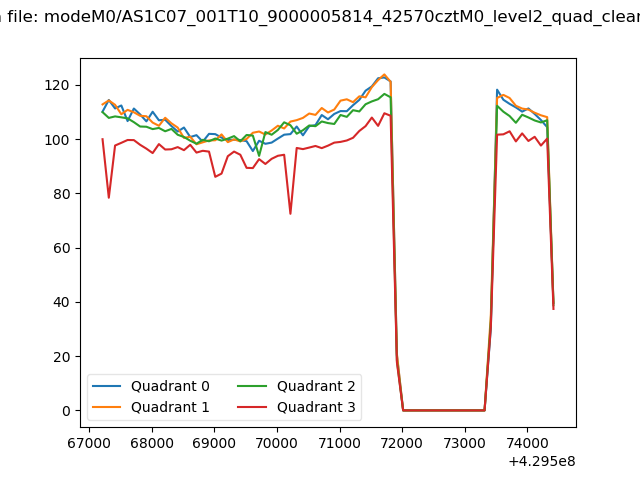
| Quadrant-wise count rates Data is divided into 100 sec bins |
 |
|
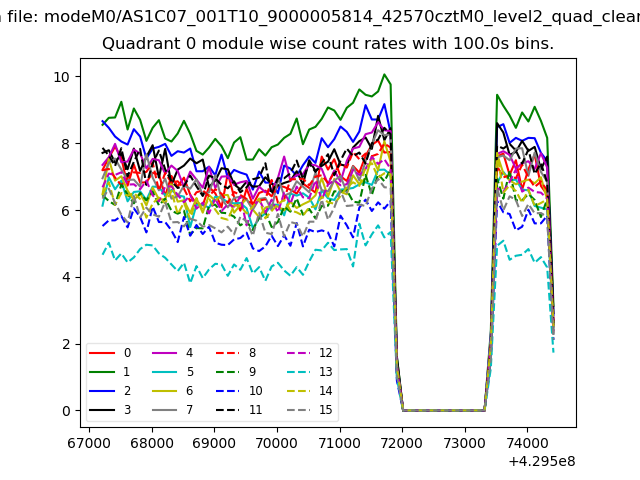
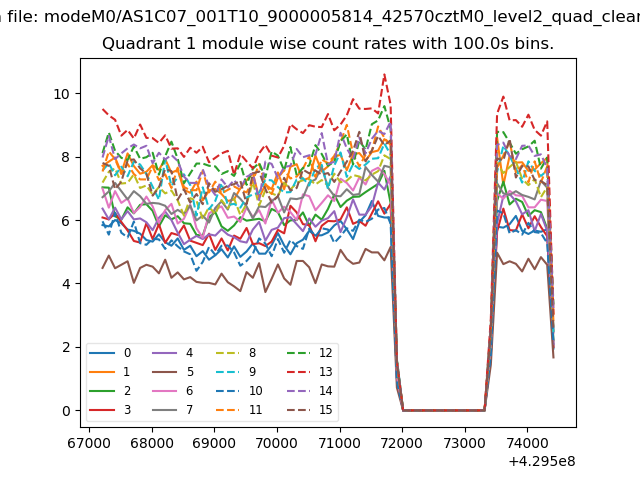
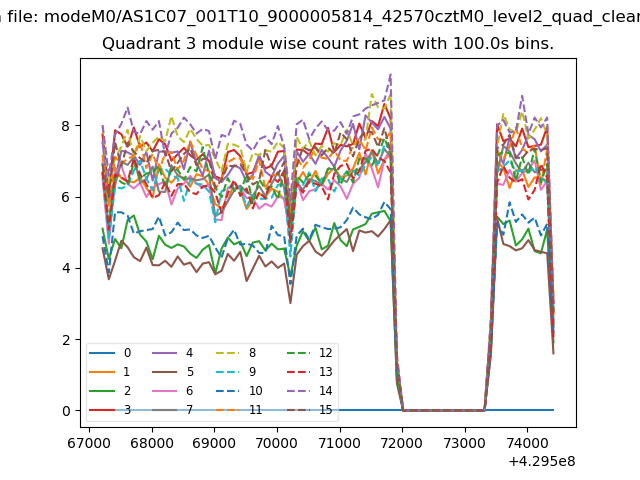
| Module-wise count rates for Quadrant A Data is divided into 100 sec bins |
 |
 |
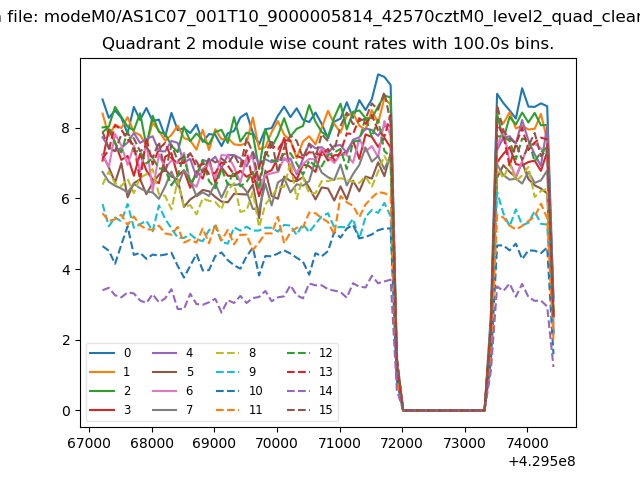
| Module-wise count rates for Quadrant B Data is divided into 100 sec bins |
 |
 |
| Module-wise count rates for Quadrant C Data is divided into 100 sec bins |
 |
 |
| Module-wise count rates for Quadrant D Data is divided into 100 sec bins |
 |
 |
| Parameter | Plot |
|---|---|
| CZT HV Monitor | 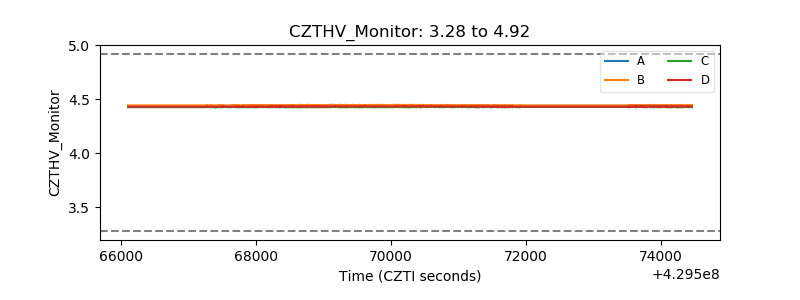 |
| D_VDD | 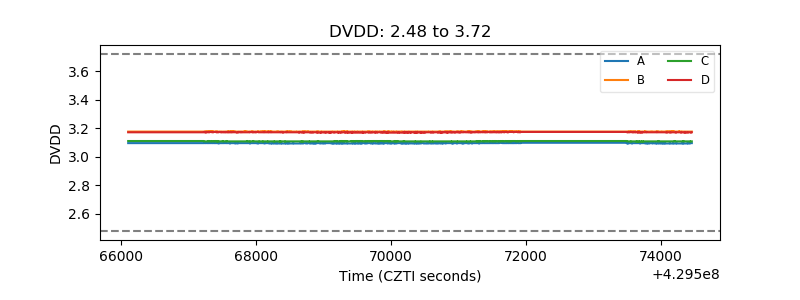 |
| Temperature 1 | 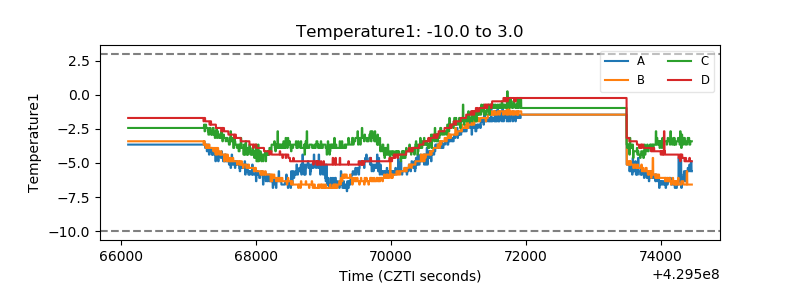 |
| Veto HV Monitor | 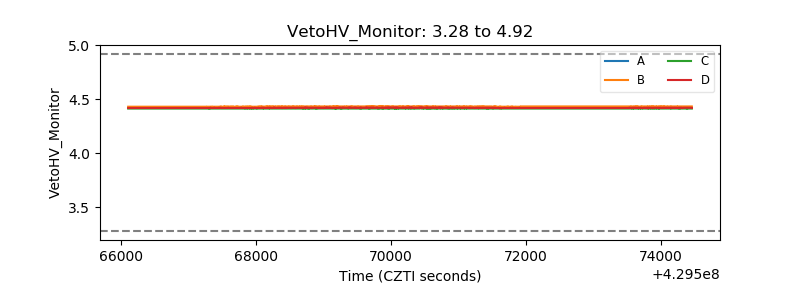 |
| Veto LLD | 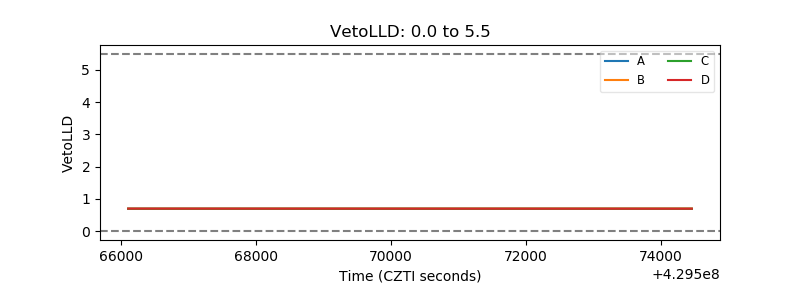 |
| Alpha Counter | 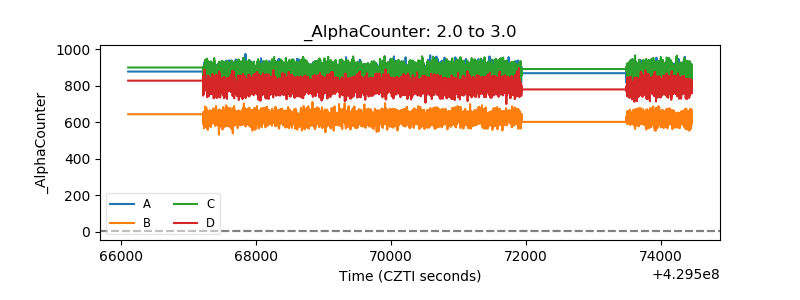 |
| _CPM_Rate | 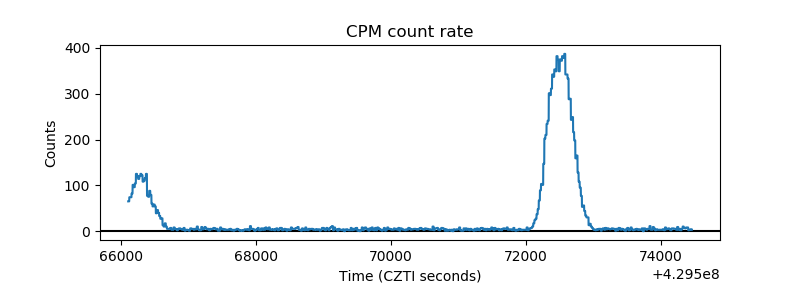 |
| CZT Counter | 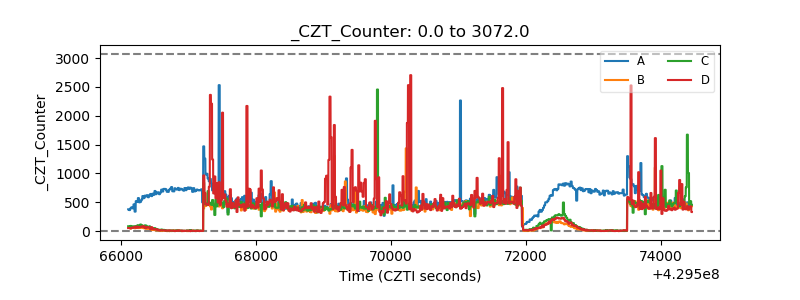 |
| +2.5 Volts monitor | 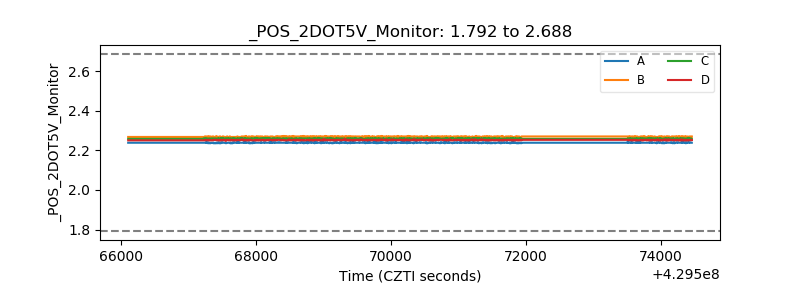 |
| +5 Volts monitor | 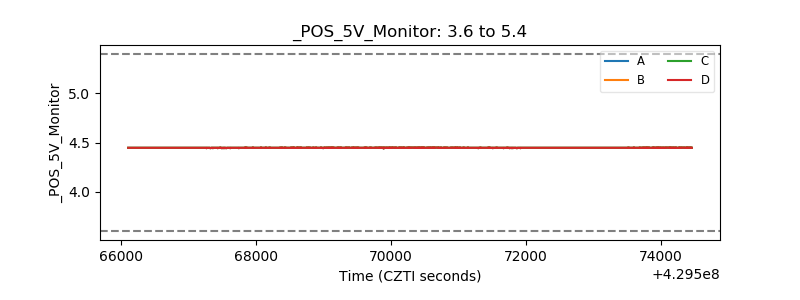 |
| _ROLL_ROT | 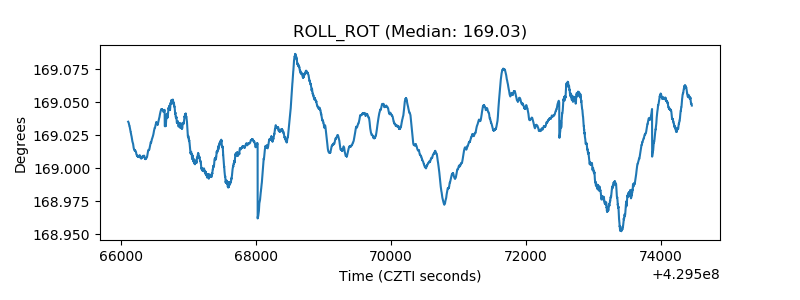 |
| _Roll_DEC | 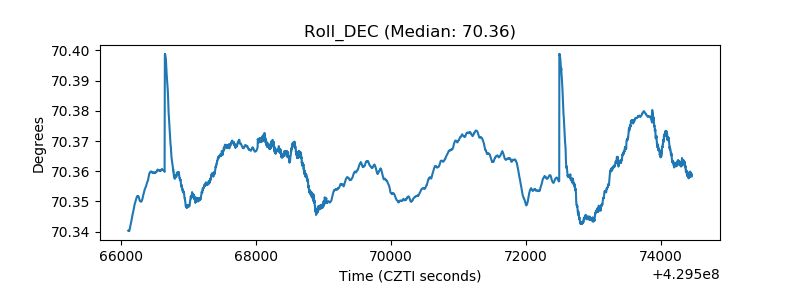 |
| _Roll_RA | 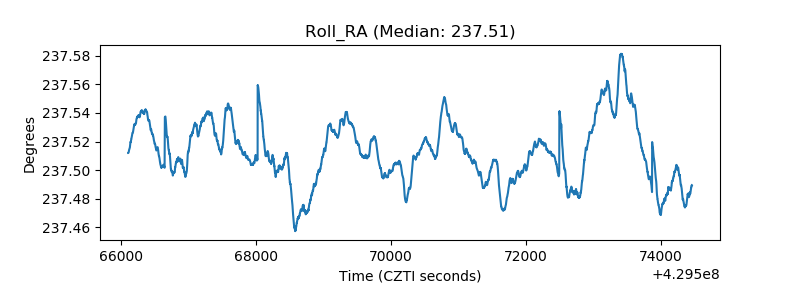 |
| Veto Counter | 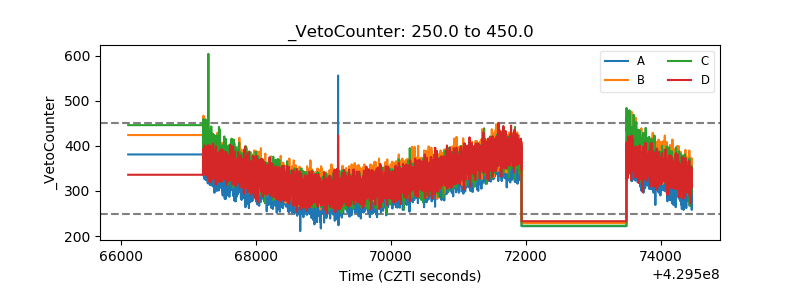 |