| Param | Original file | Final file |
|---|---|---|
| Filename | modeM0/AS1C07_001T10_9000005814_42571cztM0_level2.fits | modeM0/AS1C07_001T10_9000005814_42571cztM0_level2_quad_clean.evt |
| Size (bytes) | 302,918,400 | 87,485,760 |
| Size | 288.9 MB | 83.4 MB |
| Events in quadrant A | 2,877,318 | 584,335 |
| Events in quadrant B | 2,500,316 | 582,283 |
| Events in quadrant C | 2,525,614 | 577,207 |
| Events in quadrant D | 2,888,239 | 526,849 |
| Mode M0 | |||
|---|---|---|---|
| Quadrant | BADHDUFLAG | Total packets | Discarded packets |
| A | 0 | 11972 | 2 |
| B | 0 | 11491 | 2 |
| C | 0 | 11040 | 3 |
| D | 0 | 12666 | 2 |
| Mode M9 | |||
|---|---|---|---|
| Quadrant | BADHDUFLAG | Total packets | Discarded packets |
| A | 0 | 30 | 0 |
| B | 0 | 31 | 0 |
| C | 0 | 31 | 0 |
| D | 0 | 31 | 0 |
| Mode SS | |||
|---|---|---|---|
| Quadrant | BADHDUFLAG | Total packets | Discarded packets |
| A | 0 | 110 | 0 |
| B | 0 | 110 | 0 |
| C | 0 | 110 | 0 |
| D | 0 | 110 | 0 |
| Quadrant | Total seconds | Saturated seconds | Saturation percentage |
|---|---|---|---|
| A | 5404 | 20 | 0.370096% |
| B | 5404 | 89 | 1.646928% |
| C | 5403 | 7 | 0.129558% |
| D | 5403 | 149 | 2.757727% |
Noise dominated data is calculated using 1-second bins in cleaned event files. If a bin has >2000 counts, and if more than 50% of those come from <1% of pixels, then it is considered to be noise-dominated and hence unusable.
| Quadrant | # 1 sec bins | Bins with >0 counts | Bins with >2000 counts | High rate bins dominated by noise | Noise dominated (total time) | Noise dominated (detector-on time) | Marked lightcurve |
|---|---|---|---|---|---|---|---|
| A | 7108 | 5405 | 12 | 12 | 0.17% | 0.22% | 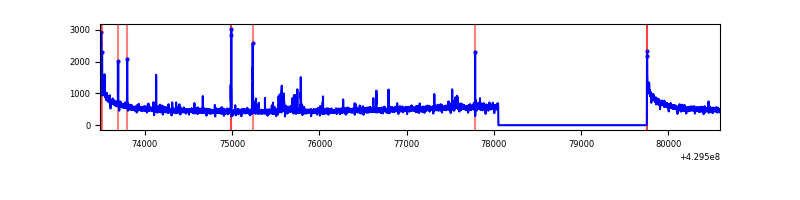 |
| B | 7108 | 5405 | 62 | 62 | 0.87% | 1.15% | 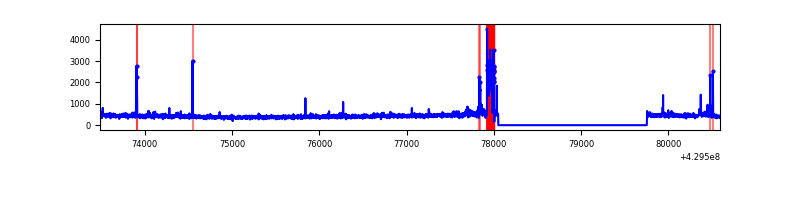 |
| C | 7107 | 5404 | 3 | 3 | 0.04% | 0.06% | 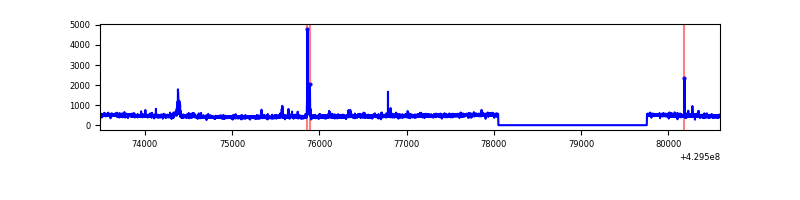 |
| D | 7107 | 5404 | 128 | 128 | 1.80% | 2.37% | 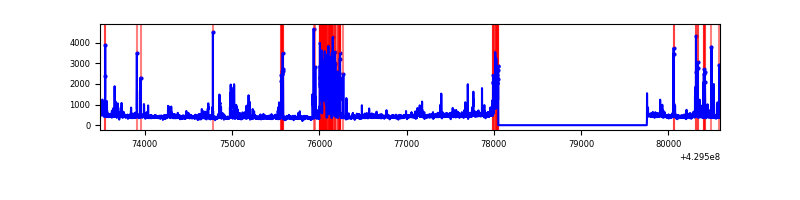 |
Top three noisy pixels from each quadrant. If the there are fewer than three noisy pixels in the level2.evt file, extra rows are filled as -1
| Pixel properties | Quadrant properties | ||||||
|---|---|---|---|---|---|---|---|
| Quadrant | DetID | PixID | Counts | Sigma | Mean | Median | Sigma |
| A | 10 | 83 | 548400 | 4643.6 | 575 | 562 | 118.0 |
| A | 7 | 3 | 37029 | 309.1 | 575 | 562 | 118.0 |
| A | 2 | 79 | 34754 | 289.82 | 575 | 562 | 118.0 |
| B | 0 | 229 | 180025 | 1610.12 | 567 | 550 | 111.5 |
| B | 0 | 245 | 45425 | 402.59 | 567 | 550 | 111.5 |
| B | 5 | 172 | 34152 | 301.45 | 567 | 550 | 111.5 |
| C | 15 | 214 | 225194 | 1700.25 | 562 | 565 | 132.1 |
| C | 14 | 254 | 48345 | 361.65 | 562 | 565 | 132.1 |
| C | 9 | 54 | 43180 | 322.56 | 562 | 565 | 132.1 |
| D | 12 | 6 | 396330 | 2925.42 | 556 | 541 | 135.3 |
| D | 1 | 47 | 92820 | 682.07 | 556 | 541 | 135.3 |
| D | 1 | 52 | 83027 | 609.68 | 556 | 541 | 135.3 |
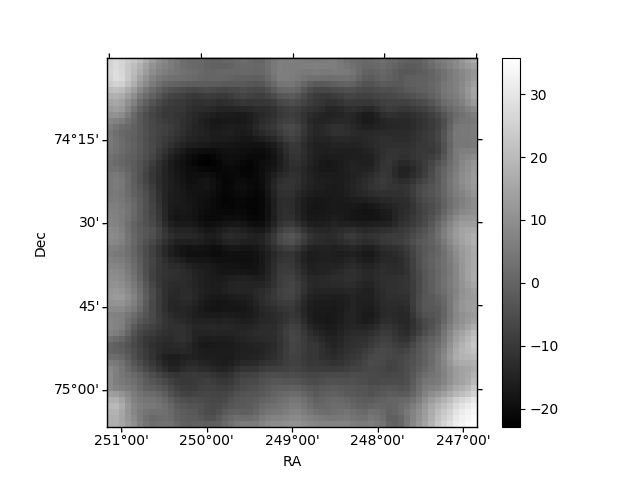
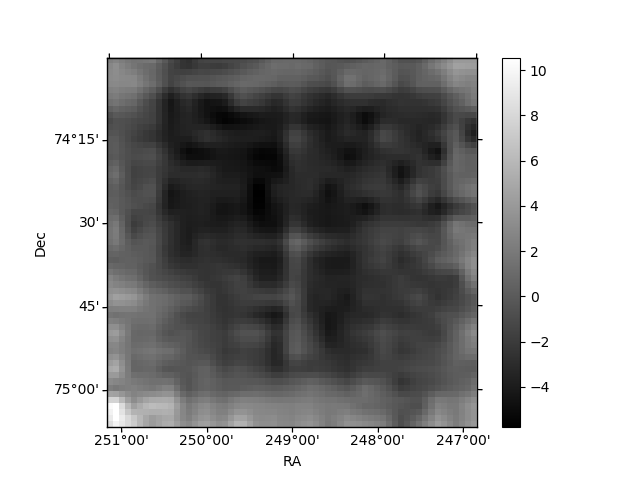
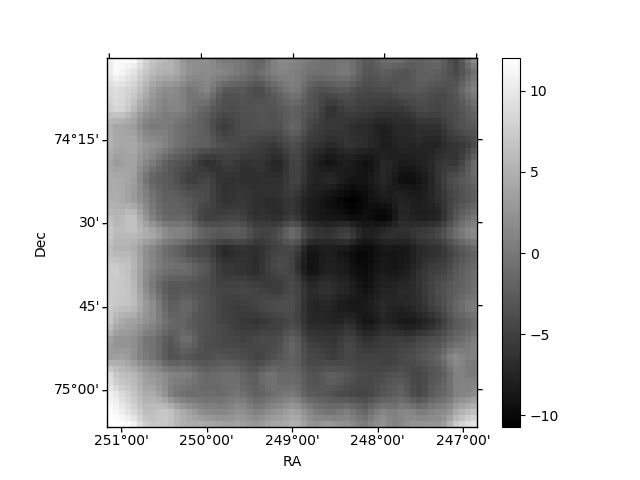
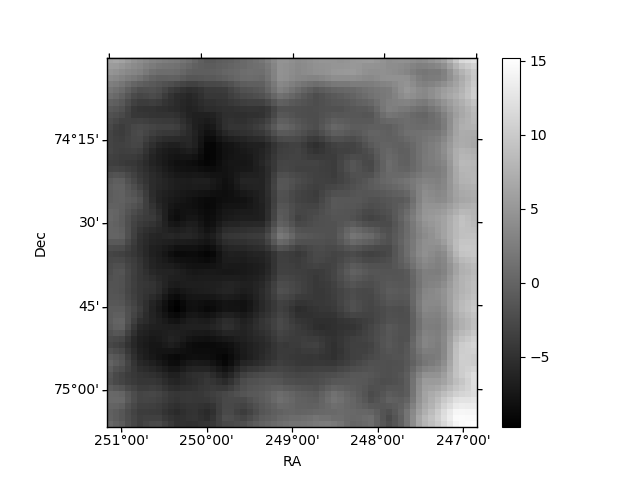
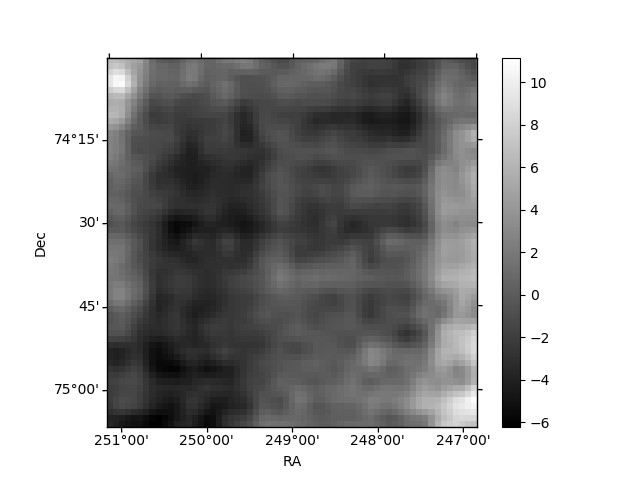
Histogram calculated using DETX and DETY for each event in the final _common_clean file
| Quadrant A | 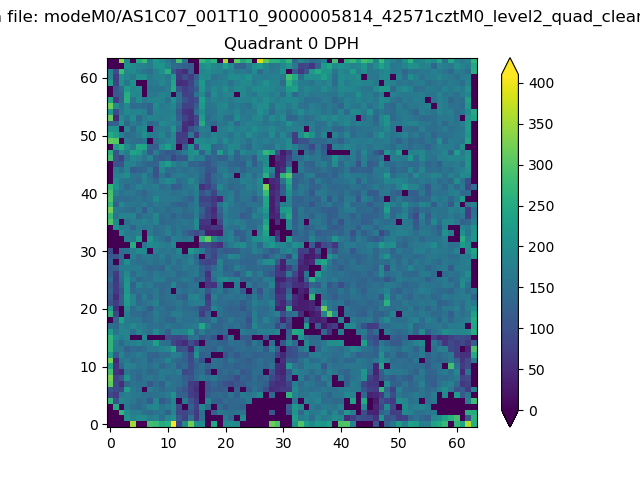 |
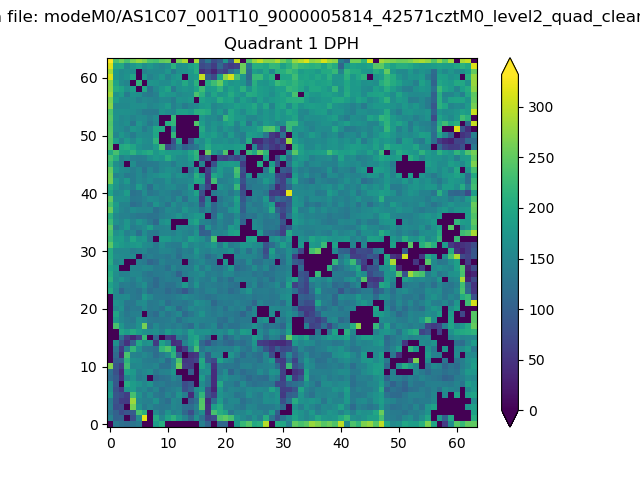 |
Quadrant B |
|---|---|---|---|
| Quadrant D | 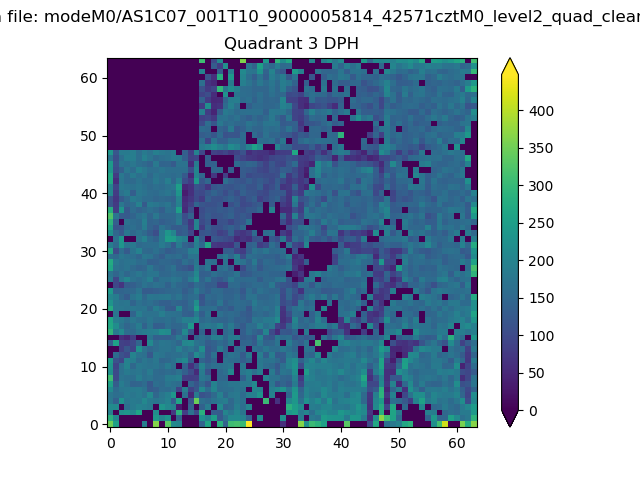 |
 |
Quadrant C |
| Plot type | Count rate plots | Images |
|---|---|---|
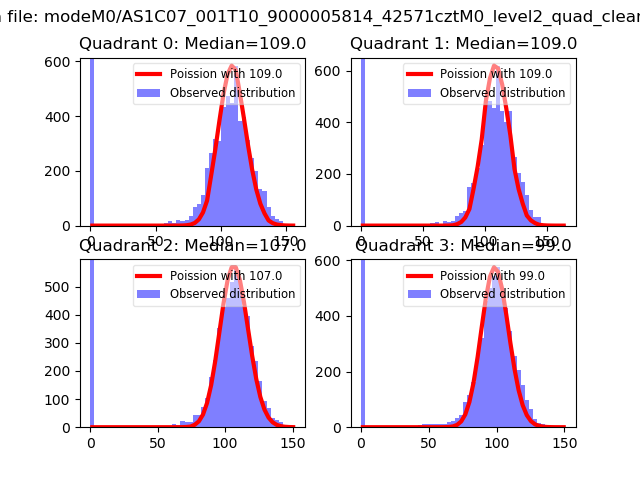
| Comparison with Poisson distribution Blue bars denote a histogram of data divided into 1 sec bins. Red curve is a Poisson curve with rate = median count rate of data. |
 |
 |
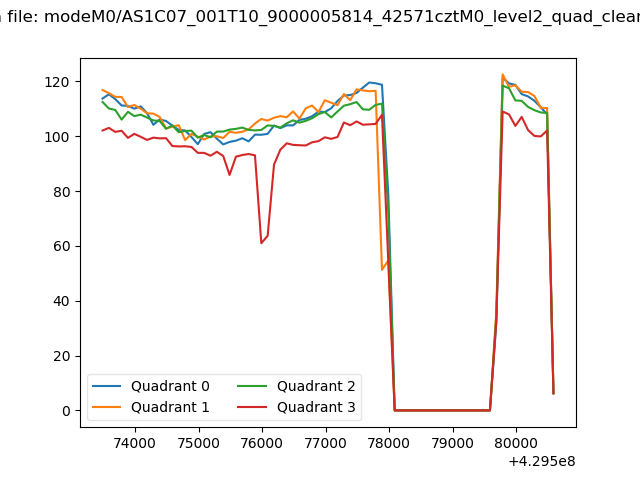
| Quadrant-wise count rates Data is divided into 100 sec bins |
 |
|
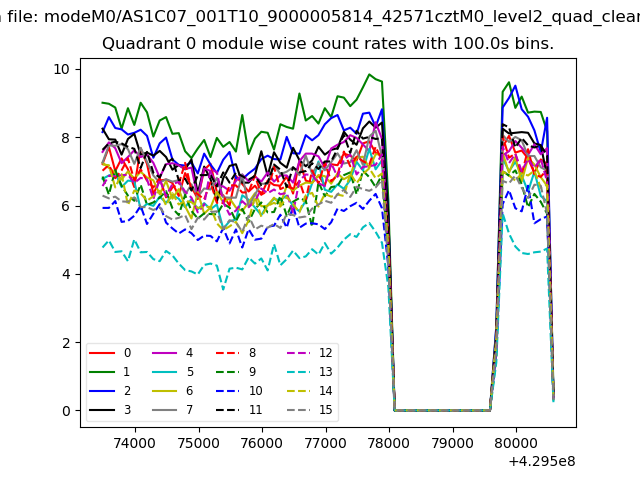
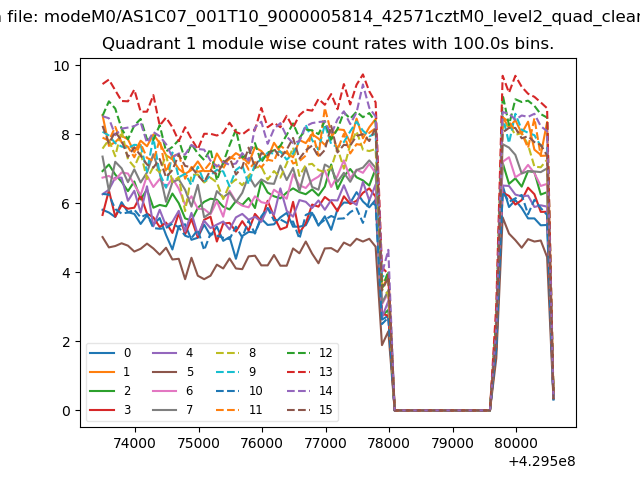
| Module-wise count rates for Quadrant A Data is divided into 100 sec bins |
 |
 |
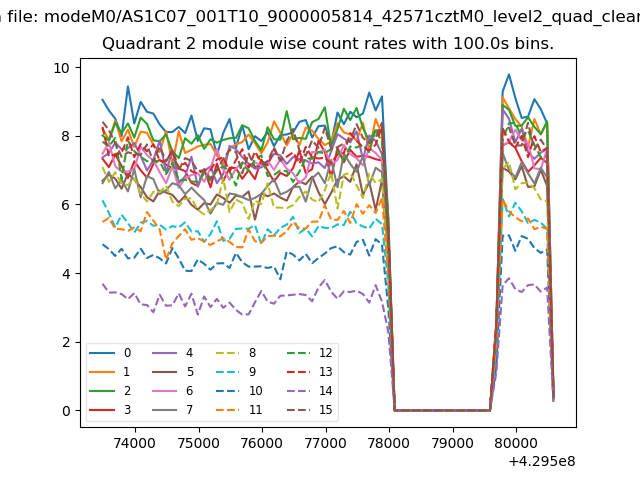
| Module-wise count rates for Quadrant B Data is divided into 100 sec bins |
 |
 |
| Module-wise count rates for Quadrant C Data is divided into 100 sec bins |
 |
 |
| Module-wise count rates for Quadrant D Data is divided into 100 sec bins |
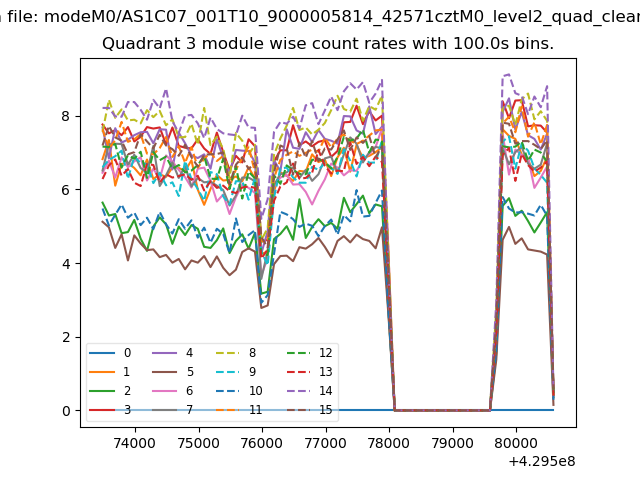 |
 |
| Parameter | Plot |
|---|---|
| CZT HV Monitor | 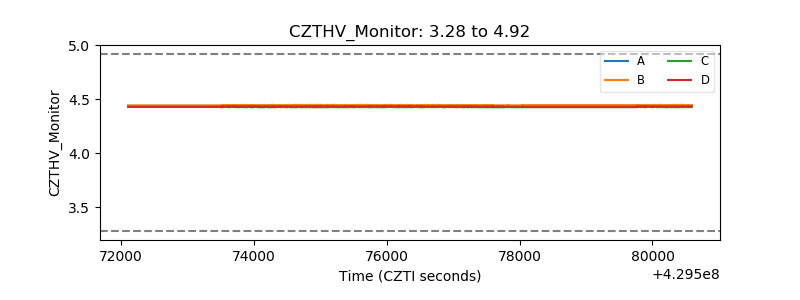 |
| D_VDD | 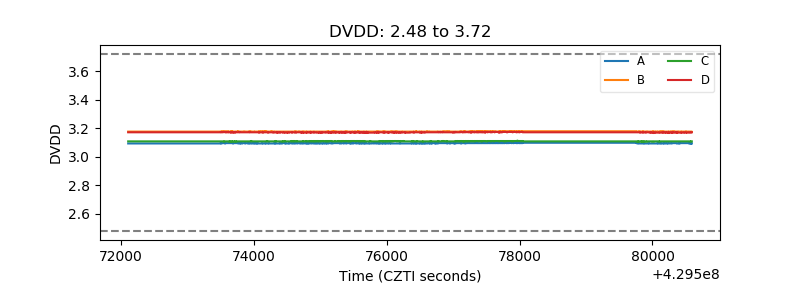 |
| Temperature 1 | 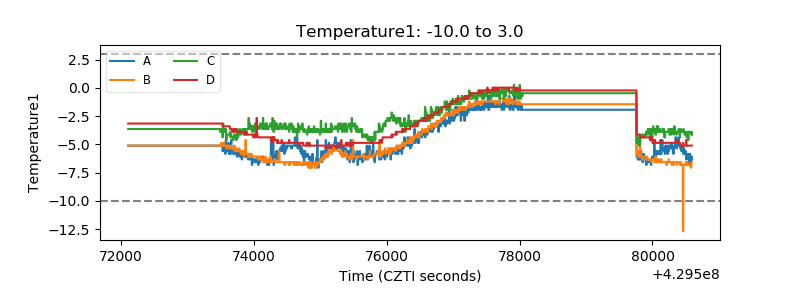 |
| Veto HV Monitor | 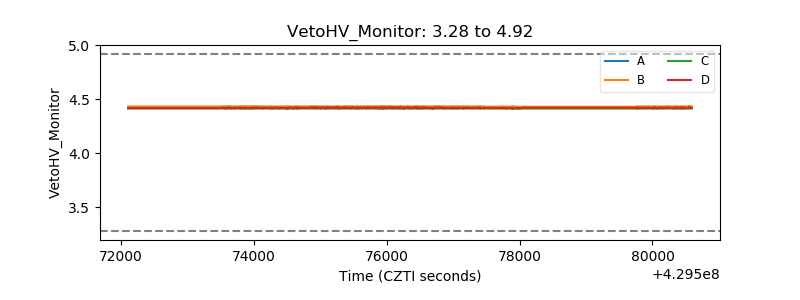 |
| Veto LLD | 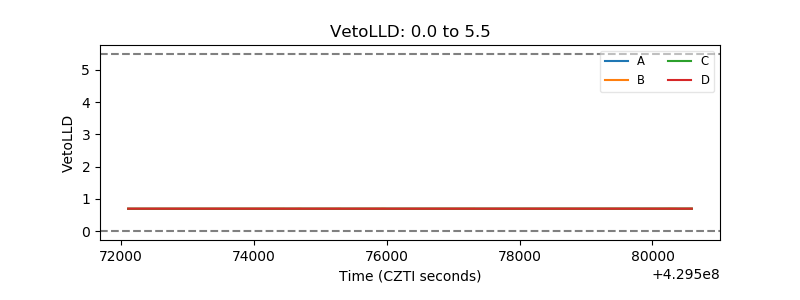 |
| Alpha Counter | 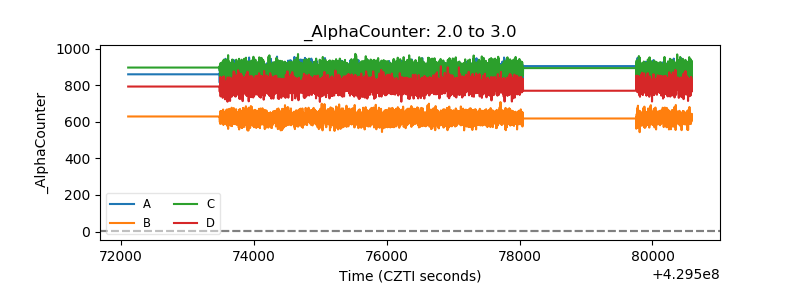 |
| _CPM_Rate | 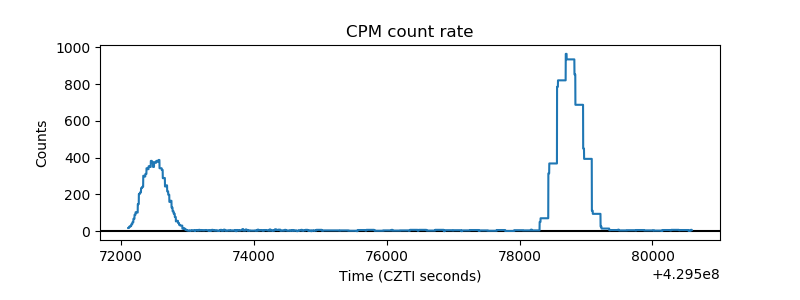 |
| CZT Counter | 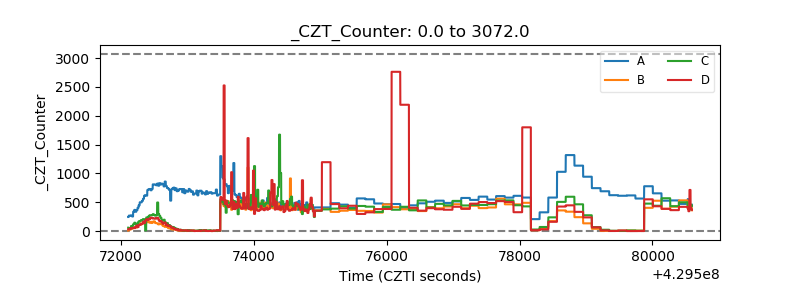 |
| +2.5 Volts monitor | 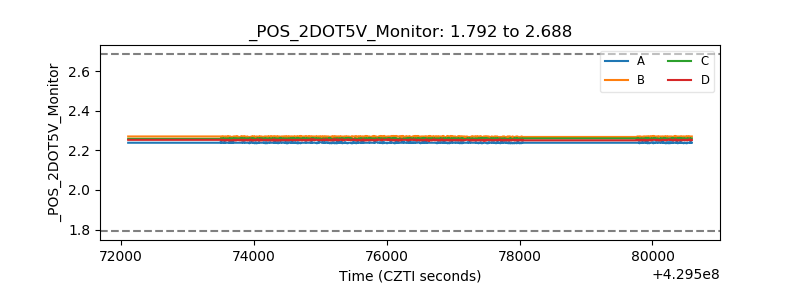 |
| +5 Volts monitor | 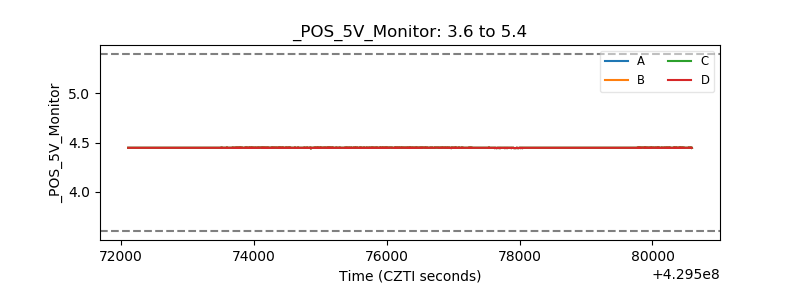 |
| _ROLL_ROT | 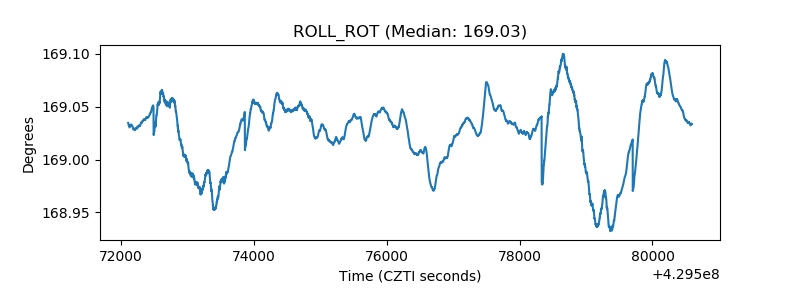 |
| _Roll_DEC | 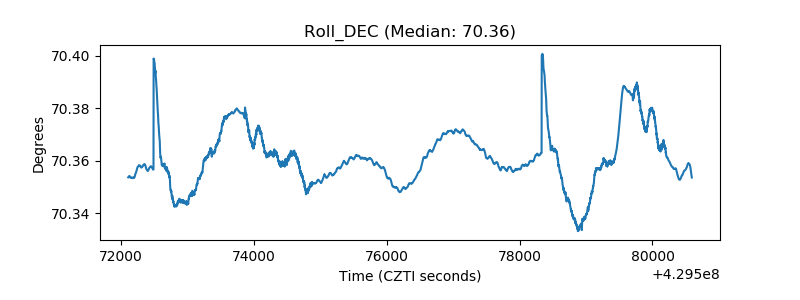 |
| _Roll_RA | 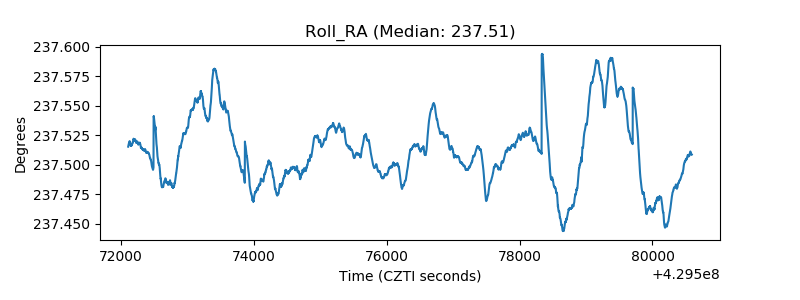 |
| Veto Counter | 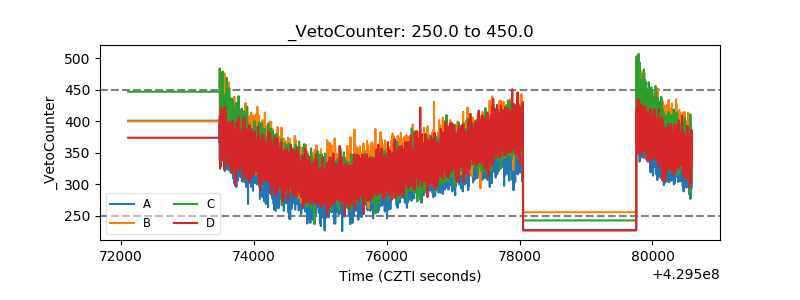 |