| Param | Original file | Final file |
|---|---|---|
| Filename | modeM0/AS1C07_001T10_9000005814_42573cztM0_level2.fits | modeM0/AS1C07_001T10_9000005814_42573cztM0_level2_quad_clean.evt |
| Size (bytes) | 337,631,040 | 90,478,080 |
| Size | 322.0 MB | 86.3 MB |
| Events in quadrant A | 2,860,164 | 608,349 |
| Events in quadrant B | 2,509,020 | 616,473 |
| Events in quadrant C | 2,497,288 | 596,616 |
| Events in quadrant D | 4,204,773 | 534,761 |
| Mode M0 | |||
|---|---|---|---|
| Quadrant | BADHDUFLAG | Total packets | Discarded packets |
| A | 0 | 11879 | 2 |
| B | 0 | 11407 | 2 |
| C | 0 | 11026 | 2 |
| D | 0 | 16492 | 2 |
| Mode M9 | |||
|---|---|---|---|
| Quadrant | BADHDUFLAG | Total packets | Discarded packets |
| A | 0 | 33 | 0 |
| B | 0 | 34 | 0 |
| C | 0 | 34 | 0 |
| D | 0 | 34 | 0 |
| Mode SS | |||
|---|---|---|---|
| Quadrant | BADHDUFLAG | Total packets | Discarded packets |
| A | 0 | 112 | 0 |
| B | 0 | 112 | 0 |
| C | 0 | 112 | 0 |
| D | 0 | 112 | 0 |
| Quadrant | Total seconds | Saturated seconds | Saturation percentage |
|---|---|---|---|
| A | 5476 | 10 | 0.182615% |
| B | 5476 | 28 | 0.511322% |
| C | 5476 | 4 | 0.073046% |
| D | 5476 | 284 | 5.186267% |
Noise dominated data is calculated using 1-second bins in cleaned event files. If a bin has >2000 counts, and if more than 50% of those come from <1% of pixels, then it is considered to be noise-dominated and hence unusable.
| Quadrant | # 1 sec bins | Bins with >0 counts | Bins with >2000 counts | High rate bins dominated by noise | Noise dominated (total time) | Noise dominated (detector-on time) | Marked lightcurve |
|---|---|---|---|---|---|---|---|
| A | 7269 | 5477 | 4 | 4 | 0.06% | 0.07% | 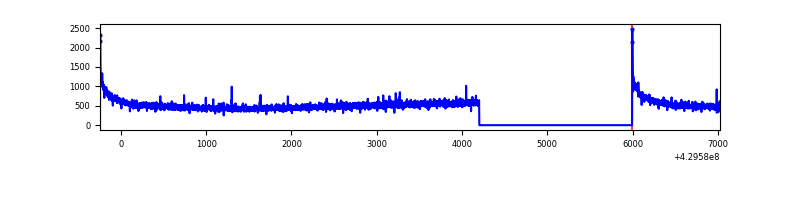 |
| B | 7269 | 5477 | 15 | 15 | 0.21% | 0.27% | 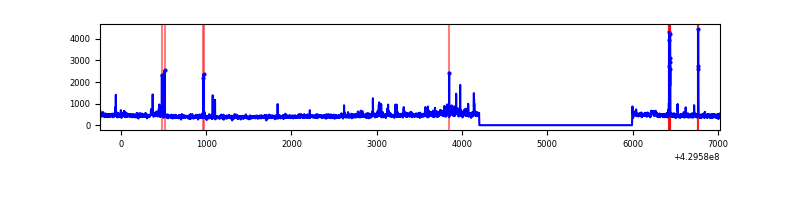 |
| C | 7269 | 5477 | 1 | 1 | 0.01% | 0.02% | 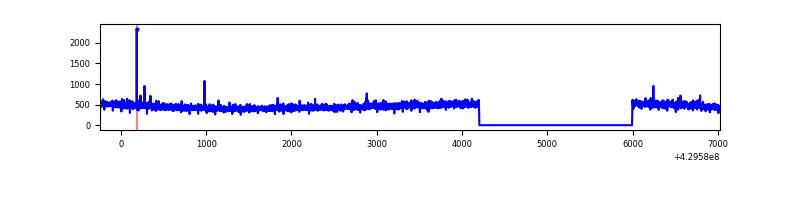 |
| D | 7269 | 5477 | 245 | 245 | 3.37% | 4.47% | 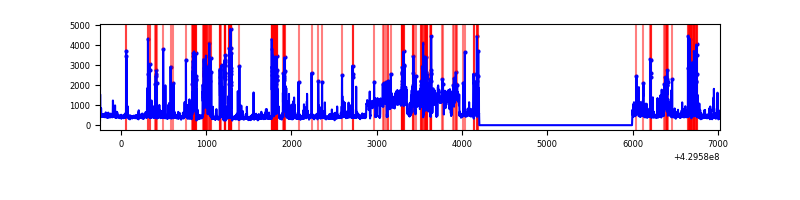 |
Top three noisy pixels from each quadrant. If the there are fewer than three noisy pixels in the level2.evt file, extra rows are filled as -1
| Pixel properties | Quadrant properties | ||||||
|---|---|---|---|---|---|---|---|
| Quadrant | DetID | PixID | Counts | Sigma | Mean | Median | Sigma |
| A | 10 | 83 | 568743 | 4687.44 | 588 | 577 | 121.2 |
| A | 13 | 248 | 10307 | 80.27 | 588 | 577 | 121.2 |
| A | 13 | 254 | 6308 | 47.28 | 588 | 577 | 121.2 |
| B | 5 | 172 | 75123 | 659.48 | 586 | 569 | 113.0 |
| B | 0 | 245 | 70358 | 617.33 | 586 | 569 | 113.0 |
| B | 5 | 255 | 28335 | 245.61 | 586 | 569 | 113.0 |
| C | 15 | 214 | 226941 | 1690.66 | 573 | 576 | 133.9 |
| C | 7 | 220 | 26286 | 192.02 | 573 | 576 | 133.9 |
| C | 14 | 254 | 8702 | 60.69 | 573 | 576 | 133.9 |
| D | 2 | 16 | 629397 | 4560.83 | 561 | 543 | 137.9 |
| D | 12 | 6 | 444228 | 3217.87 | 561 | 543 | 137.9 |
| D | 1 | 52 | 330909 | 2396.02 | 561 | 543 | 137.9 |
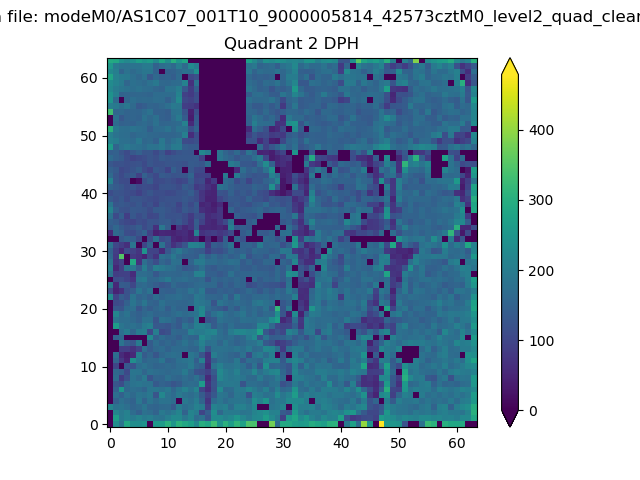
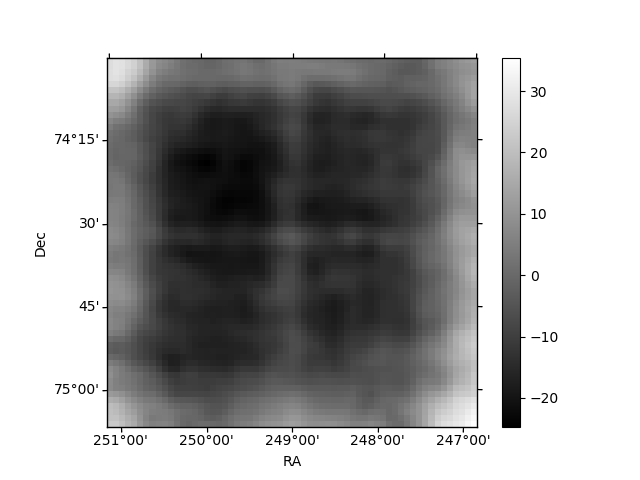
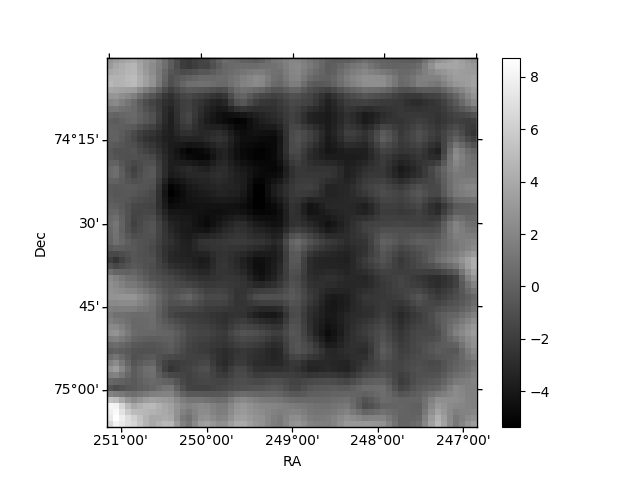
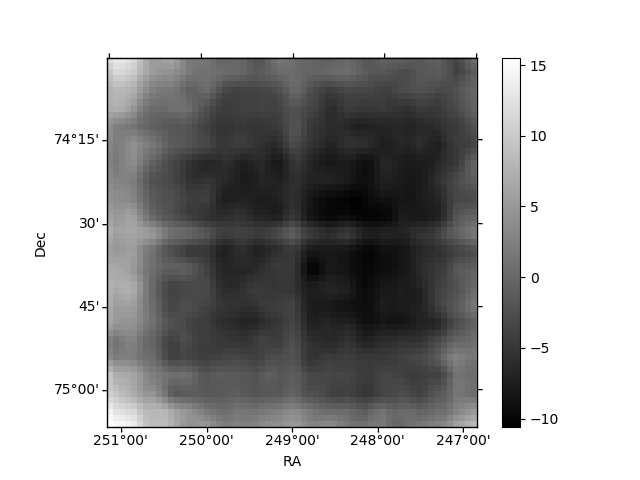
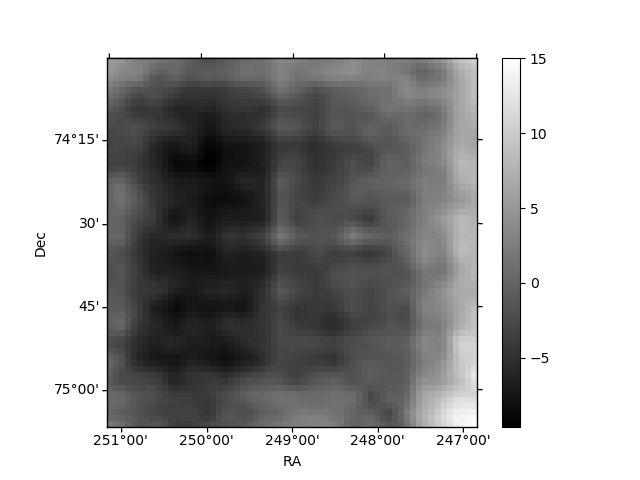
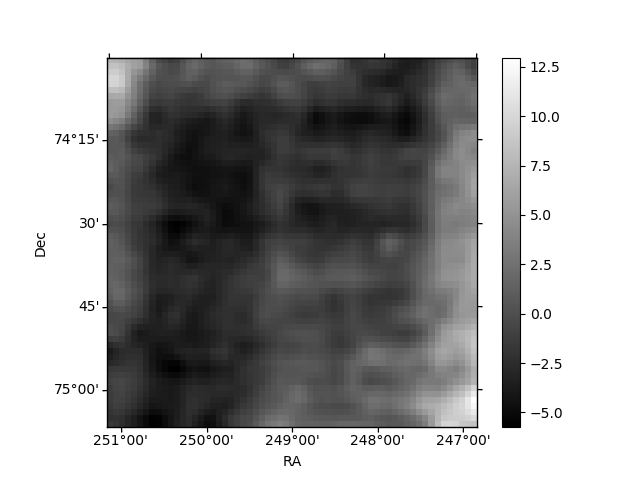
Histogram calculated using DETX and DETY for each event in the final _common_clean file
| Quadrant A | 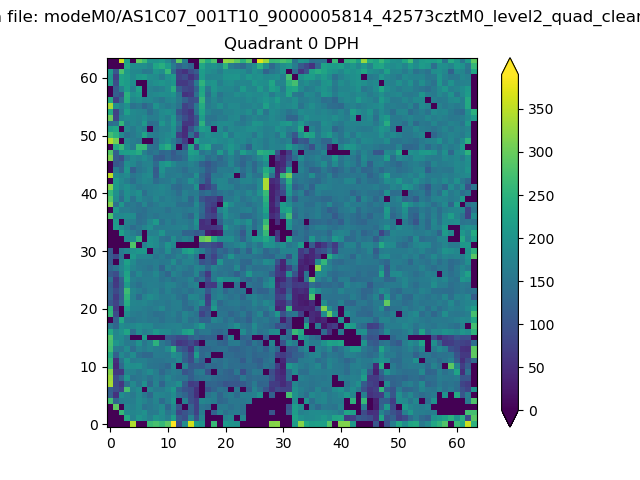 |
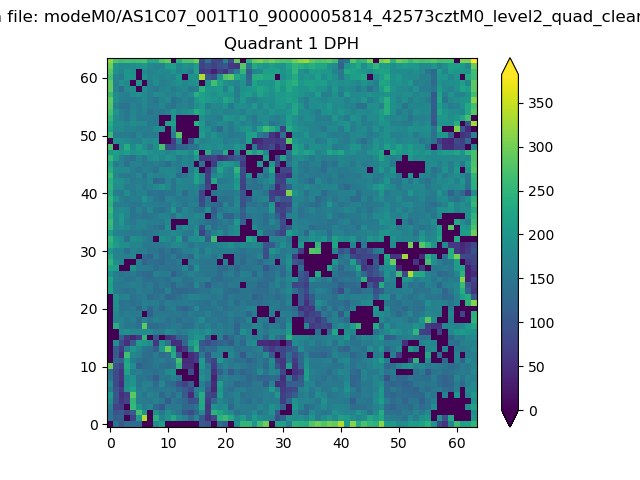 |
Quadrant B |
|---|---|---|---|
| Quadrant D | 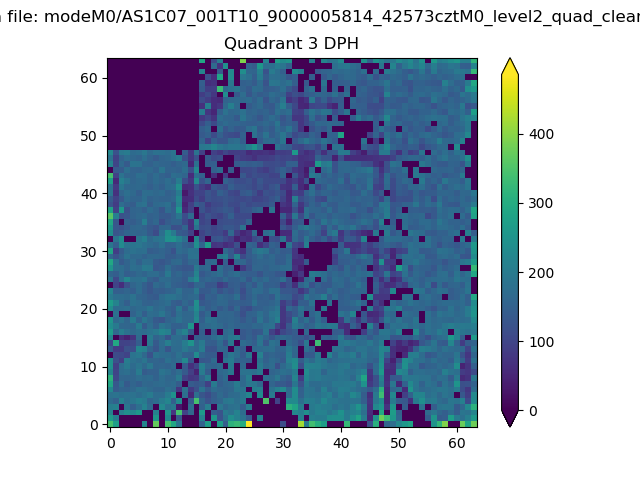 |
 |
Quadrant C |
| Plot type | Count rate plots | Images |
|---|---|---|
| Comparison with Poisson distribution Blue bars denote a histogram of data divided into 1 sec bins. Red curve is a Poisson curve with rate = median count rate of data. |
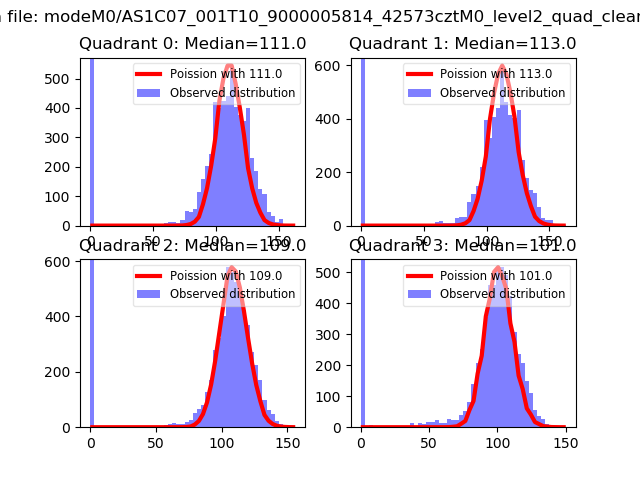 |
 |
| Quadrant-wise count rates Data is divided into 100 sec bins |
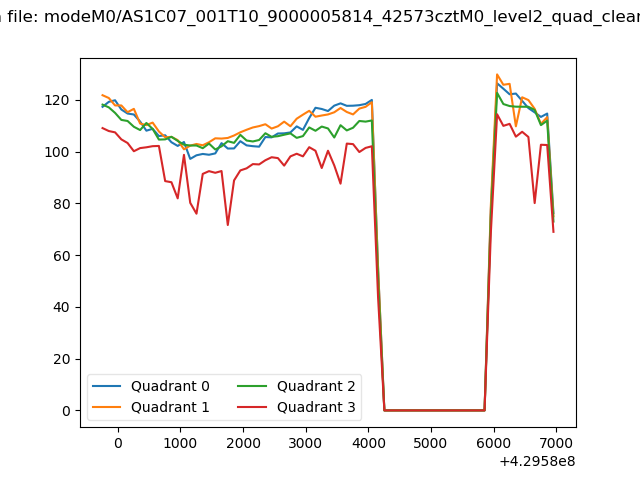 |
|
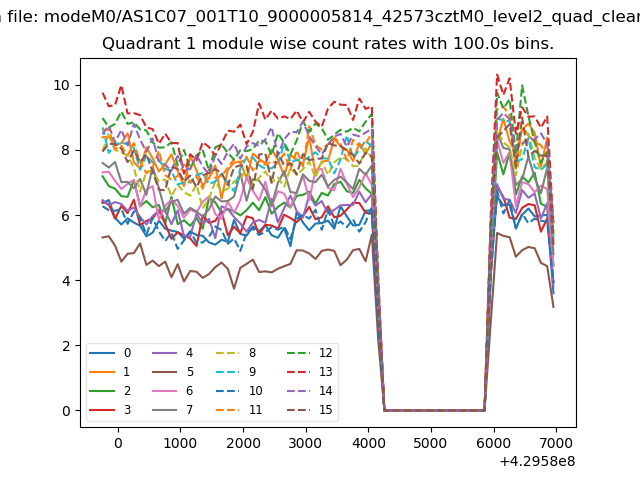
| Module-wise count rates for Quadrant A Data is divided into 100 sec bins |
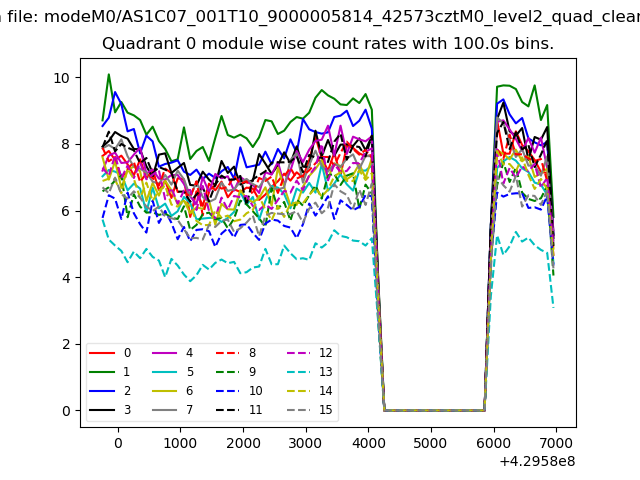 |
 |
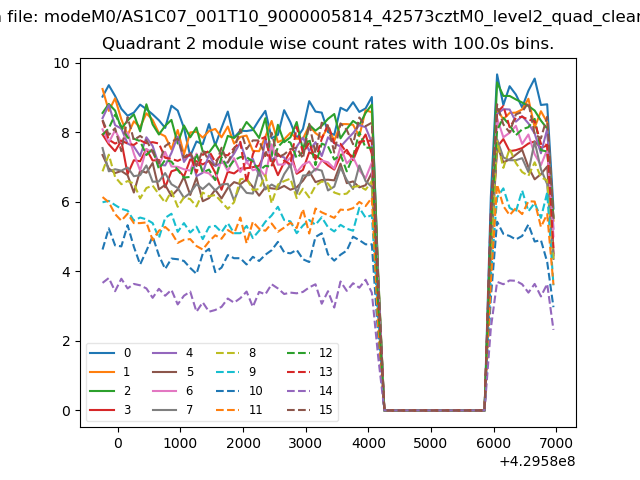
| Module-wise count rates for Quadrant B Data is divided into 100 sec bins |
 |
 |
| Module-wise count rates for Quadrant C Data is divided into 100 sec bins |
 |
 |
| Module-wise count rates for Quadrant D Data is divided into 100 sec bins |
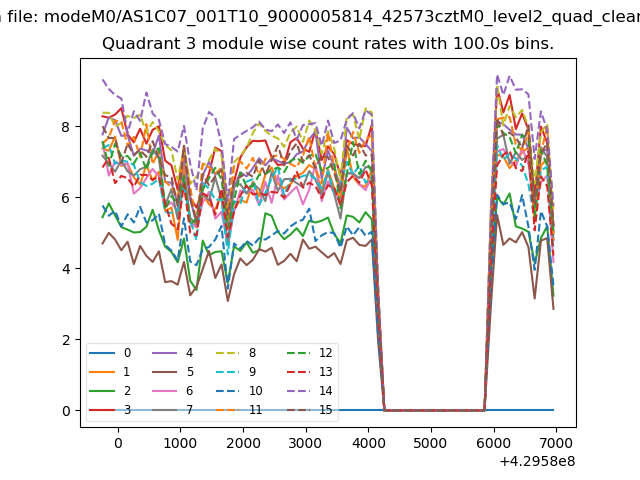 |
 |
| Parameter | Plot |
|---|---|
| CZT HV Monitor | 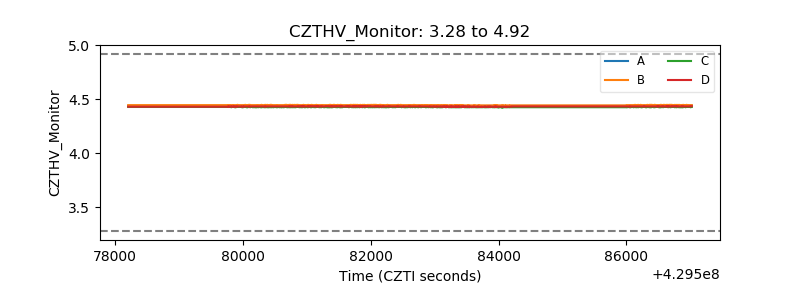 |
| D_VDD | 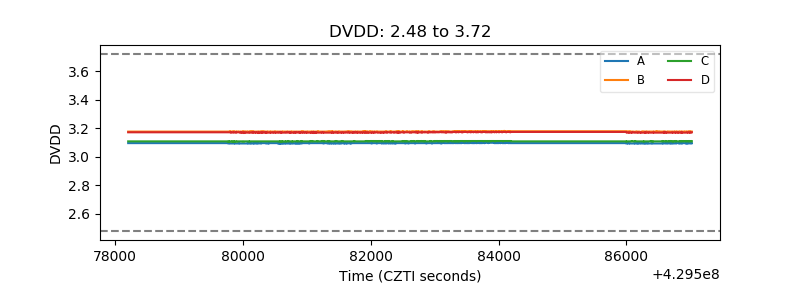 |
| Temperature 1 | 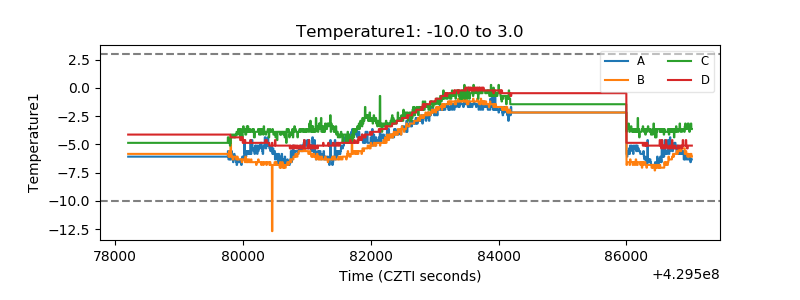 |
| Veto HV Monitor | 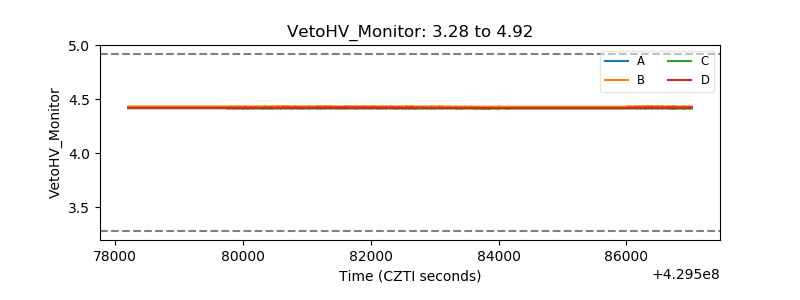 |
| Veto LLD | 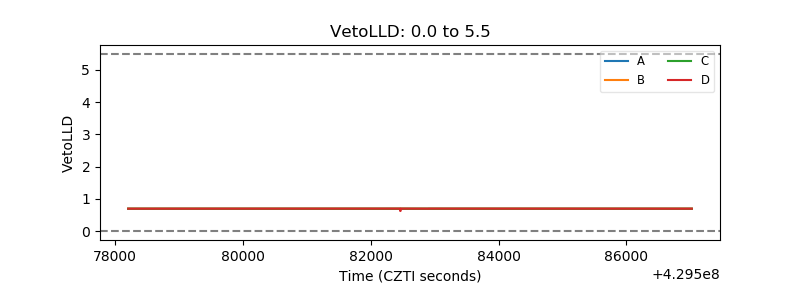 |
| Alpha Counter | 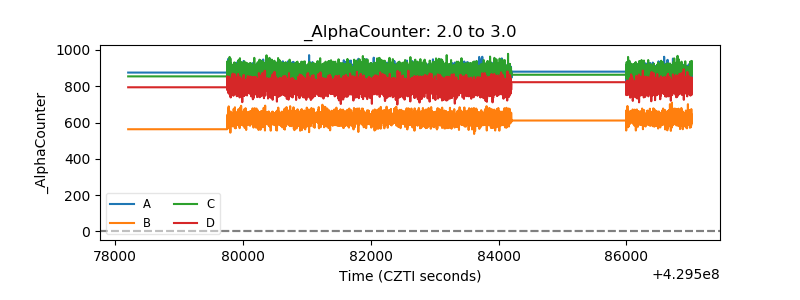 |
| _CPM_Rate | 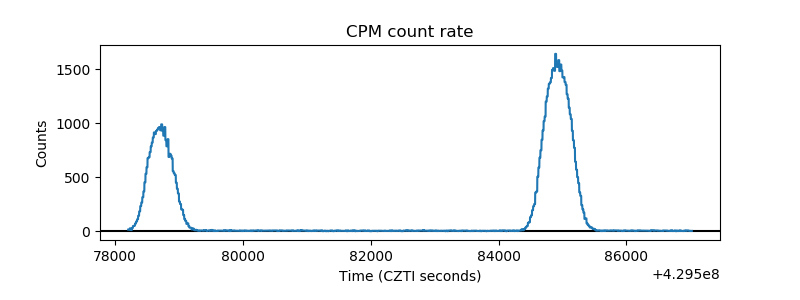 |
| CZT Counter | 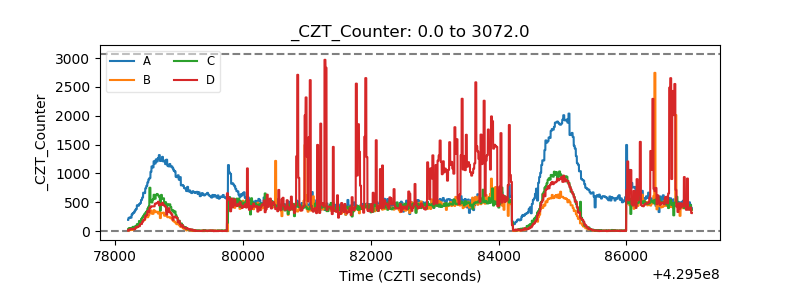 |
| +2.5 Volts monitor | 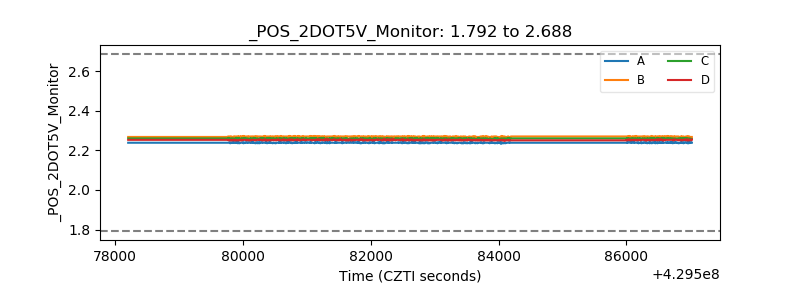 |
| +5 Volts monitor | 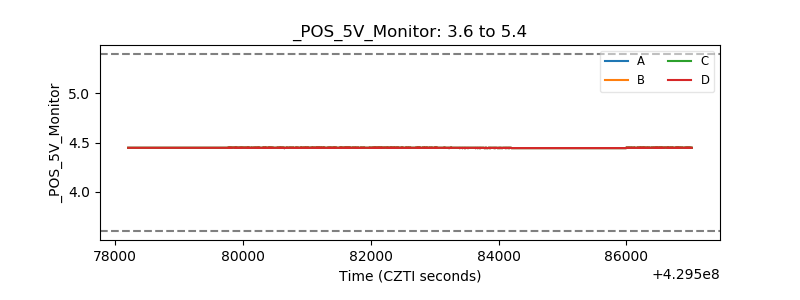 |
| _ROLL_ROT | 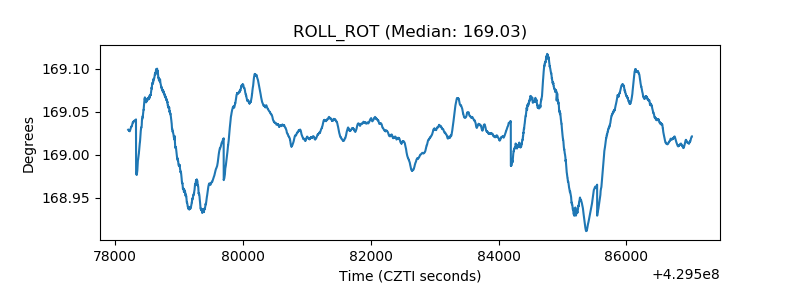 |
| _Roll_DEC | 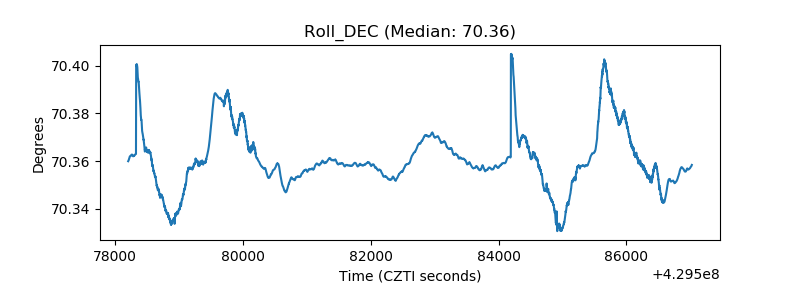 |
| _Roll_RA | 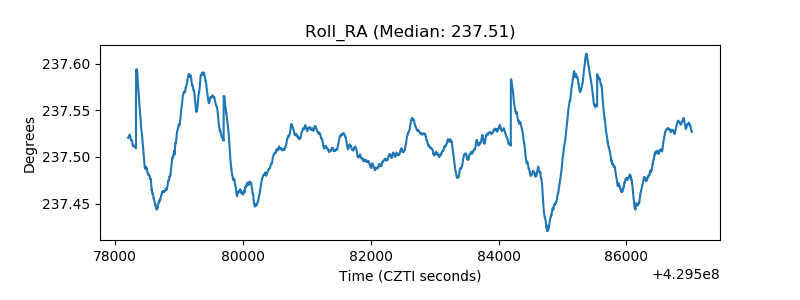 |
| Veto Counter | 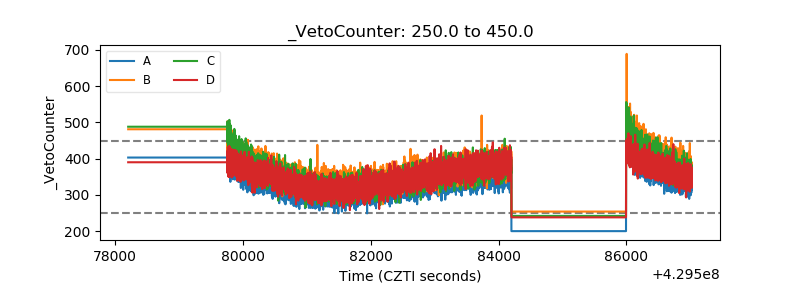 |