| Param | Original file | Final file |
|---|---|---|
| Filename | modeM0/AS1C07_001T10_9000005814_42574cztM0_level2.fits | modeM0/AS1C07_001T10_9000005814_42574cztM0_level2_quad_clean.evt |
| Size (bytes) | 316,984,320 | 90,760,320 |
| Size | 302.3 MB | 86.6 MB |
| Events in quadrant A | 2,905,733 | 612,744 |
| Events in quadrant B | 2,557,741 | 619,767 |
| Events in quadrant C | 2,503,745 | 598,027 |
| Events in quadrant D | 3,352,168 | 545,057 |
| Mode M0 | |||
|---|---|---|---|
| Quadrant | BADHDUFLAG | Total packets | Discarded packets |
| A | 0 | 11825 | 2 |
| B | 0 | 11323 | 2 |
| C | 0 | 10847 | 2 |
| D | 0 | 13772 | 2 |
| Mode M9 | |||
|---|---|---|---|
| Quadrant | BADHDUFLAG | Total packets | Discarded packets |
| A | 0 | 24 | 0 |
| B | 0 | 25 | 0 |
| C | 0 | 25 | 0 |
| D | 0 | 25 | 0 |
| Mode SS | |||
|---|---|---|---|
| Quadrant | BADHDUFLAG | Total packets | Discarded packets |
| A | 0 | 110 | 0 |
| B | 0 | 110 | 0 |
| C | 0 | 110 | 0 |
| D | 0 | 110 | 0 |
| Quadrant | Total seconds | Saturated seconds | Saturation percentage |
|---|---|---|---|
| A | 5315 | 17 | 0.319849% |
| B | 5315 | 62 | 1.166510% |
| C | 5315 | 8 | 0.150517% |
| D | 5315 | 139 | 2.615240% |
Noise dominated data is calculated using 1-second bins in cleaned event files. If a bin has >2000 counts, and if more than 50% of those come from <1% of pixels, then it is considered to be noise-dominated and hence unusable.
| Quadrant | # 1 sec bins | Bins with >0 counts | Bins with >2000 counts | High rate bins dominated by noise | Noise dominated (total time) | Noise dominated (detector-on time) | Marked lightcurve |
|---|---|---|---|---|---|---|---|
| A | 7256 | 5316 | 5 | 5 | 0.07% | 0.09% | 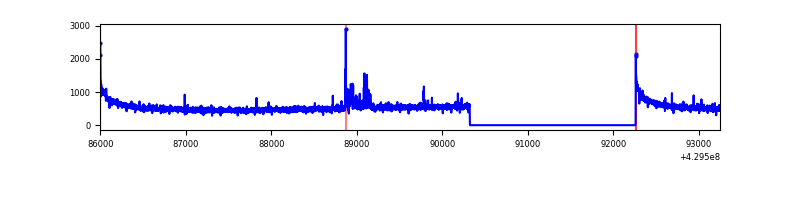 |
| B | 7256 | 5316 | 43 | 43 | 0.59% | 0.81% | 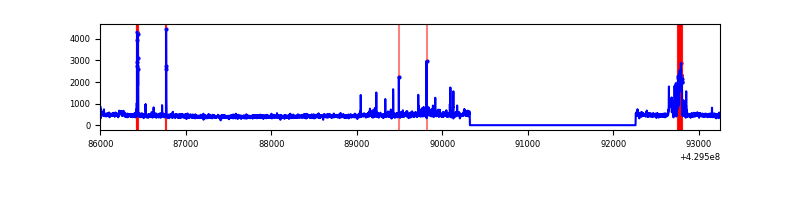 |
| C | 7256 | 5316 | 2 | 2 | 0.03% | 0.04% | 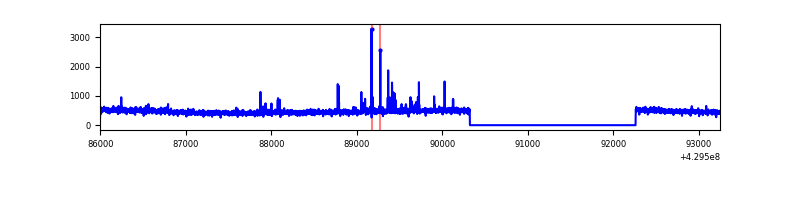 |
| D | 7256 | 5316 | 134 | 134 | 1.85% | 2.52% | 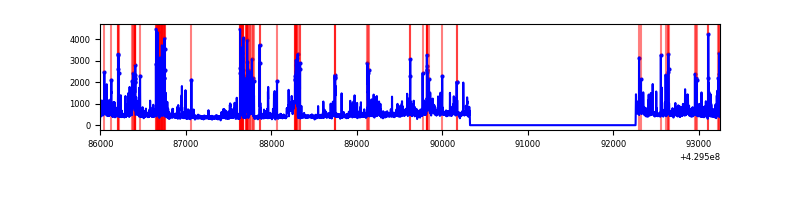 |
Top three noisy pixels from each quadrant. If the there are fewer than three noisy pixels in the level2.evt file, extra rows are filled as -1
| Pixel properties | Quadrant properties | ||||||
|---|---|---|---|---|---|---|---|
| Quadrant | DetID | PixID | Counts | Sigma | Mean | Median | Sigma |
| A | 10 | 83 | 554138 | 4636.53 | 585 | 574 | 119.4 |
| A | 13 | 248 | 74769 | 621.44 | 585 | 574 | 119.4 |
| A | 2 | 79 | 14726 | 118.53 | 585 | 574 | 119.4 |
| B | 5 | 172 | 183465 | 1637.49 | 580 | 563 | 111.7 |
| B | 0 | 245 | 42010 | 371.07 | 580 | 563 | 111.7 |
| B | 0 | 189 | 23395 | 204.41 | 580 | 563 | 111.7 |
| C | 15 | 214 | 220833 | 1697.42 | 564 | 568 | 129.8 |
| C | 7 | 220 | 53805 | 410.26 | 564 | 568 | 129.8 |
| C | 5 | 250 | 14034 | 103.77 | 564 | 568 | 129.8 |
| D | 1 | 52 | 396755 | 2898.47 | 559 | 543 | 136.7 |
| D | 12 | 6 | 376913 | 2753.32 | 559 | 543 | 136.7 |
| D | 5 | 157 | 103268 | 751.48 | 559 | 543 | 136.7 |
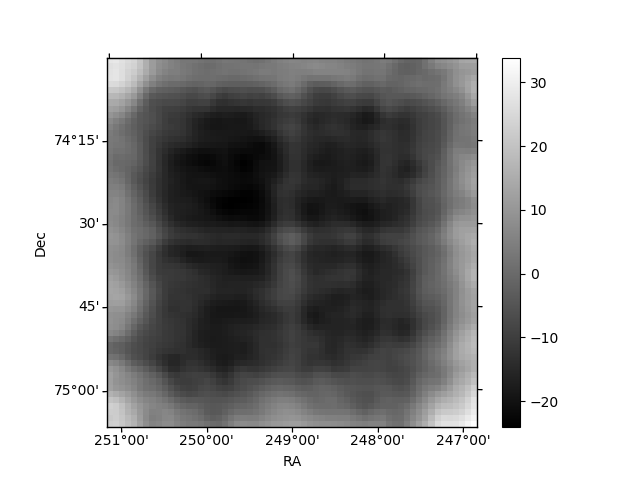
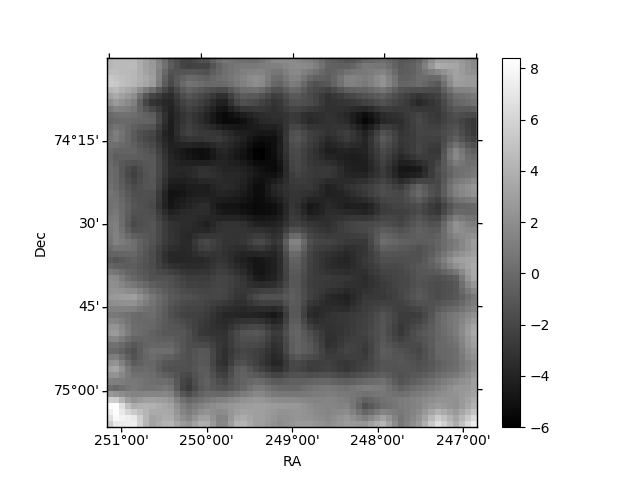
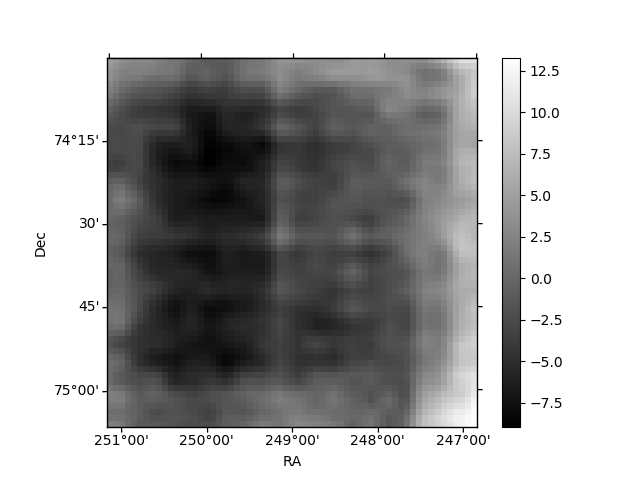
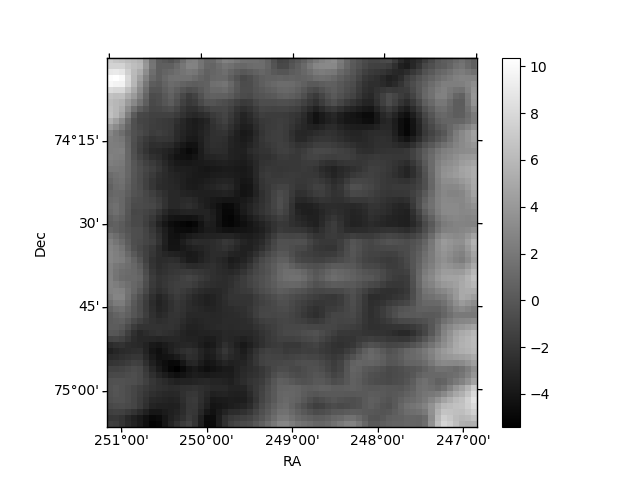
Histogram calculated using DETX and DETY for each event in the final _common_clean file
| Quadrant A | 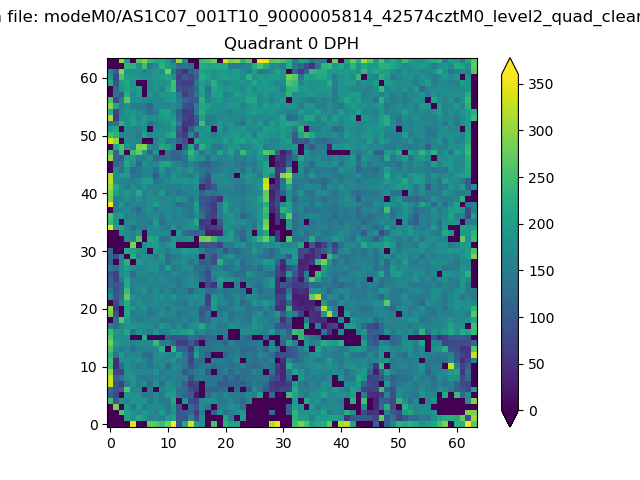 |
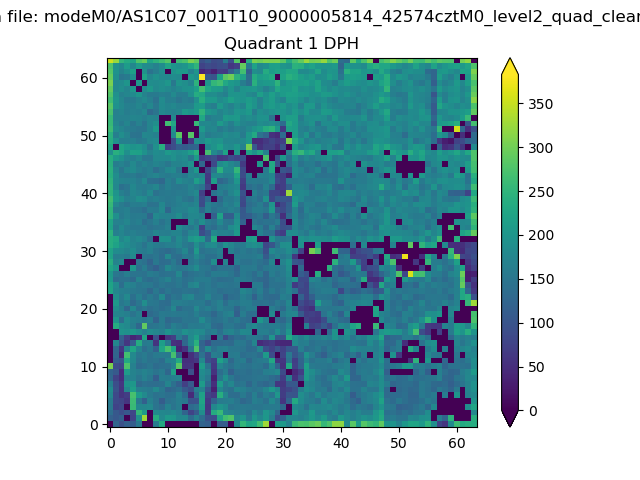 |
Quadrant B |
|---|---|---|---|
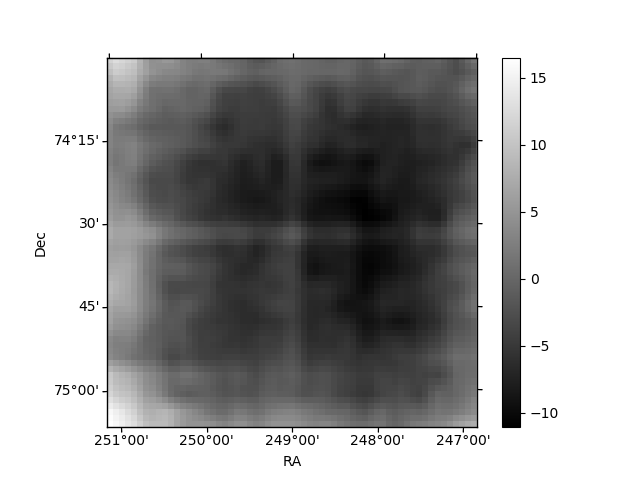
| Quadrant D | 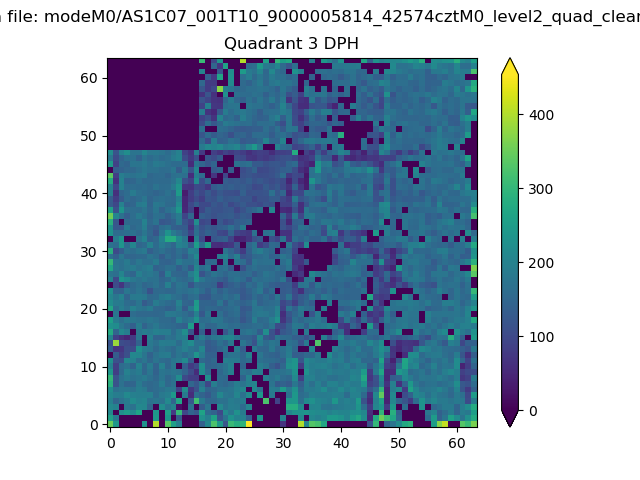 |
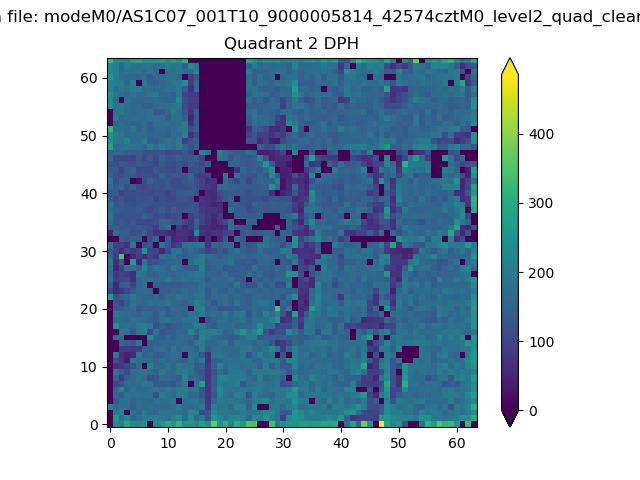 |
Quadrant C |
| Plot type | Count rate plots | Images |
|---|---|---|
| Comparison with Poisson distribution Blue bars denote a histogram of data divided into 1 sec bins. Red curve is a Poisson curve with rate = median count rate of data. |
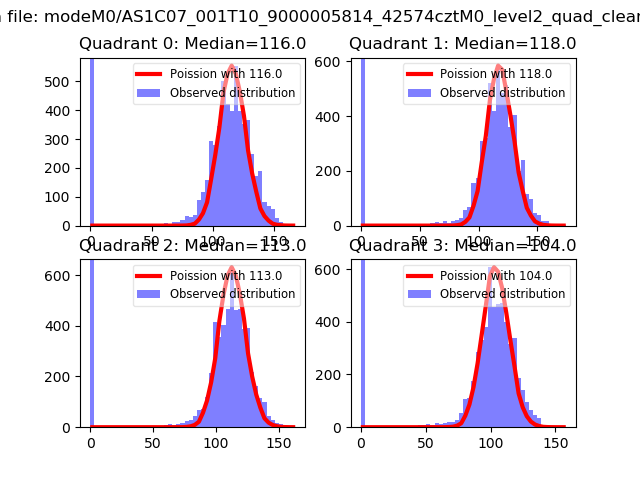 |
 |
| Quadrant-wise count rates Data is divided into 100 sec bins |
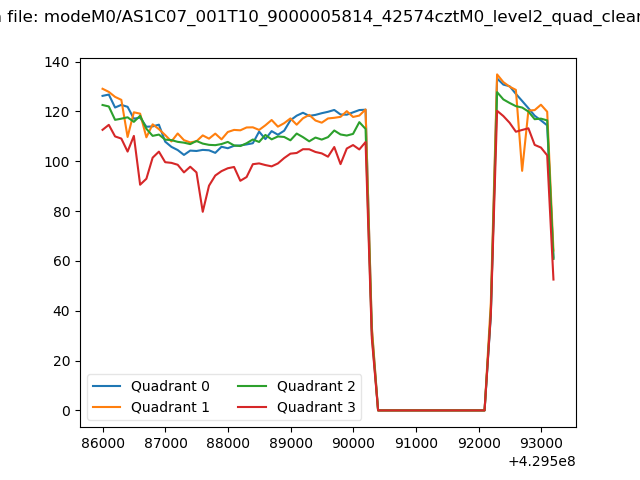 |
|
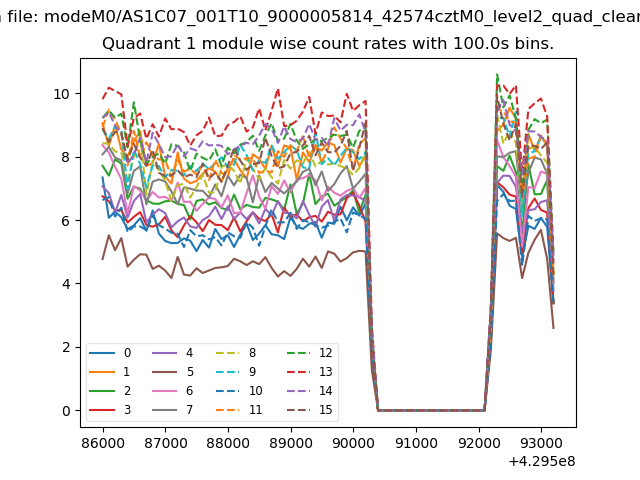
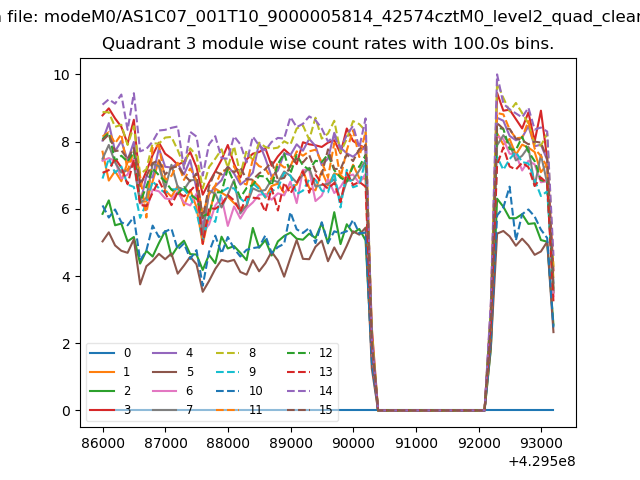
| Module-wise count rates for Quadrant A Data is divided into 100 sec bins |
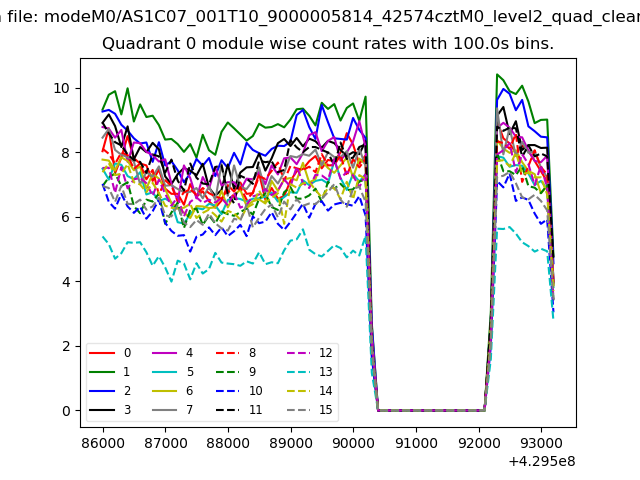 |
 |
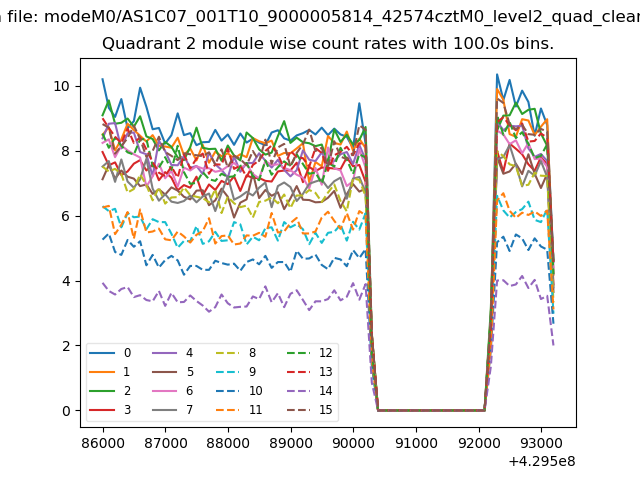
| Module-wise count rates for Quadrant B Data is divided into 100 sec bins |
 |
 |
| Module-wise count rates for Quadrant C Data is divided into 100 sec bins |
 |
 |
| Module-wise count rates for Quadrant D Data is divided into 100 sec bins |
 |
 |
| Parameter | Plot |
|---|---|
| CZT HV Monitor | 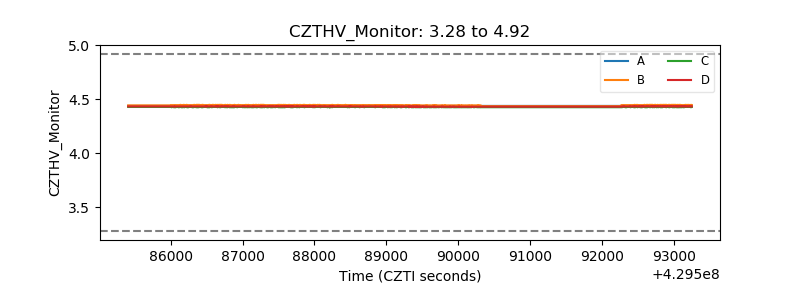 |
| D_VDD | 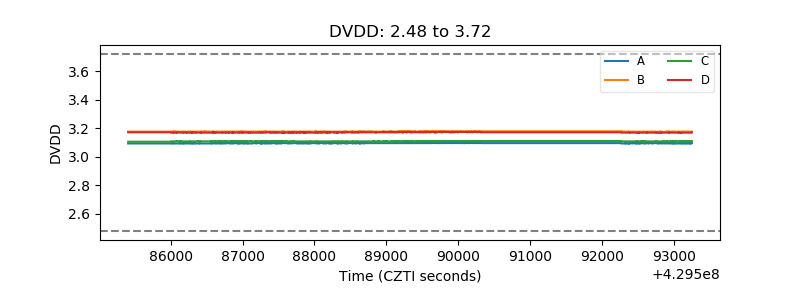 |
| Temperature 1 | 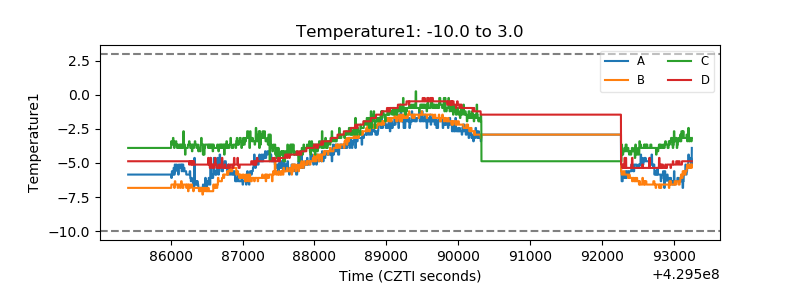 |
| Veto HV Monitor | 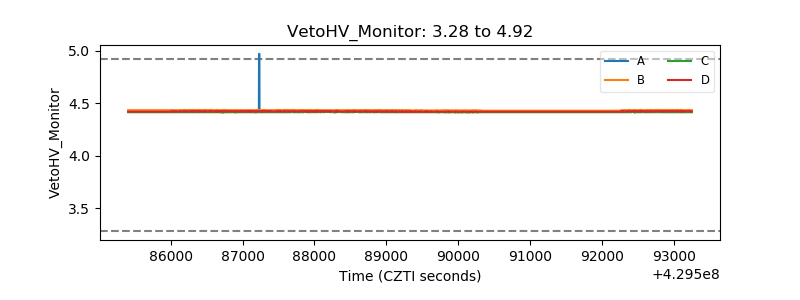 |
| Veto LLD | 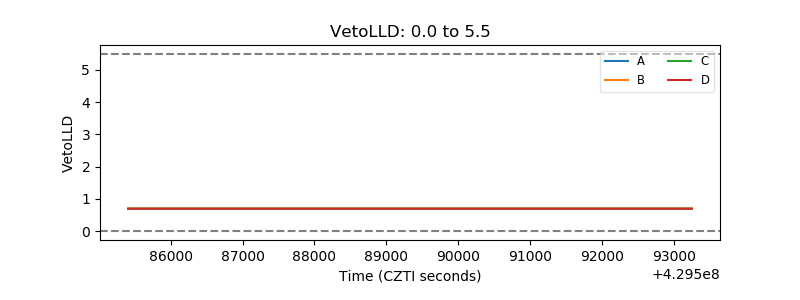 |
| Alpha Counter |  |
| _CPM_Rate | 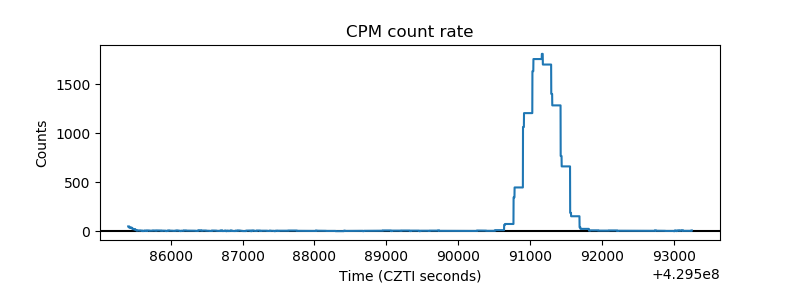 |
| CZT Counter | 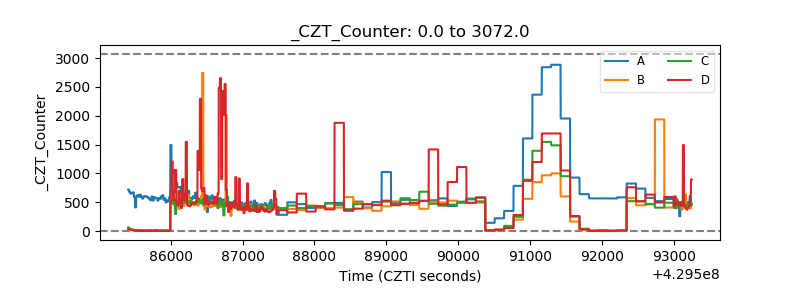 |
| +2.5 Volts monitor | 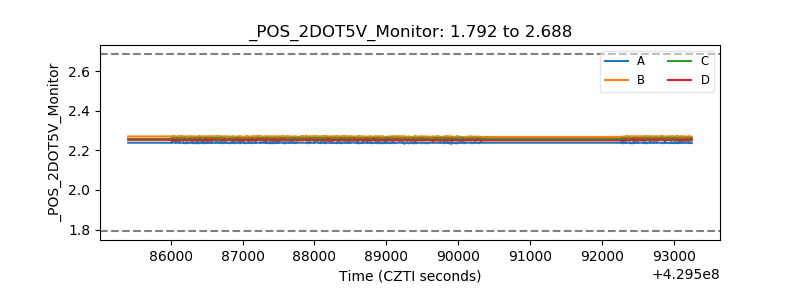 |
| +5 Volts monitor | 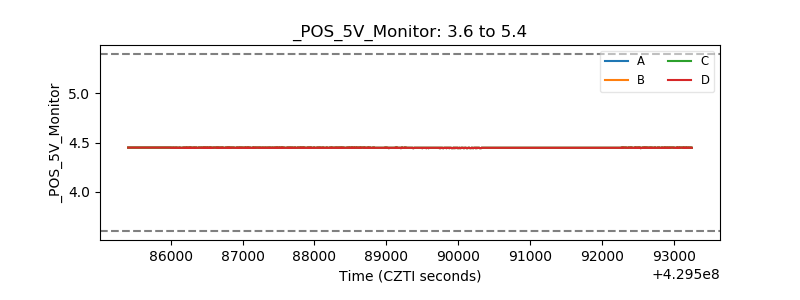 |
| _ROLL_ROT | 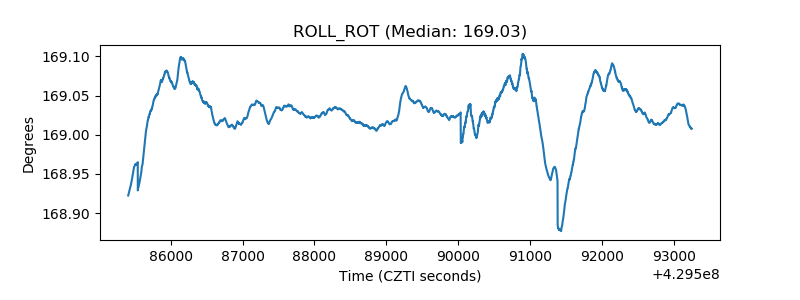 |
| _Roll_DEC | 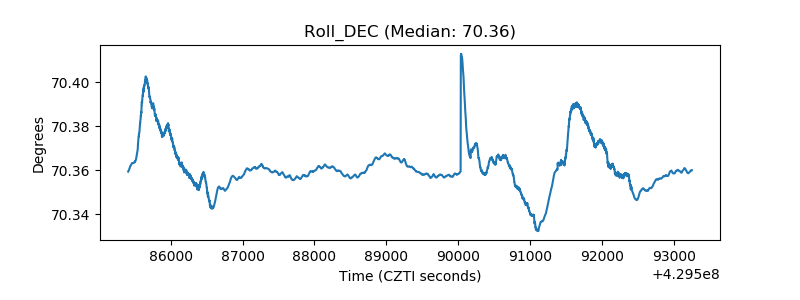 |
| _Roll_RA | 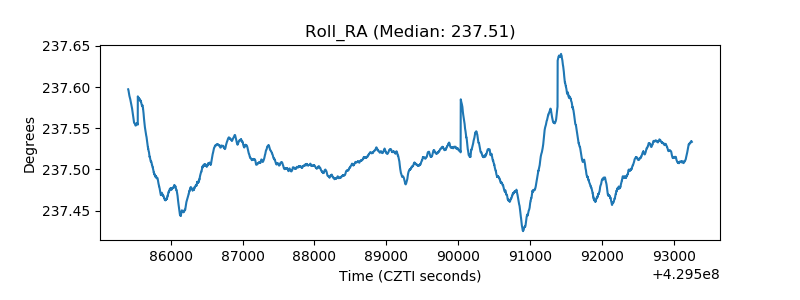 |
| Veto Counter | 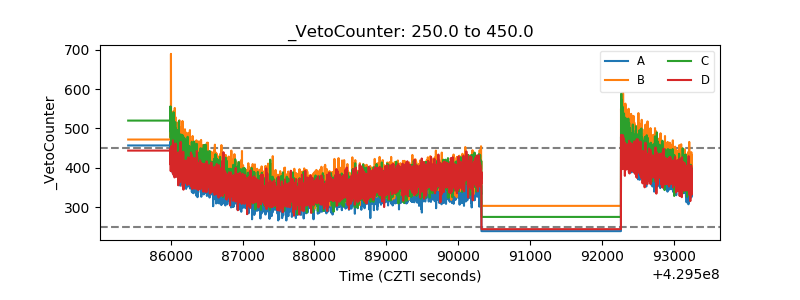 |