| Param | Original file | Final file |
|---|---|---|
| Filename | modeM0/AS1C07_001T10_9000005814_42575cztM0_level2.fits | modeM0/AS1C07_001T10_9000005814_42575cztM0_level2_quad_clean.evt |
| Size (bytes) | 334,198,080 | 89,357,760 |
| Size | 318.7 MB | 85.2 MB |
| Events in quadrant A | 2,878,370 | 614,967 |
| Events in quadrant B | 3,214,208 | 603,282 |
| Events in quadrant C | 2,389,287 | 592,752 |
| Events in quadrant D | 3,488,502 | 534,895 |
| Mode M0 | |||
|---|---|---|---|
| Quadrant | BADHDUFLAG | Total packets | Discarded packets |
| A | 0 | 11487 | 2 |
| B | 0 | 12973 | 2 |
| C | 0 | 10329 | 2 |
| D | 0 | 13841 | 2 |
| Mode M9 | |||
|---|---|---|---|
| Quadrant | BADHDUFLAG | Total packets | Discarded packets |
| A | 0 | 30 | 0 |
| B | 0 | 31 | 0 |
| C | 0 | 31 | 0 |
| D | 0 | 31 | 0 |
| Mode SS | |||
|---|---|---|---|
| Quadrant | BADHDUFLAG | Total packets | Discarded packets |
| A | 0 | 104 | 0 |
| B | 0 | 104 | 0 |
| C | 0 | 104 | 0 |
| D | 0 | 104 | 0 |
| Quadrant | Total seconds | Saturated seconds | Saturation percentage |
|---|---|---|---|
| A | 5141 | 18 | 0.350126% |
| B | 5141 | 237 | 4.609998% |
| C | 5141 | 3 | 0.058354% |
| D | 5141 | 180 | 3.501264% |
Noise dominated data is calculated using 1-second bins in cleaned event files. If a bin has >2000 counts, and if more than 50% of those come from <1% of pixels, then it is considered to be noise-dominated and hence unusable.
| Quadrant | # 1 sec bins | Bins with >0 counts | Bins with >2000 counts | High rate bins dominated by noise | Noise dominated (total time) | Noise dominated (detector-on time) | Marked lightcurve |
|---|---|---|---|---|---|---|---|
| A | 7173 | 5142 | 8 | 8 | 0.11% | 0.16% | 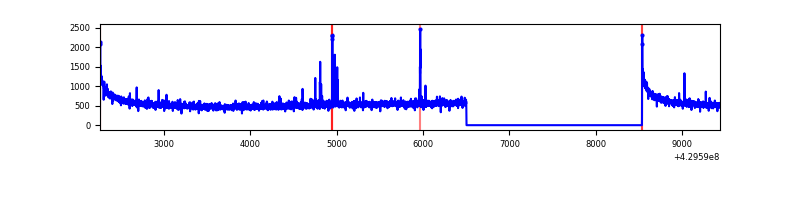 |
| B | 7173 | 5142 | 221 | 221 | 3.08% | 4.30% | 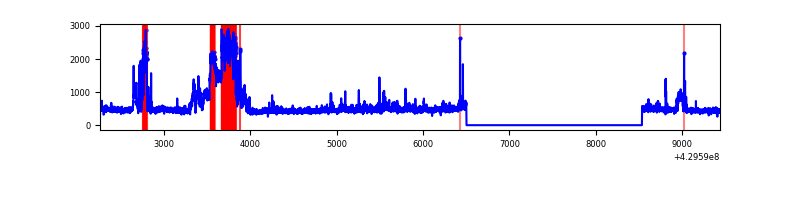 |
| C | 7173 | 5142 | 0 | 0 | 0.00% | 0.00% | 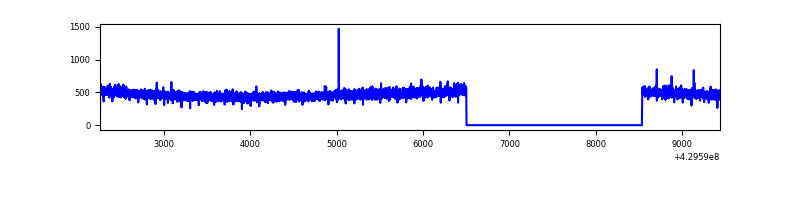 |
| D | 7173 | 5142 | 149 | 149 | 2.08% | 2.90% | 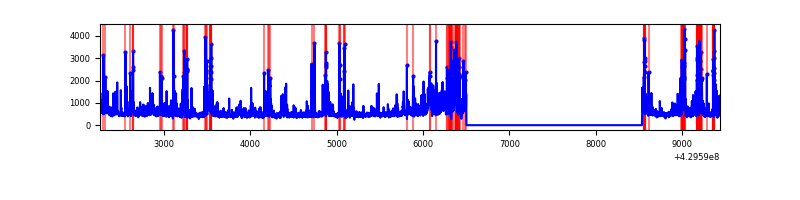 |
Top three noisy pixels from each quadrant. If the there are fewer than three noisy pixels in the level2.evt file, extra rows are filled as -1
| Pixel properties | Quadrant properties | ||||||
|---|---|---|---|---|---|---|---|
| Quadrant | DetID | PixID | Counts | Sigma | Mean | Median | Sigma |
| A | 10 | 83 | 564452 | 4754.97 | 581 | 570 | 118.6 |
| A | 2 | 79 | 22211 | 182.49 | 581 | 570 | 118.6 |
| A | 7 | 3 | 21634 | 177.62 | 581 | 570 | 118.6 |
| B | 5 | 172 | 862850 | 8025.02 | 569 | 554 | 107.5 |
| B | 0 | 245 | 58419 | 538.52 | 569 | 554 | 107.5 |
| B | 3 | 112 | 19811 | 179.22 | 569 | 554 | 107.5 |
| C | 15 | 214 | 215996 | 1676.73 | 555 | 557 | 128.5 |
| C | 7 | 220 | 5199 | 36.13 | 555 | 557 | 128.5 |
| C | 13 | 61 | 3751 | 24.86 | 555 | 557 | 128.5 |
| D | 1 | 52 | 606639 | 4536.07 | 552 | 537 | 133.6 |
| D | 1 | 47 | 290449 | 2169.7 | 552 | 537 | 133.6 |
| D | 12 | 6 | 173382 | 1293.57 | 552 | 537 | 133.6 |
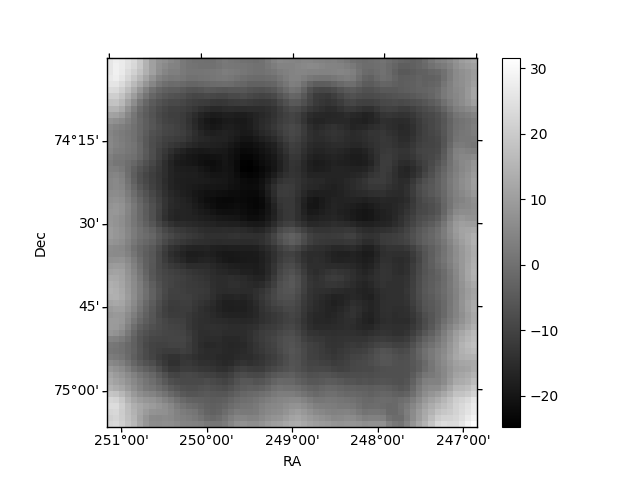
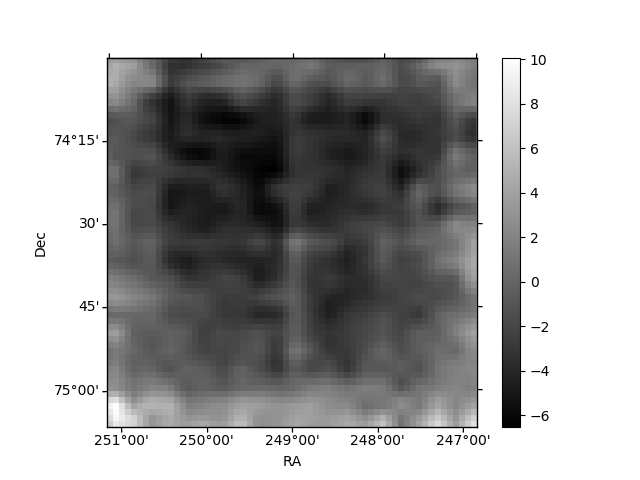
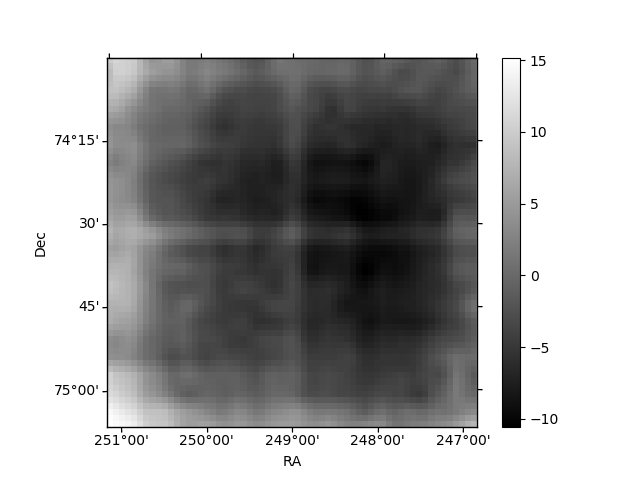
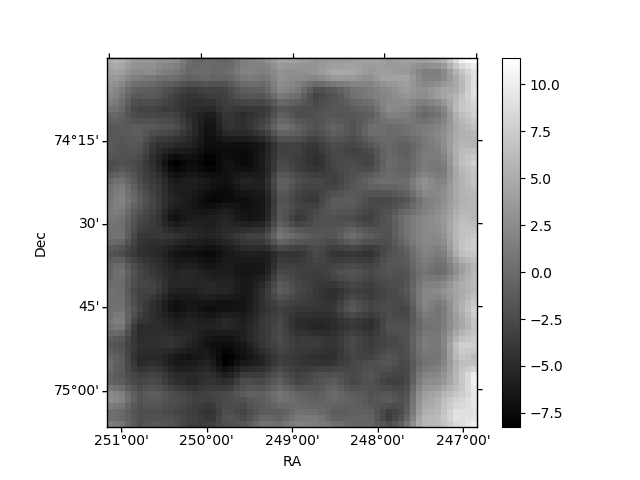
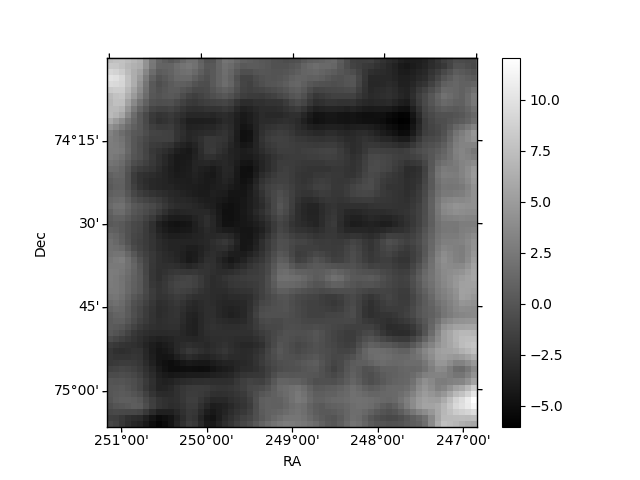
Histogram calculated using DETX and DETY for each event in the final _common_clean file
| Quadrant A | 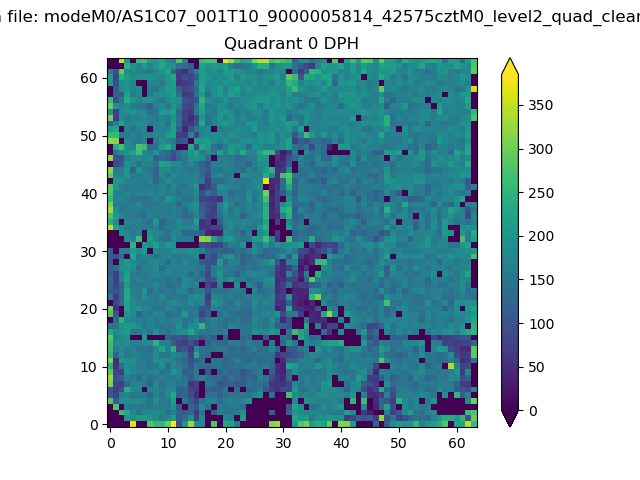 |
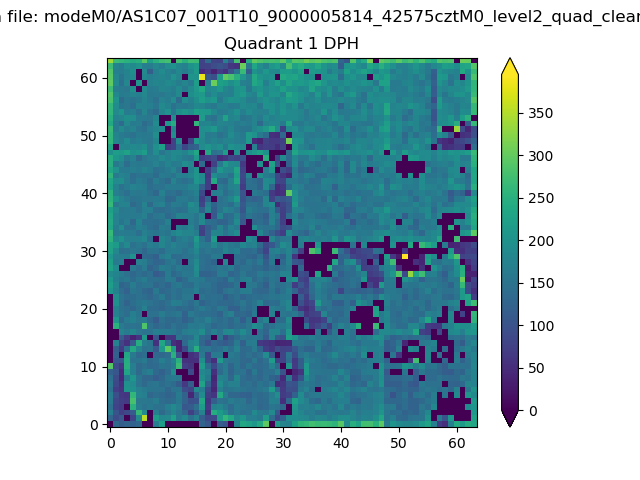 |
Quadrant B |
|---|---|---|---|
| Quadrant D | 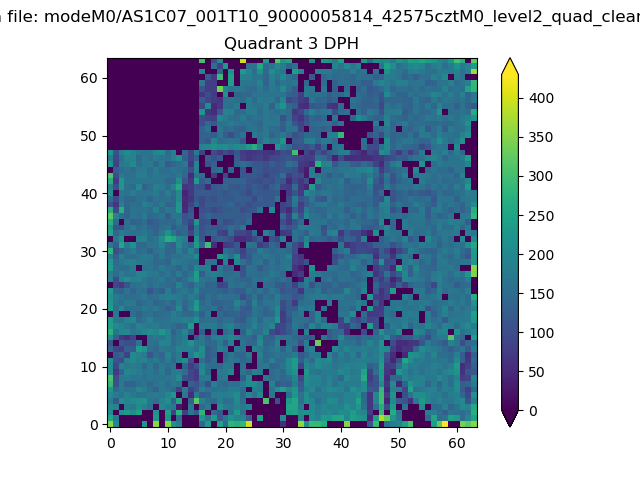 |
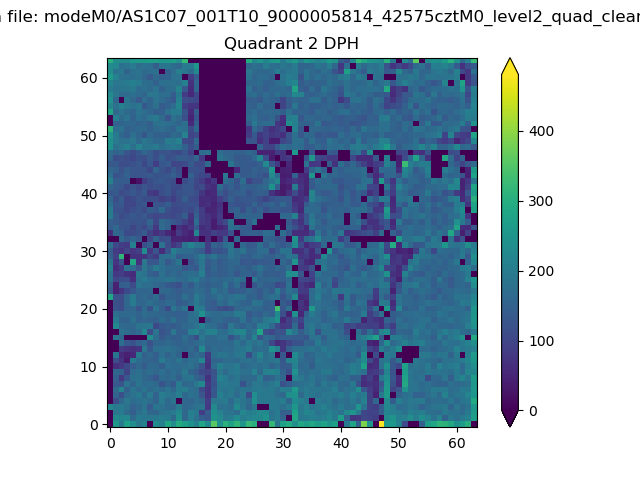 |
Quadrant C |
| Plot type | Count rate plots | Images |
|---|---|---|
| Comparison with Poisson distribution Blue bars denote a histogram of data divided into 1 sec bins. Red curve is a Poisson curve with rate = median count rate of data. |
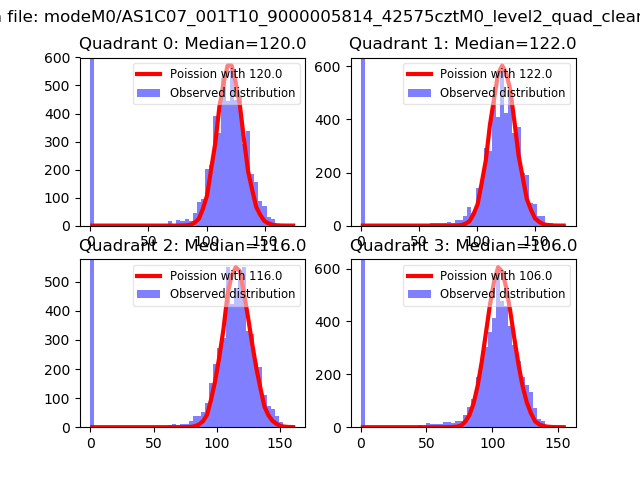 |
 |
| Quadrant-wise count rates Data is divided into 100 sec bins |
 |
|
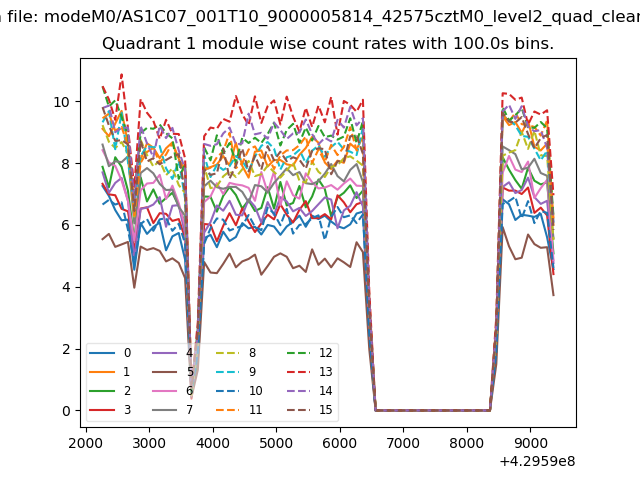
| Module-wise count rates for Quadrant A Data is divided into 100 sec bins |
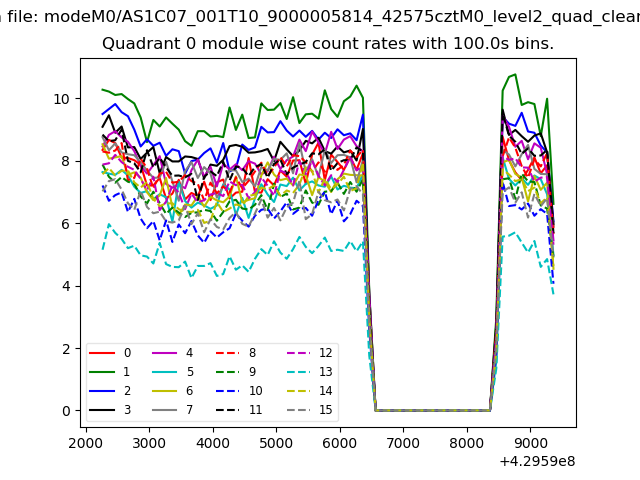 |
 |
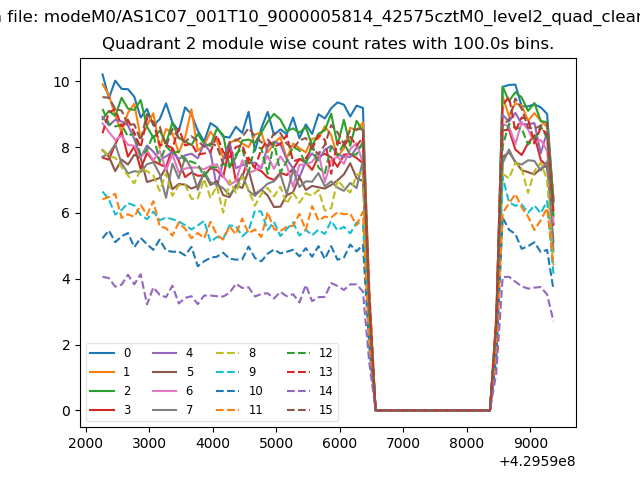
| Module-wise count rates for Quadrant B Data is divided into 100 sec bins |
 |
 |
| Module-wise count rates for Quadrant C Data is divided into 100 sec bins |
 |
 |
| Module-wise count rates for Quadrant D Data is divided into 100 sec bins |
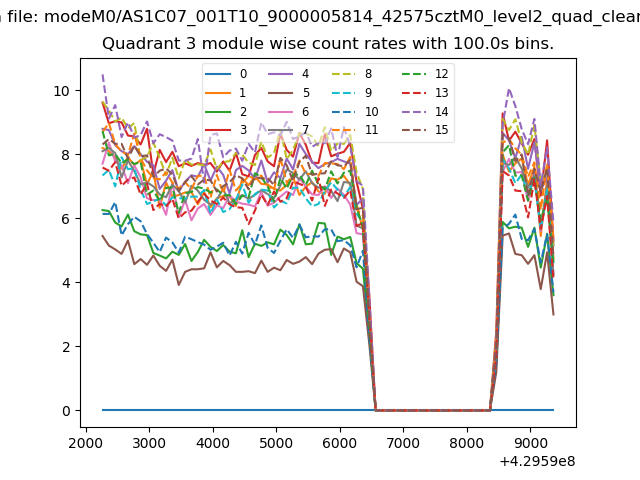 |
 |
| Parameter | Plot |
|---|---|
| CZT HV Monitor | 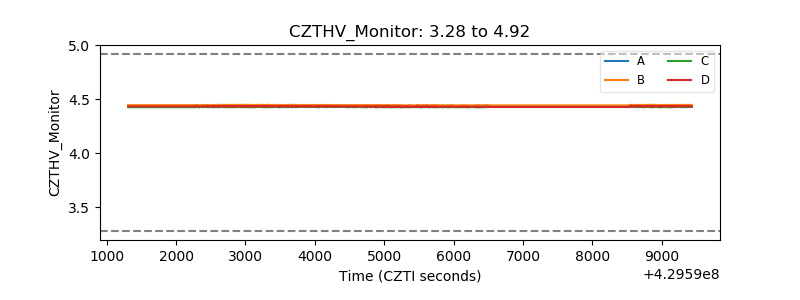 |
| D_VDD | 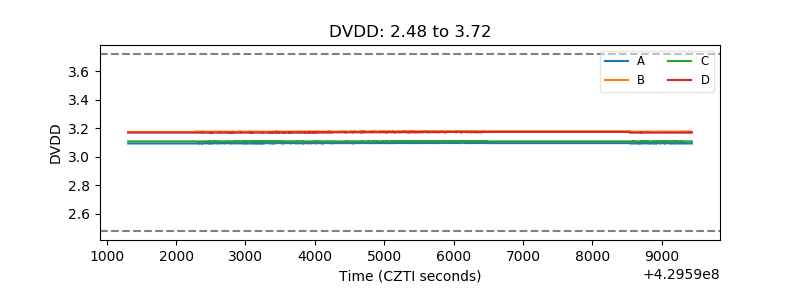 |
| Temperature 1 | 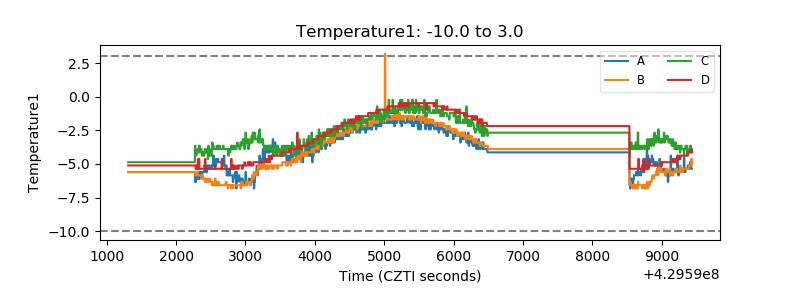 |
| Veto HV Monitor | 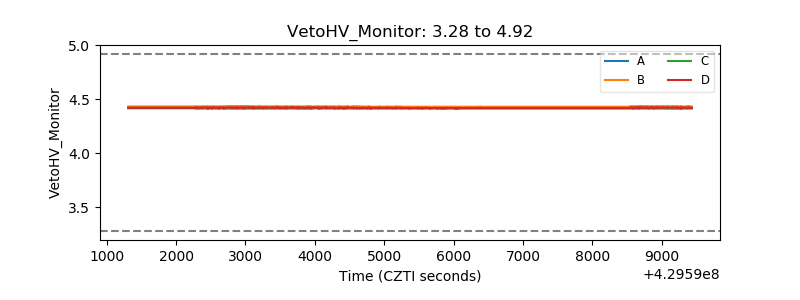 |
| Veto LLD | 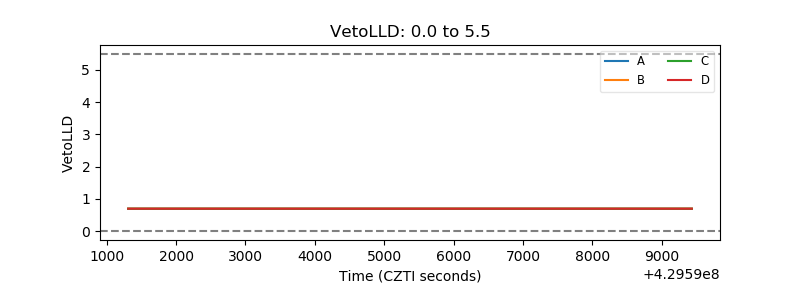 |
| Alpha Counter | 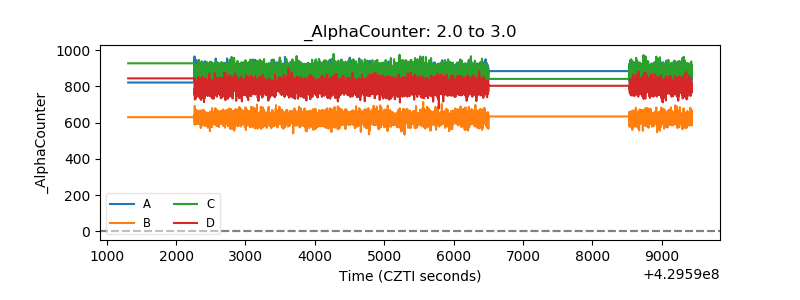 |
| _CPM_Rate |  |
| CZT Counter | 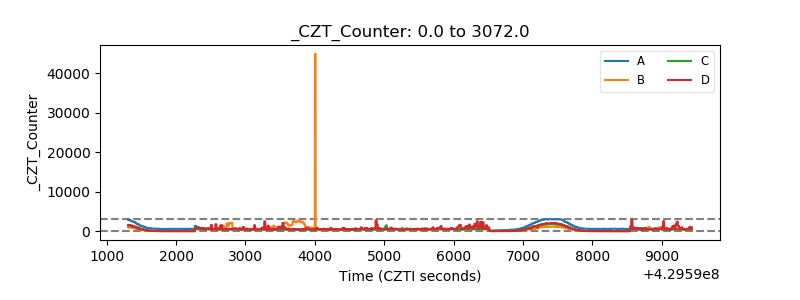 |
| +2.5 Volts monitor | 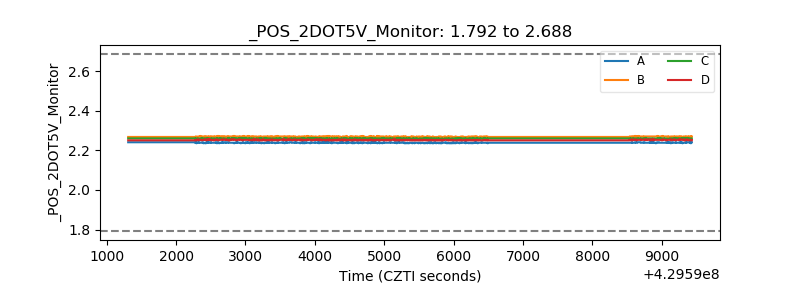 |
| +5 Volts monitor | 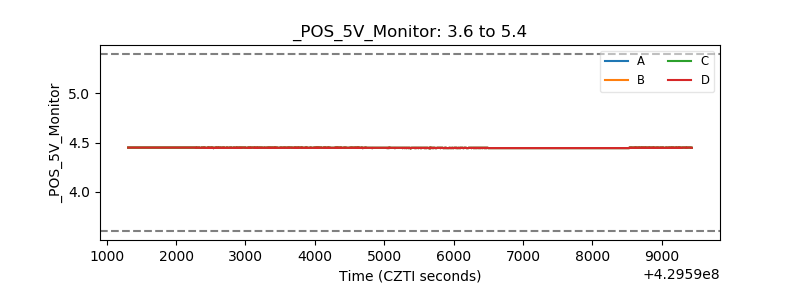 |
| _ROLL_ROT | 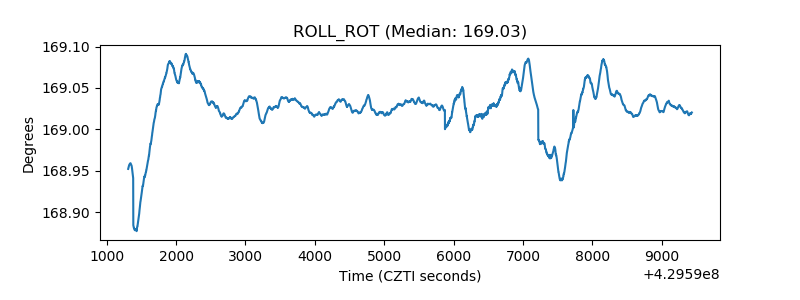 |
| _Roll_DEC | 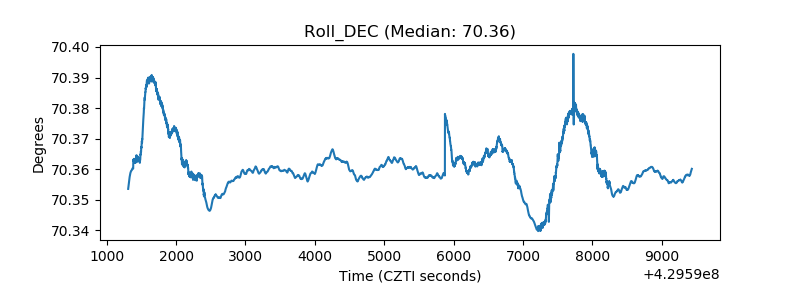 |
| _Roll_RA | 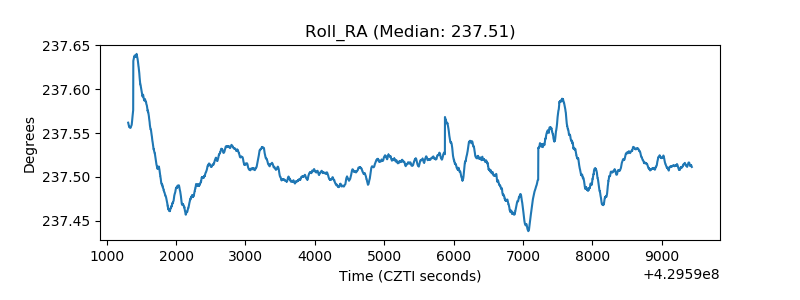 |
| Veto Counter | 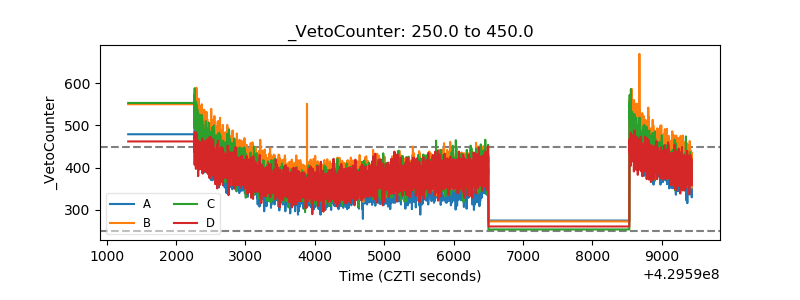 |