| Param | Original file | Final file |
|---|---|---|
| Filename | modeM0/AS1A12_061T07_9000005818_42580cztM0_level2.fits | modeM0/AS1A12_061T07_9000005818_42580cztM0_level2_quad_clean.evt |
| Size (bytes) | 339,238,080 | 93,038,400 |
| Size | 323.5 MB | 88.7 MB |
| Events in quadrant A | 3,105,813 | 619,655 |
| Events in quadrant B | 2,700,403 | 628,333 |
| Events in quadrant C | 2,674,659 | 611,224 |
| Events in quadrant D | 3,624,634 | 551,804 |
| Mode M0 | |||
|---|---|---|---|
| Quadrant | BADHDUFLAG | Total packets | Discarded packets |
| A | 0 | 12505 | 2 |
| B | 0 | 12127 | 4 |
| C | 0 | 11672 | 2 |
| D | 0 | 14723 | 2 |
| Mode SS | |||
|---|---|---|---|
| Quadrant | BADHDUFLAG | Total packets | Discarded packets |
| A | 0 | 120 | 0 |
| B | 0 | 120 | 0 |
| C | 0 | 120 | 0 |
| D | 0 | 120 | 0 |
| Mode M9 | |||
|---|---|---|---|
| Quadrant | BADHDUFLAG | Total packets | Discarded packets |
| A | 0 | 21 | 0 |
| B | 0 | 22 | 0 |
| C | 0 | 22 | 0 |
| D | 0 | 22 | 0 |
| Quadrant | Total seconds | Saturated seconds | Saturation percentage |
|---|---|---|---|
| A | 5803 | 12 | 0.206790% |
| B | 5802 | 49 | 0.844536% |
| C | 5802 | 2 | 0.034471% |
| D | 5802 | 164 | 2.826612% |
Noise dominated data is calculated using 1-second bins in cleaned event files. If a bin has >2000 counts, and if more than 50% of those come from <1% of pixels, then it is considered to be noise-dominated and hence unusable.
| Quadrant | # 1 sec bins | Bins with >0 counts | Bins with >2000 counts | High rate bins dominated by noise | Noise dominated (total time) | Noise dominated (detector-on time) | Marked lightcurve |
|---|---|---|---|---|---|---|---|
| A | 7235 | 5804 | 3 | 3 | 0.04% | 0.05% | 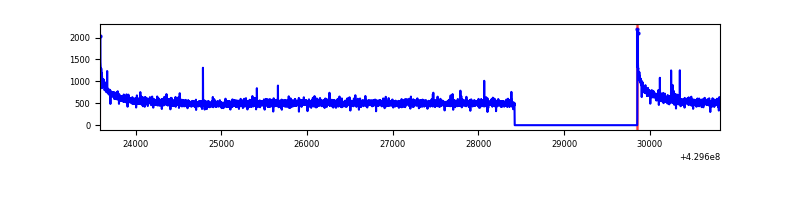 |
| B | 7234 | 5803 | 29 | 29 | 0.40% | 0.50% | 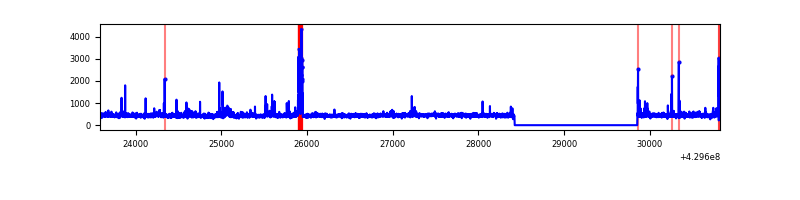 |
| C | 7234 | 5803 | 0 | 0 | 0.00% | 0.00% | 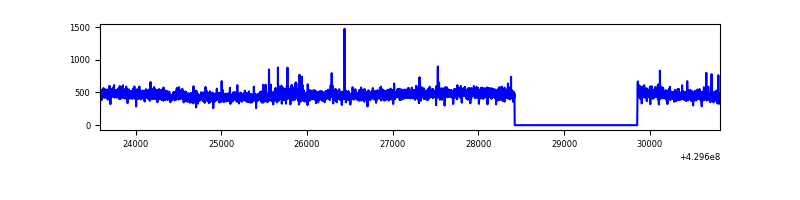 |
| D | 7234 | 5803 | 125 | 125 | 1.73% | 2.15% | 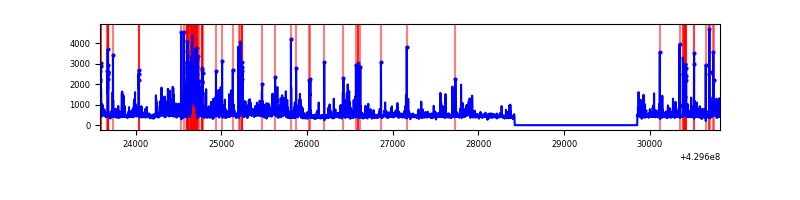 |
Top three noisy pixels from each quadrant. If the there are fewer than three noisy pixels in the level2.evt file, extra rows are filled as -1
| Pixel properties | Quadrant properties | ||||||
|---|---|---|---|---|---|---|---|
| Quadrant | DetID | PixID | Counts | Sigma | Mean | Median | Sigma |
| A | 10 | 83 | 630657 | 4872.42 | 629 | 615 | 129.3 |
| A | 13 | 6 | 16359 | 121.76 | 629 | 615 | 129.3 |
| A | 13 | 254 | 8345 | 59.78 | 629 | 615 | 129.3 |
| B | 15 | 35 | 104794 | 871.44 | 623 | 605 | 119.6 |
| B | 0 | 245 | 51217 | 423.32 | 623 | 605 | 119.6 |
| B | 5 | 255 | 20424 | 165.76 | 623 | 605 | 119.6 |
| C | 15 | 214 | 240767 | 1667.78 | 612 | 616 | 144.0 |
| C | 12 | 249 | 15775 | 105.28 | 612 | 616 | 144.0 |
| C | 3 | 233 | 14317 | 95.15 | 612 | 616 | 144.0 |
| D | 1 | 52 | 421835 | 2808.23 | 609 | 590 | 150.0 |
| D | 9 | 19 | 346743 | 2307.63 | 609 | 590 | 150.0 |
| D | 13 | 249 | 159238 | 1057.63 | 609 | 590 | 150.0 |
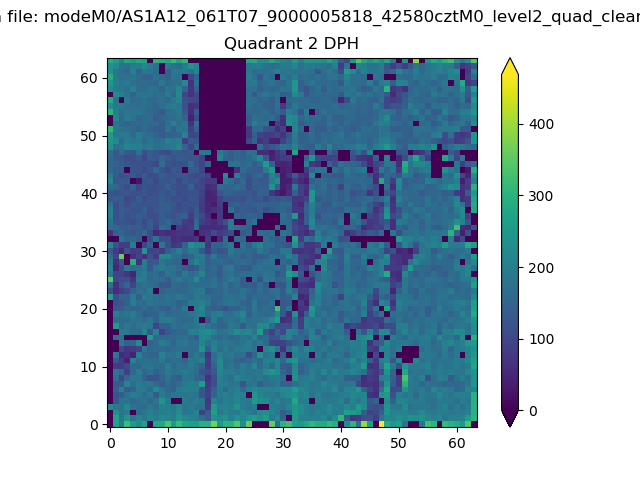
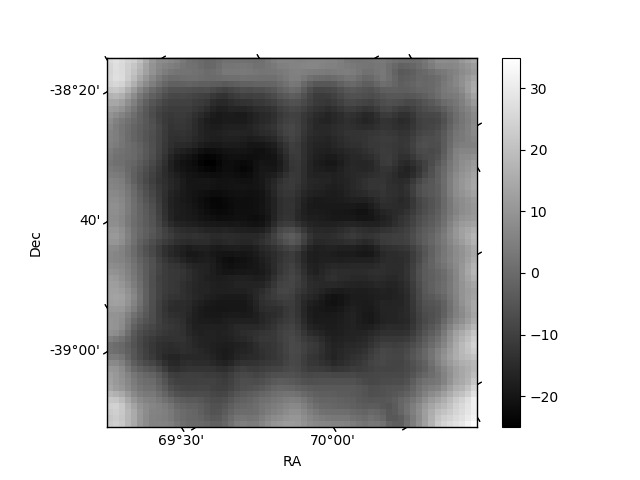
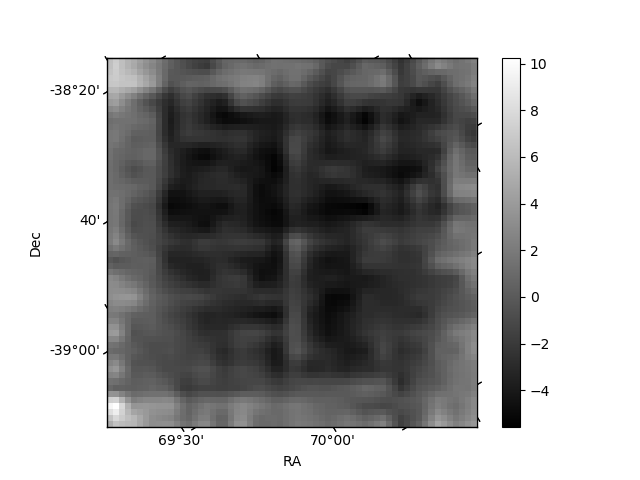
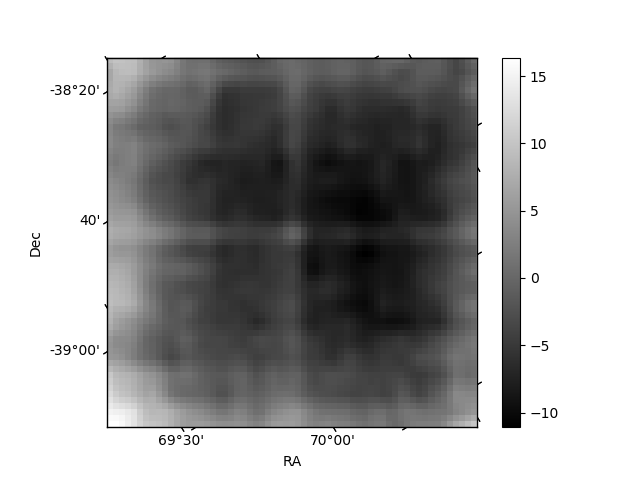
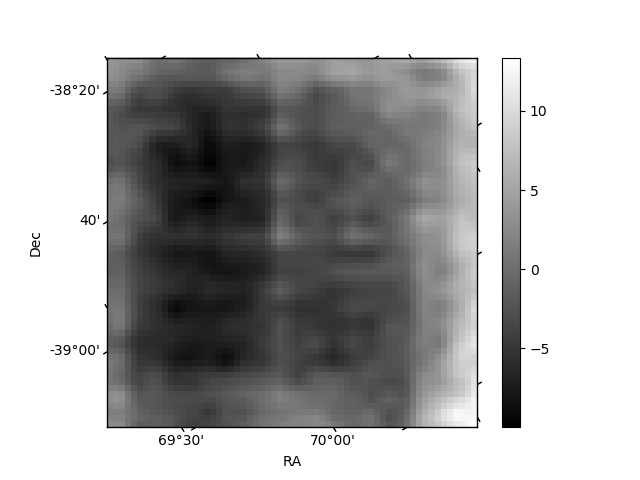
Histogram calculated using DETX and DETY for each event in the final _common_clean file
| Quadrant A | 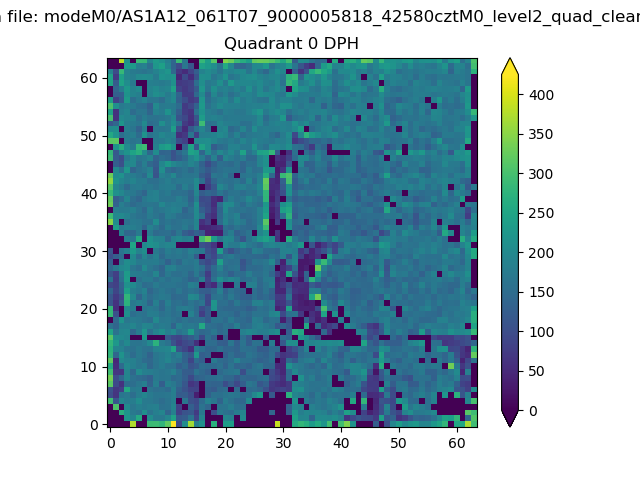 |
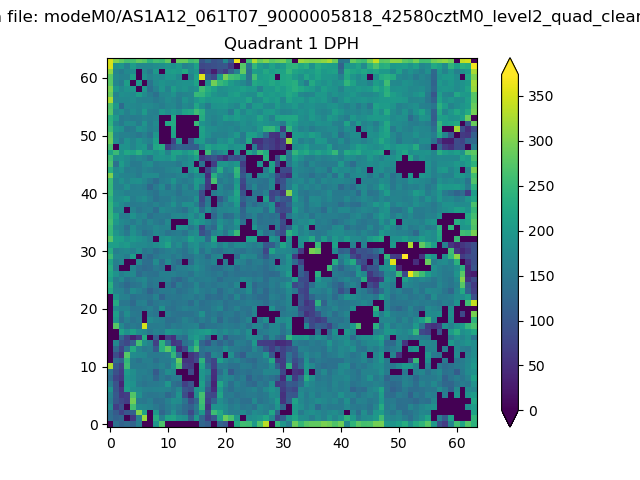 |
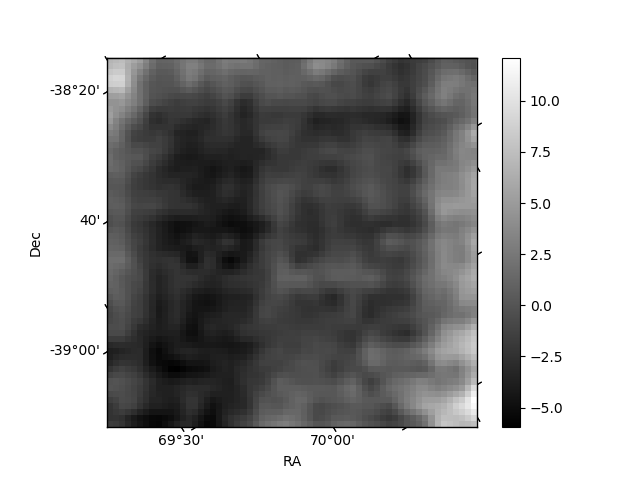
Quadrant B |
|---|---|---|---|
| Quadrant D | 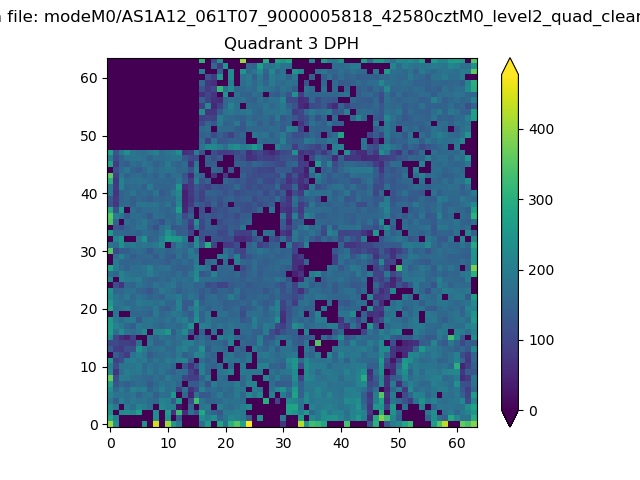 |
 |
Quadrant C |
| Plot type | Count rate plots | Images |
|---|---|---|
| Comparison with Poisson distribution Blue bars denote a histogram of data divided into 1 sec bins. Red curve is a Poisson curve with rate = median count rate of data. |
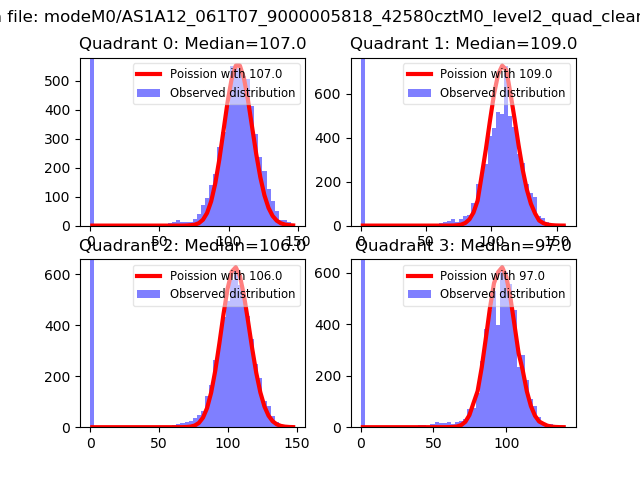 |
 |
| Quadrant-wise count rates Data is divided into 100 sec bins |
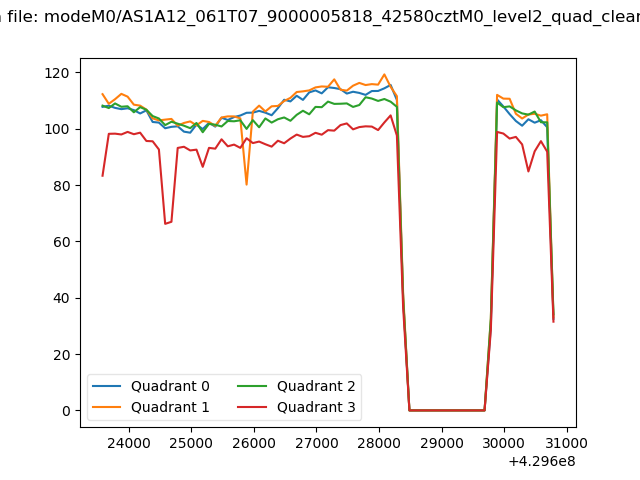 |
|
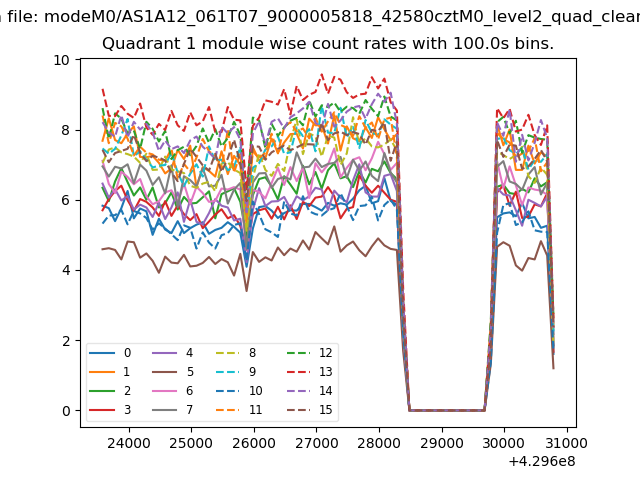
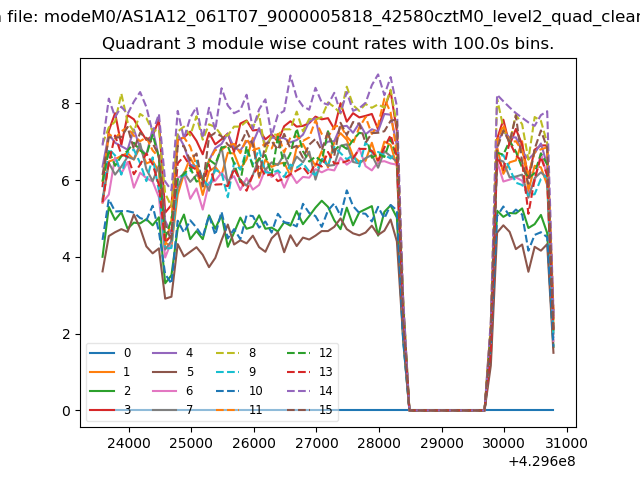
| Module-wise count rates for Quadrant A Data is divided into 100 sec bins |
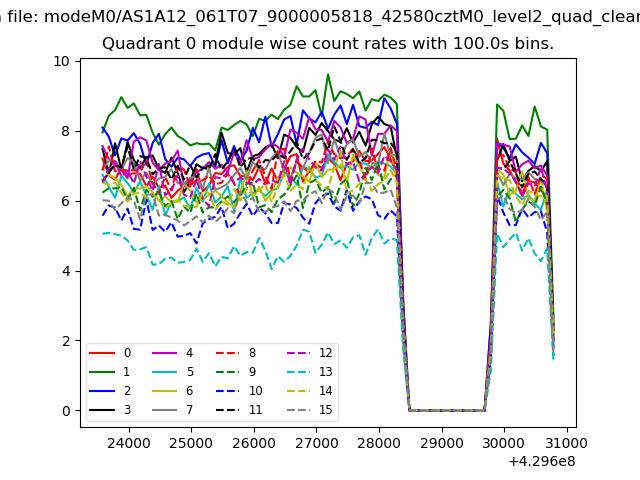 |
 |
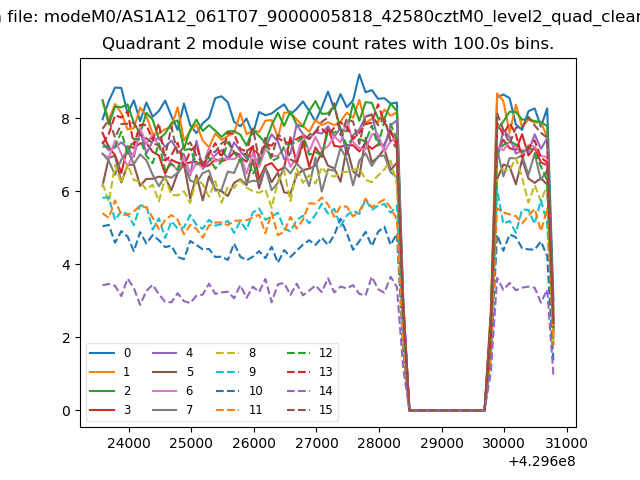
| Module-wise count rates for Quadrant B Data is divided into 100 sec bins |
 |
 |
| Module-wise count rates for Quadrant C Data is divided into 100 sec bins |
 |
 |
| Module-wise count rates for Quadrant D Data is divided into 100 sec bins |
 |
 |
| Parameter | Plot |
|---|---|
| CZT HV Monitor | 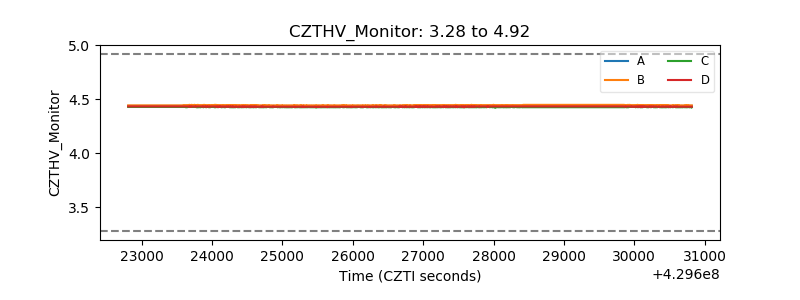 |
| D_VDD | 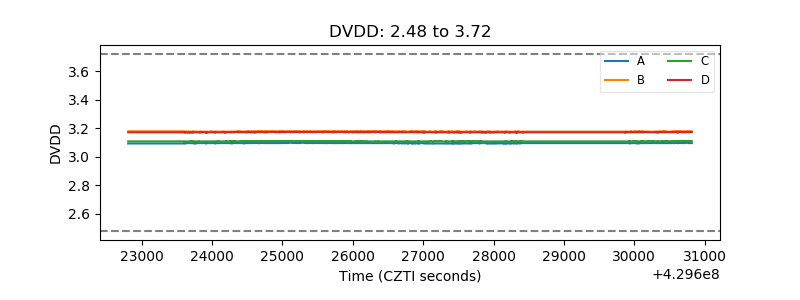 |
| Temperature 1 | 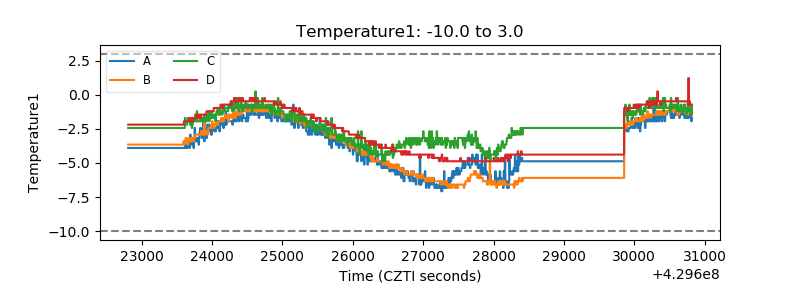 |
| Veto HV Monitor | 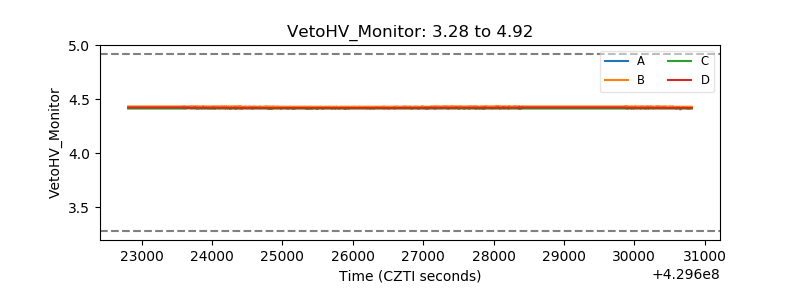 |
| Veto LLD | 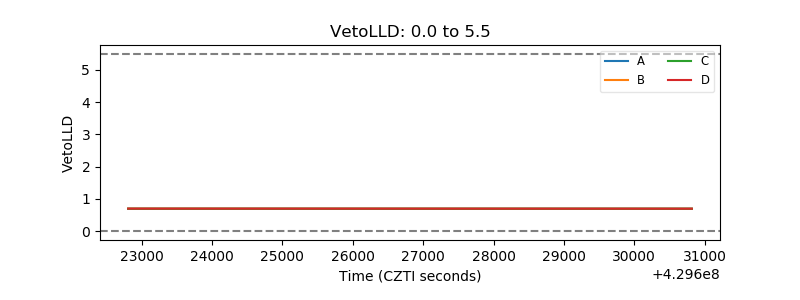 |
| Alpha Counter | 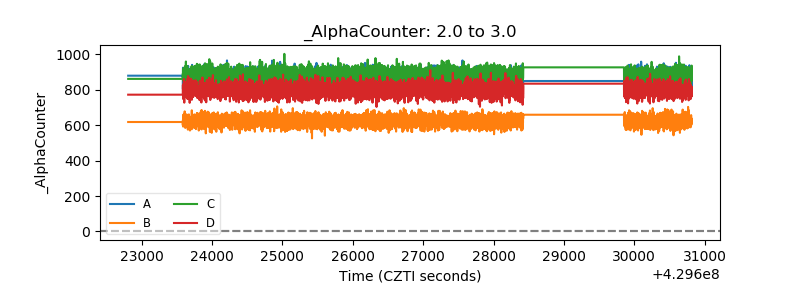 |
| _CPM_Rate | 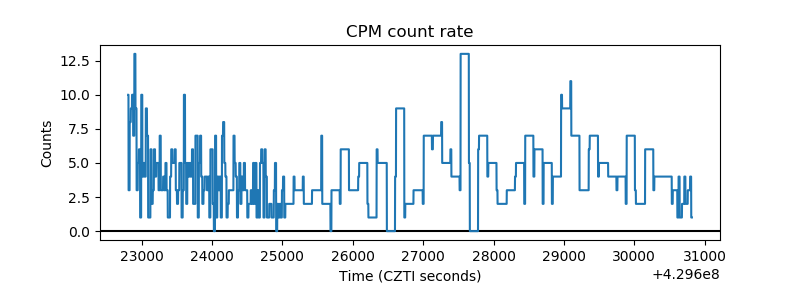 |
| CZT Counter | 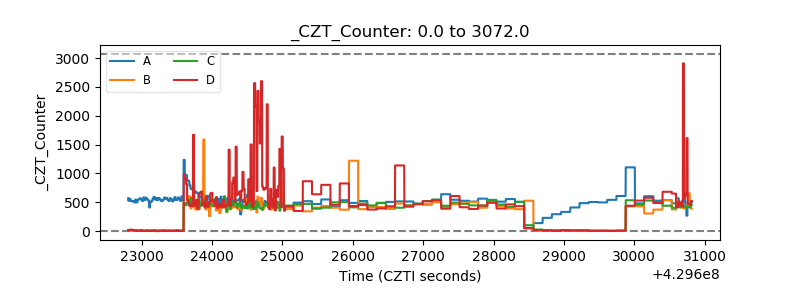 |
| +2.5 Volts monitor | 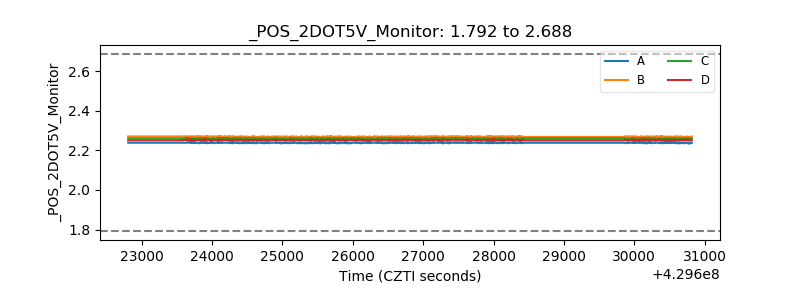 |
| +5 Volts monitor |  |
| _ROLL_ROT | 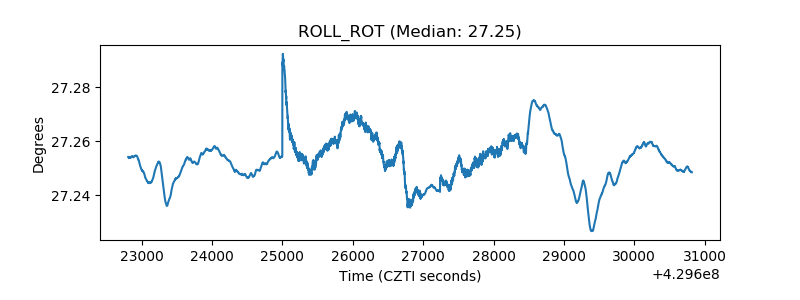 |
| _Roll_DEC | 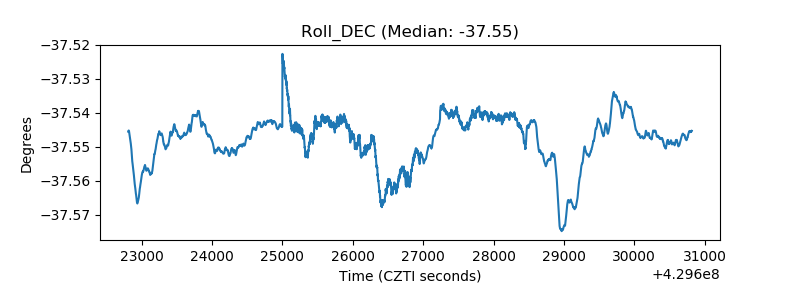 |
| _Roll_RA | 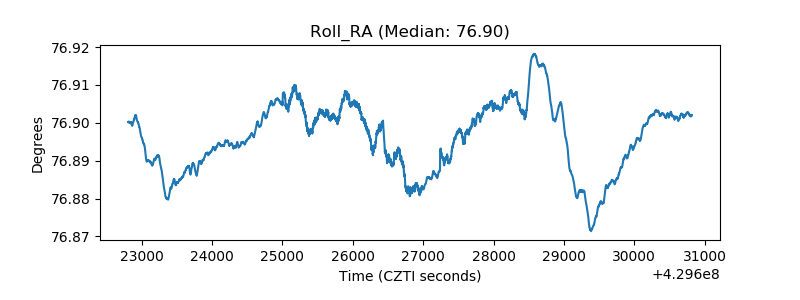 |
| Veto Counter | 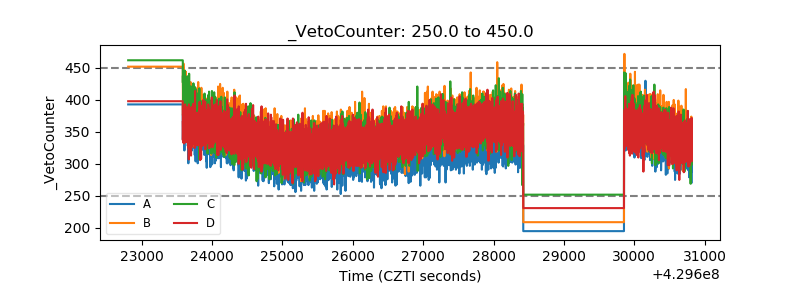 |