| Param | Original file | Final file |
|---|---|---|
| Filename | modeM0/AS1A12_061T07_9000005818_42581cztM0_level2.fits | modeM0/AS1A12_061T07_9000005818_42581cztM0_level2_quad_clean.evt |
| Size (bytes) | 334,186,560 | 93,182,400 |
| Size | 318.7 MB | 88.9 MB |
| Events in quadrant A | 3,096,096 | 618,935 |
| Events in quadrant B | 2,709,501 | 630,071 |
| Events in quadrant C | 2,662,738 | 609,408 |
| Events in quadrant D | 3,449,116 | 556,550 |
| Mode M0 | |||
|---|---|---|---|
| Quadrant | BADHDUFLAG | Total packets | Discarded packets |
| A | 0 | 12556 | 7 |
| B | 0 | 12150 | 3 |
| C | 0 | 11687 | 2 |
| D | 0 | 14243 | 5 |
| Mode SS | |||
|---|---|---|---|
| Quadrant | BADHDUFLAG | Total packets | Discarded packets |
| A | 0 | 118 | 0 |
| B | 0 | 118 | 0 |
| C | 0 | 118 | 0 |
| D | 0 | 118 | 0 |
| Mode M9 | |||
|---|---|---|---|
| Quadrant | BADHDUFLAG | Total packets | Discarded packets |
| A | 0 | 18 | 0 |
| B | 0 | 19 | 0 |
| C | 0 | 19 | 0 |
| D | 0 | 19 | 0 |
| Quadrant | Total seconds | Saturated seconds | Saturation percentage |
|---|---|---|---|
| A | 5814 | 14 | 0.240798% |
| B | 5815 | 36 | 0.619089% |
| C | 5816 | 2 | 0.034388% |
| D | 5814 | 107 | 1.840385% |
Noise dominated data is calculated using 1-second bins in cleaned event files. If a bin has >2000 counts, and if more than 50% of those come from <1% of pixels, then it is considered to be noise-dominated and hence unusable.
| Quadrant | # 1 sec bins | Bins with >0 counts | Bins with >2000 counts | High rate bins dominated by noise | Noise dominated (total time) | Noise dominated (detector-on time) | Marked lightcurve |
|---|---|---|---|---|---|---|---|
| A | 7129 | 5817 | 5 | 5 | 0.07% | 0.09% | 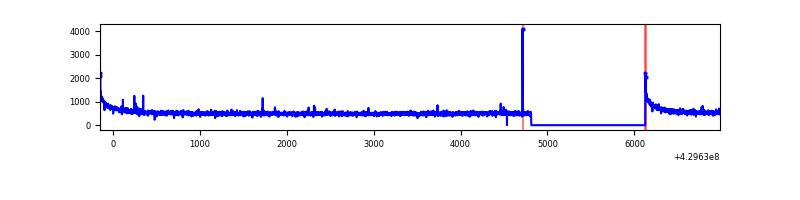 |
| B | 7128 | 5817 | 14 | 14 | 0.20% | 0.24% | 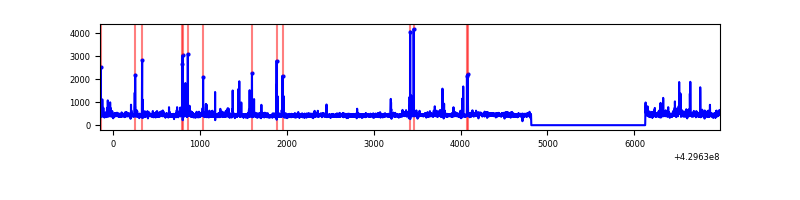 |
| C | 7128 | 5817 | 0 | 0 | 0.00% | 0.00% | 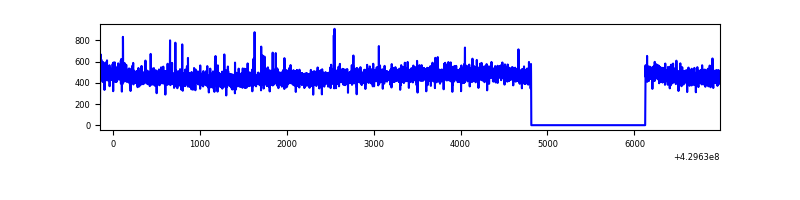 |
| D | 7128 | 5816 | 98 | 98 | 1.37% | 1.69% | 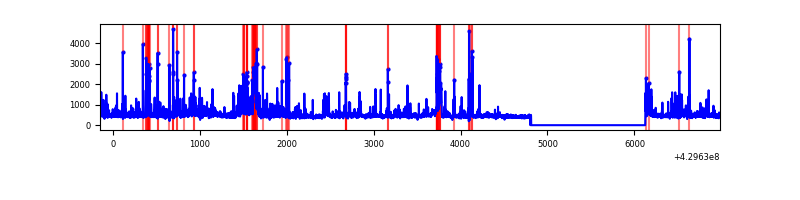 |
Top three noisy pixels from each quadrant. If the there are fewer than three noisy pixels in the level2.evt file, extra rows are filled as -1
| Pixel properties | Quadrant properties | ||||||
|---|---|---|---|---|---|---|---|
| Quadrant | DetID | PixID | Counts | Sigma | Mean | Median | Sigma |
| A | 10 | 83 | 628205 | 4840.26 | 629 | 616 | 129.7 |
| A | 13 | 6 | 9858 | 71.28 | 629 | 616 | 129.7 |
| A | 15 | 237 | 7475 | 52.9 | 629 | 616 | 129.7 |
| B | 0 | 245 | 77734 | 636.29 | 624 | 606 | 121.2 |
| B | 3 | 112 | 47125 | 383.77 | 624 | 606 | 121.2 |
| B | 5 | 172 | 46967 | 382.47 | 624 | 606 | 121.2 |
| C | 15 | 214 | 240560 | 1668.77 | 613 | 616 | 143.8 |
| C | 12 | 249 | 14159 | 94.19 | 613 | 616 | 143.8 |
| C | 3 | 233 | 9369 | 60.88 | 613 | 616 | 143.8 |
| D | 1 | 52 | 491849 | 3283.23 | 611 | 593 | 149.6 |
| D | 2 | 249 | 158509 | 1055.41 | 611 | 593 | 149.6 |
| D | 12 | 233 | 117213 | 779.41 | 611 | 593 | 149.6 |
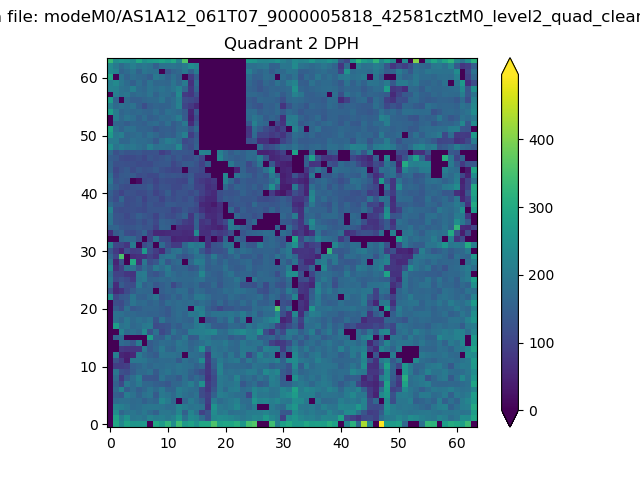
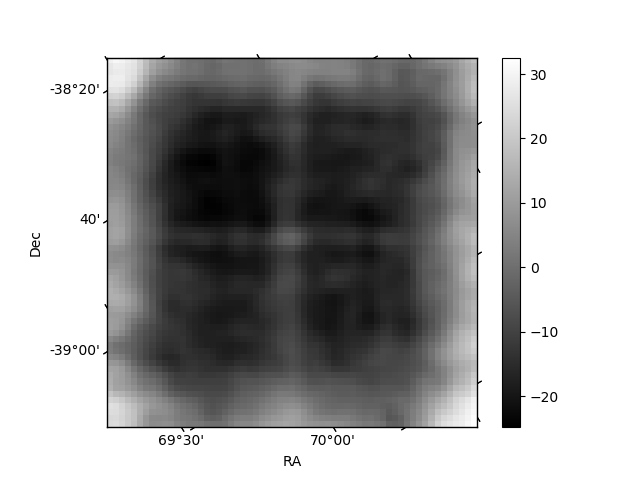
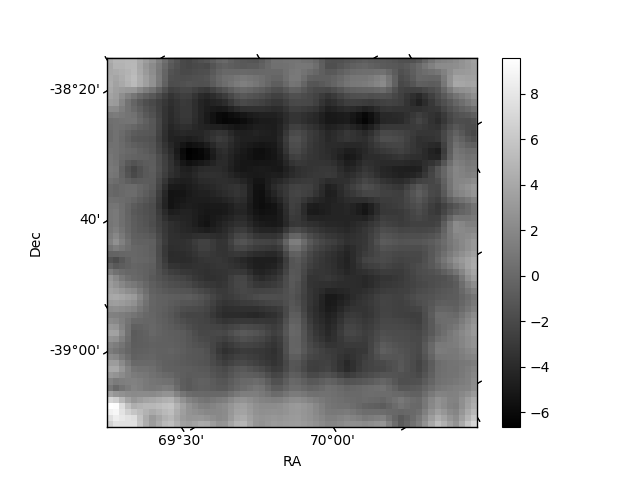
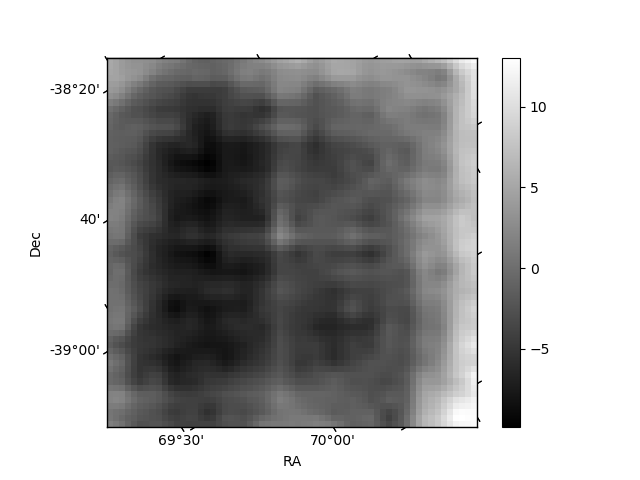
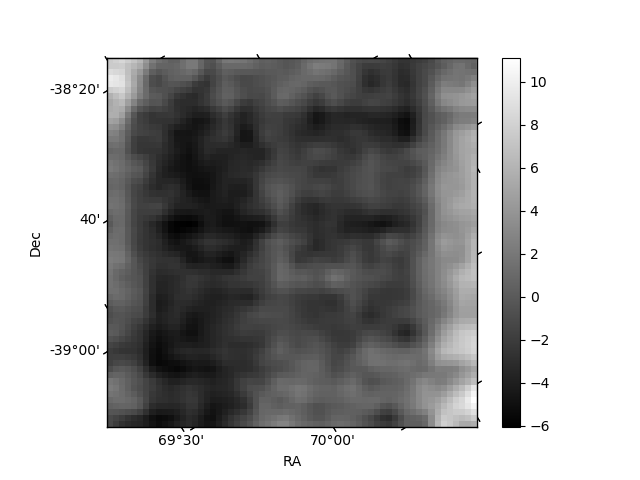
Histogram calculated using DETX and DETY for each event in the final _common_clean file
| Quadrant A | 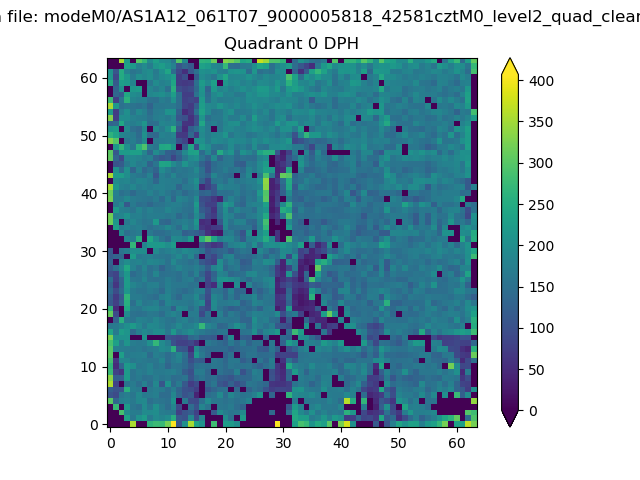 |
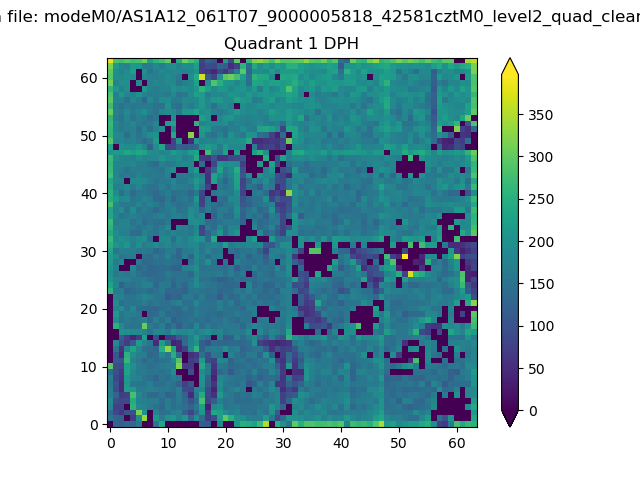 |
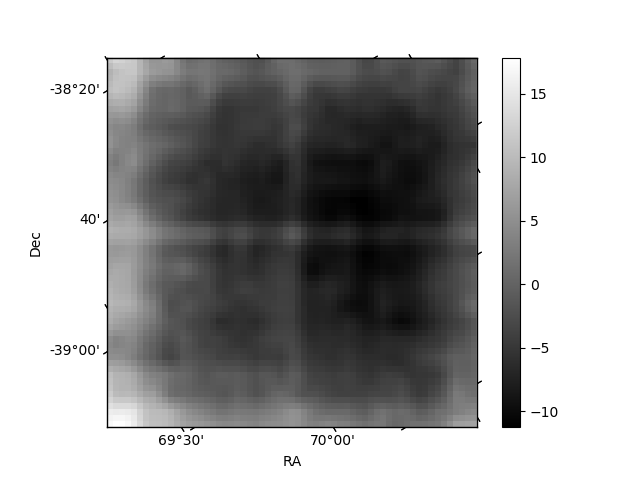
Quadrant B |
|---|---|---|---|
| Quadrant D | 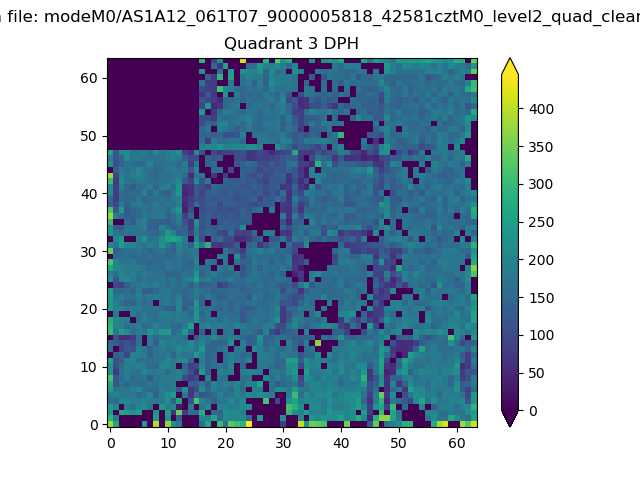 |
 |
Quadrant C |
| Plot type | Count rate plots | Images |
|---|---|---|
| Comparison with Poisson distribution Blue bars denote a histogram of data divided into 1 sec bins. Red curve is a Poisson curve with rate = median count rate of data. |
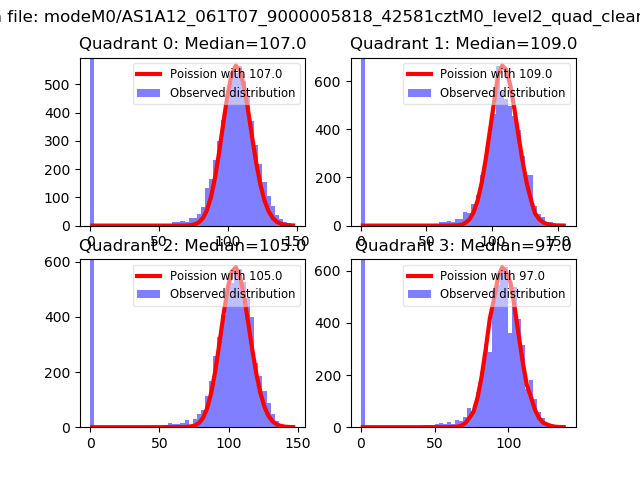 |
 |
| Quadrant-wise count rates Data is divided into 100 sec bins |
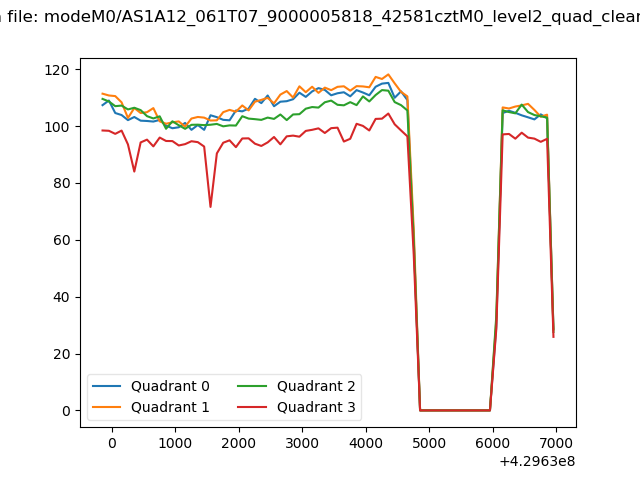 |
|
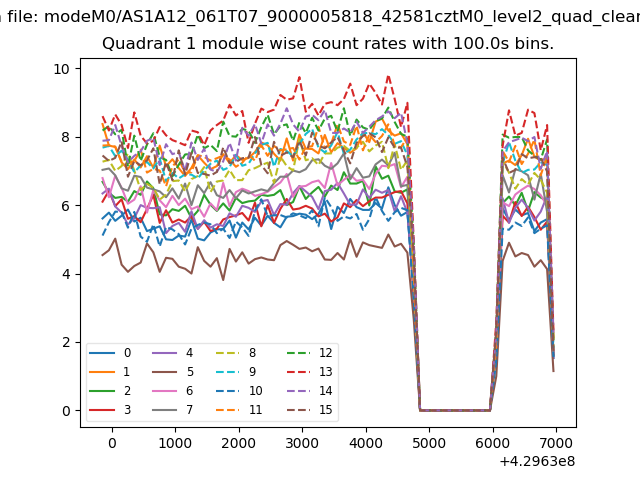
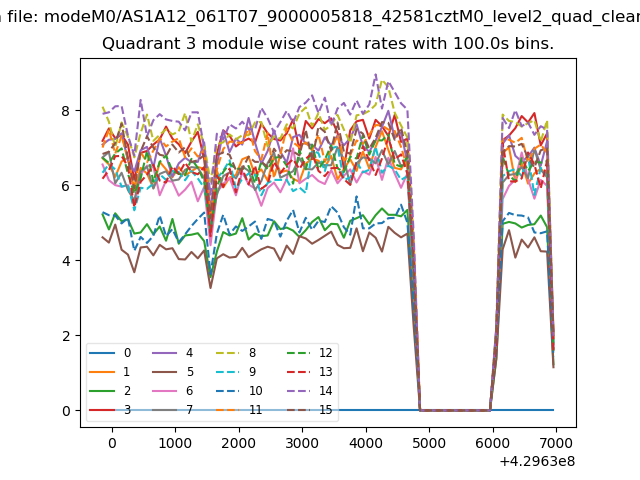
| Module-wise count rates for Quadrant A Data is divided into 100 sec bins |
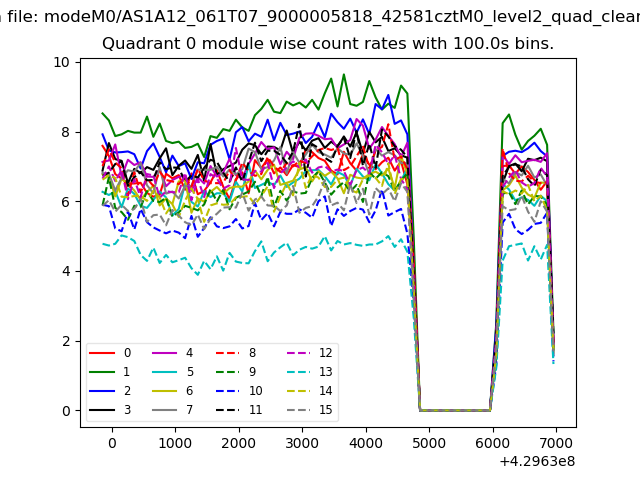 |
 |
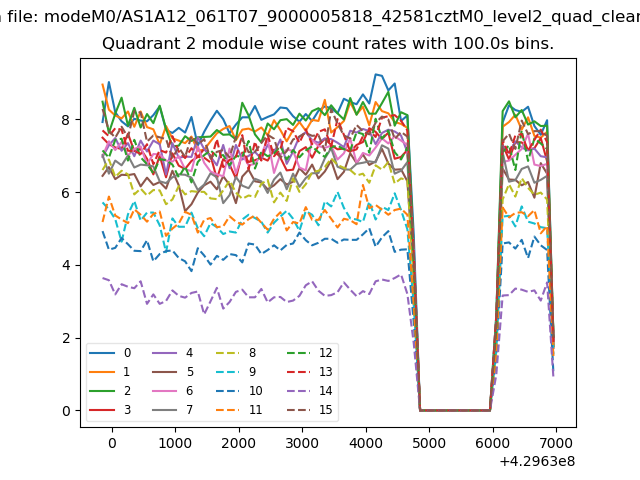
| Module-wise count rates for Quadrant B Data is divided into 100 sec bins |
 |
 |
| Module-wise count rates for Quadrant C Data is divided into 100 sec bins |
 |
 |
| Module-wise count rates for Quadrant D Data is divided into 100 sec bins |
 |
 |
| Parameter | Plot |
|---|---|
| CZT HV Monitor | 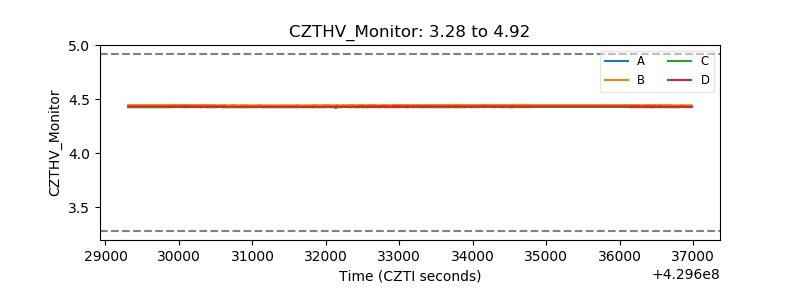 |
| D_VDD |  |
| Temperature 1 | 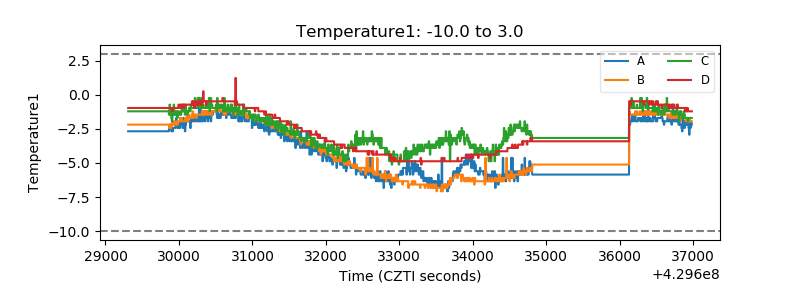 |
| Veto HV Monitor | 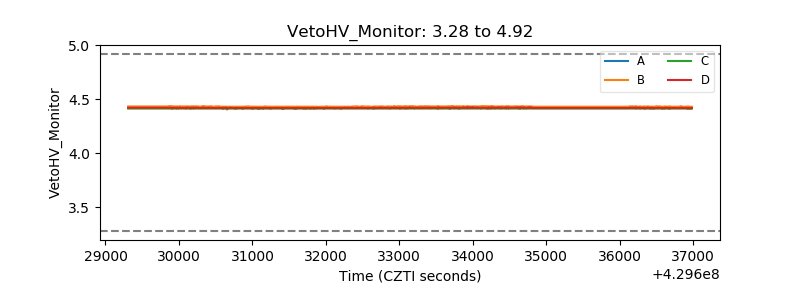 |
| Veto LLD | 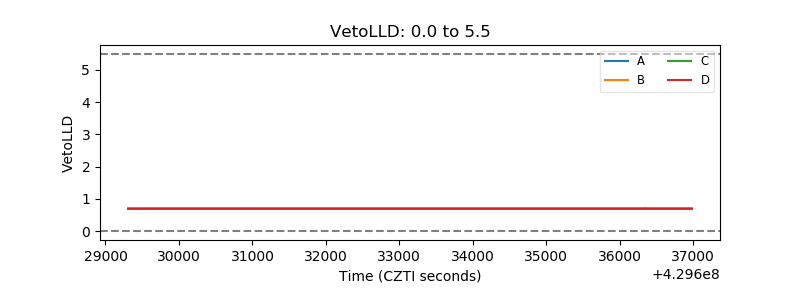 |
| Alpha Counter | 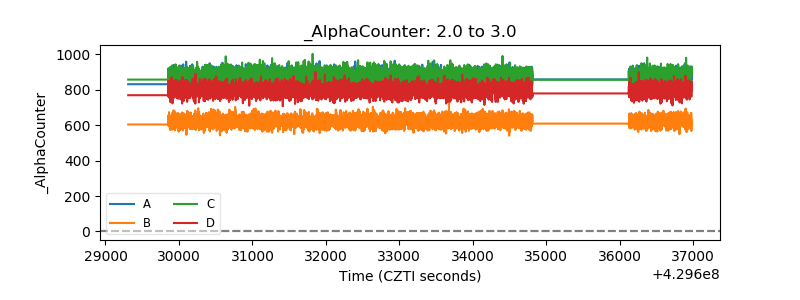 |
| _CPM_Rate | 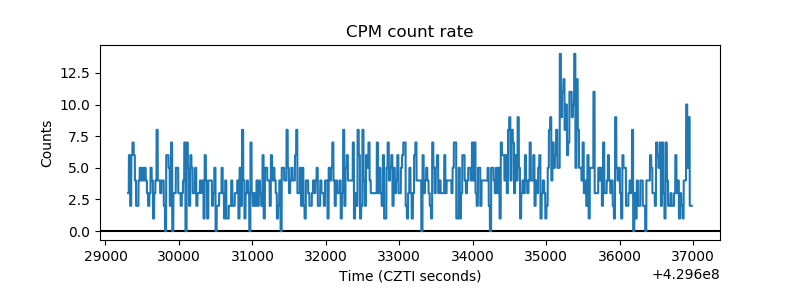 |
| CZT Counter | 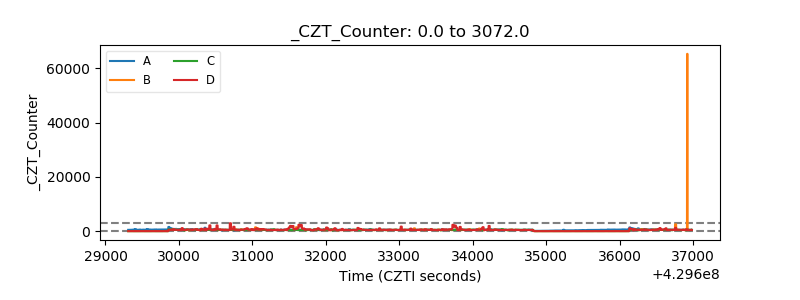 |
| +2.5 Volts monitor | 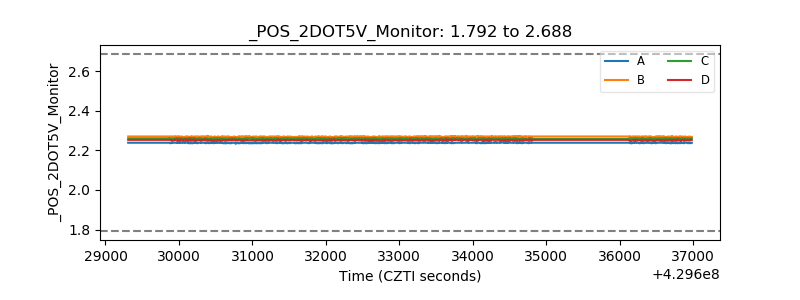 |
| +5 Volts monitor | 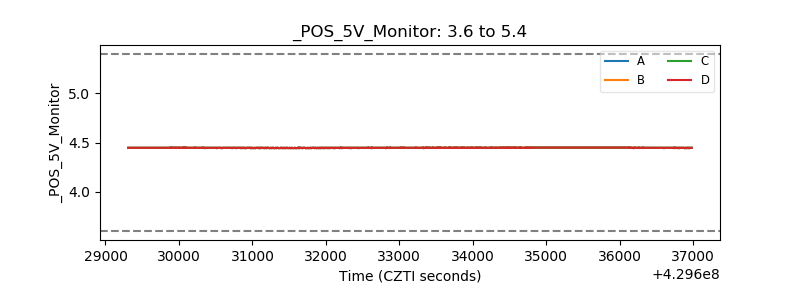 |
| _ROLL_ROT | 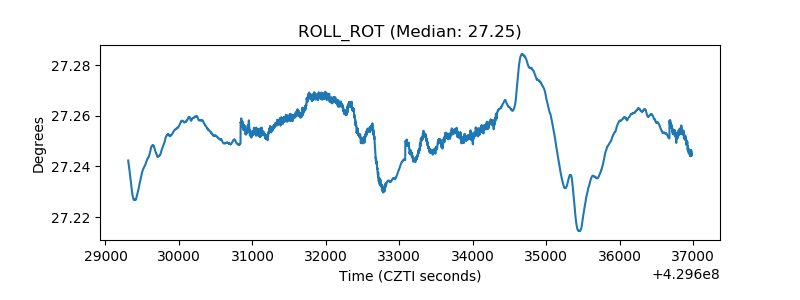 |
| _Roll_DEC | 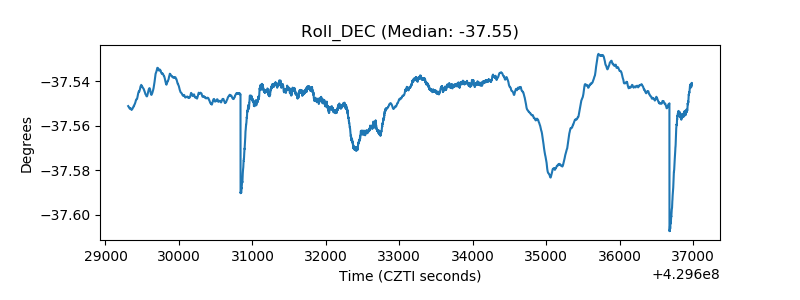 |
| _Roll_RA | 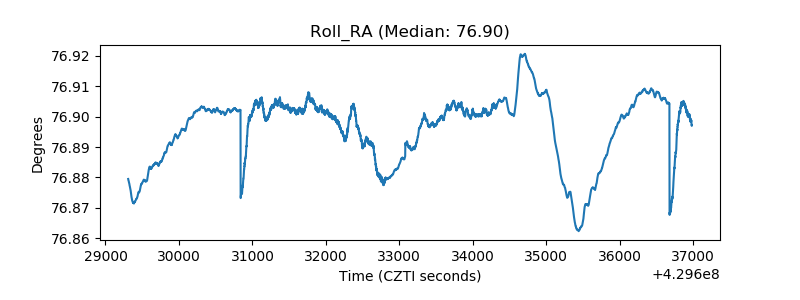 |
| Veto Counter | 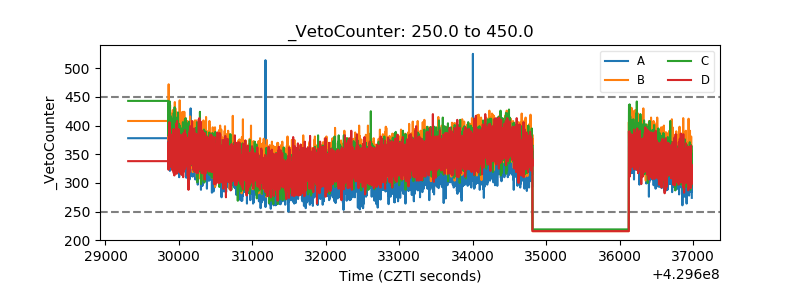 |