| Param | Original file | Final file |
|---|---|---|
| Filename | modeM0/AS1A12_061T07_9000005818_42584cztM0_level2.fits | modeM0/AS1A12_061T07_9000005818_42584cztM0_level2_quad_clean.evt |
| Size (bytes) | 909,993,600 | 247,052,160 |
| Size | 867.8 MB | 235.6 MB |
| Events in quadrant A | 8,153,030 | 1,653,418 |
| Events in quadrant B | 7,178,827 | 1,690,930 |
| Events in quadrant C | 7,565,989 | 1,612,626 |
| Events in quadrant D | 9,578,669 | 1,446,982 |
| Mode M0 | |||
|---|---|---|---|
| Quadrant | BADHDUFLAG | Total packets | Discarded packets |
| A | 0 | 33440 | 4 |
| B | 0 | 32401 | 4 |
| C | 0 | 32503 | 4 |
| D | 0 | 39386 | 5 |
| Mode SS | |||
|---|---|---|---|
| Quadrant | BADHDUFLAG | Total packets | Discarded packets |
| A | 0 | 318 | 0 |
| B | 0 | 318 | 0 |
| C | 0 | 318 | 0 |
| D | 0 | 318 | 0 |
| Mode M9 | |||
|---|---|---|---|
| Quadrant | BADHDUFLAG | Total packets | Discarded packets |
| A | 0 | 44 | 0 |
| B | 0 | 44 | 0 |
| C | 0 | 45 | 0 |
| D | 0 | 45 | 0 |
| Quadrant | Total seconds | Saturated seconds | Saturation percentage |
|---|---|---|---|
| A | 15590 | 53 | 0.339962% |
| B | 15590 | 78 | 0.500321% |
| C | 15590 | 32 | 0.205260% |
| D | 15589 | 507 | 3.252293% |
Noise dominated data is calculated using 1-second bins in cleaned event files. If a bin has >2000 counts, and if more than 50% of those come from <1% of pixels, then it is considered to be noise-dominated and hence unusable.
| Quadrant | # 1 sec bins | Bins with >0 counts | Bins with >2000 counts | High rate bins dominated by noise | Noise dominated (total time) | Noise dominated (detector-on time) | Marked lightcurve |
|---|---|---|---|---|---|---|---|
| A | 19769 | 15593 | 16 | 16 | 0.08% | 0.10% | 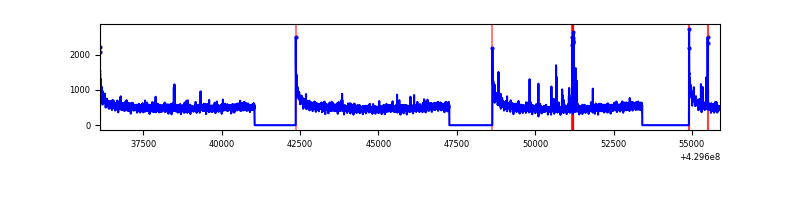 |
| B | 19769 | 15593 | 40 | 40 | 0.20% | 0.26% | 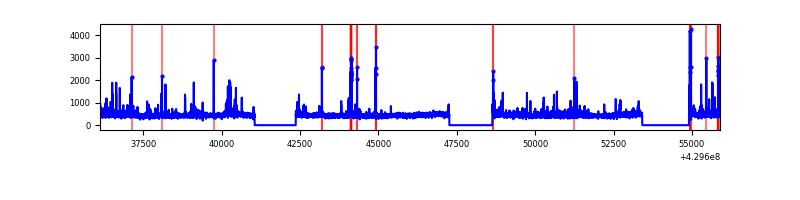 |
| C | 19769 | 15593 | 21 | 21 | 0.11% | 0.13% | 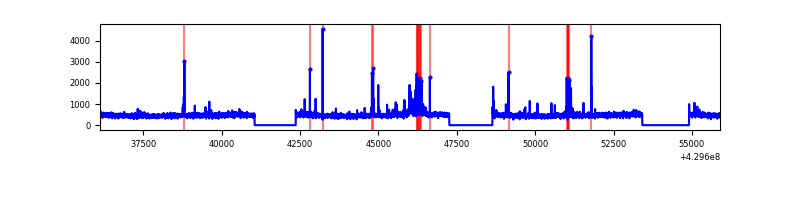 |
| D | 19768 | 15592 | 427 | 427 | 2.16% | 2.74% | 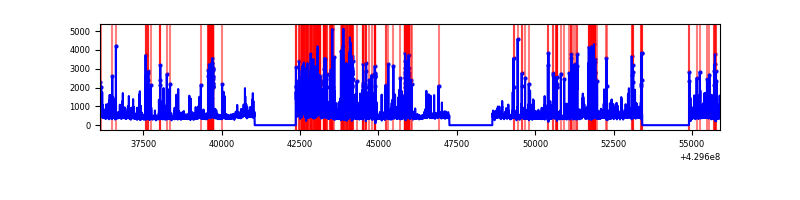 |
Top three noisy pixels from each quadrant. If the there are fewer than three noisy pixels in the level2.evt file, extra rows are filled as -1
| Pixel properties | Quadrant properties | ||||||
|---|---|---|---|---|---|---|---|
| Quadrant | DetID | PixID | Counts | Sigma | Mean | Median | Sigma |
| A | 10 | 83 | 1483014 | 4261.39 | 1693 | 1657 | 347.6 |
| A | 2 | 79 | 59014 | 165.0 | 1693 | 1657 | 347.6 |
| A | 7 | 3 | 48463 | 134.65 | 1693 | 1657 | 347.6 |
| B | 0 | 245 | 181432 | 559.67 | 1680 | 1634 | 321.3 |
| B | 4 | 141 | 148462 | 457.04 | 1680 | 1634 | 321.3 |
| B | 5 | 255 | 129607 | 398.35 | 1680 | 1634 | 321.3 |
| C | 15 | 214 | 636393 | 1660.75 | 1652 | 1662 | 382.2 |
| C | 5 | 250 | 268076 | 697.06 | 1652 | 1662 | 382.2 |
| C | 14 | 254 | 79885 | 204.67 | 1652 | 1662 | 382.2 |
| D | 1 | 52 | 1651549 | 4170.14 | 1631 | 1585 | 395.7 |
| D | 12 | 6 | 418178 | 1052.9 | 1631 | 1585 | 395.7 |
| D | 13 | 249 | 379730 | 955.73 | 1631 | 1585 | 395.7 |
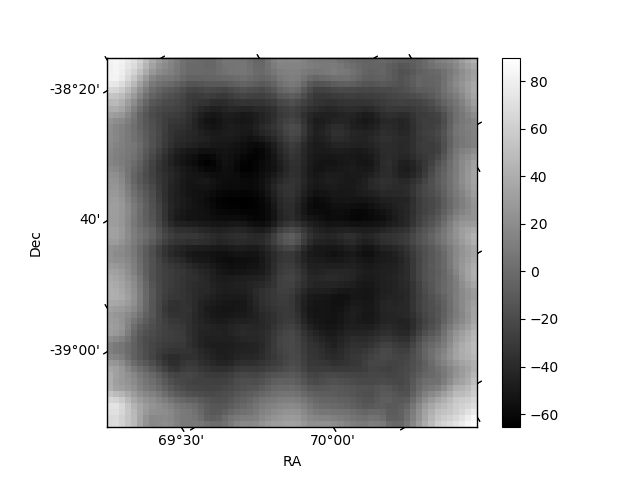
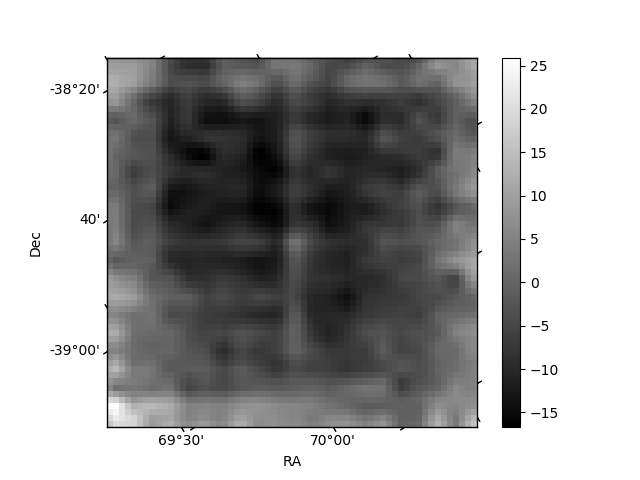
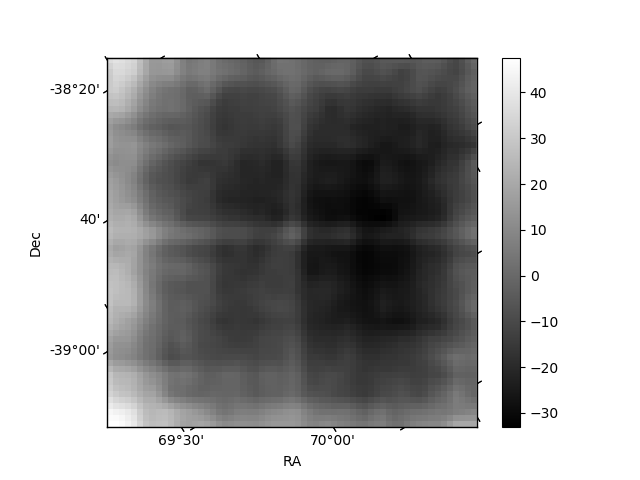
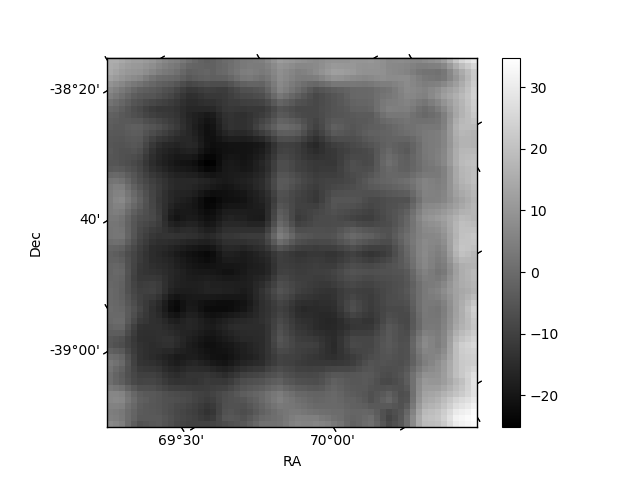
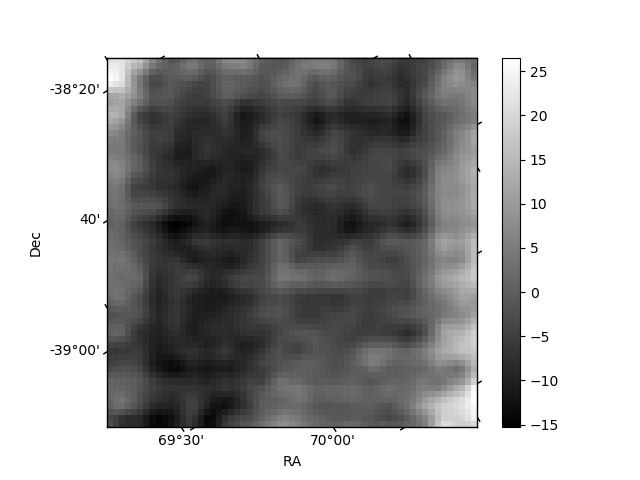
Histogram calculated using DETX and DETY for each event in the final _common_clean file
| Quadrant A | 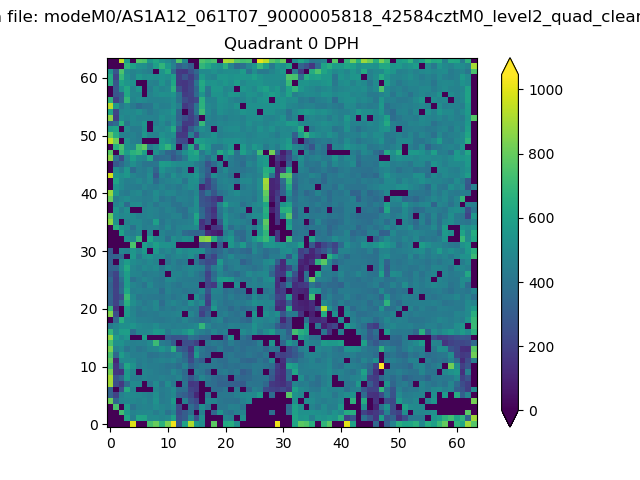 |
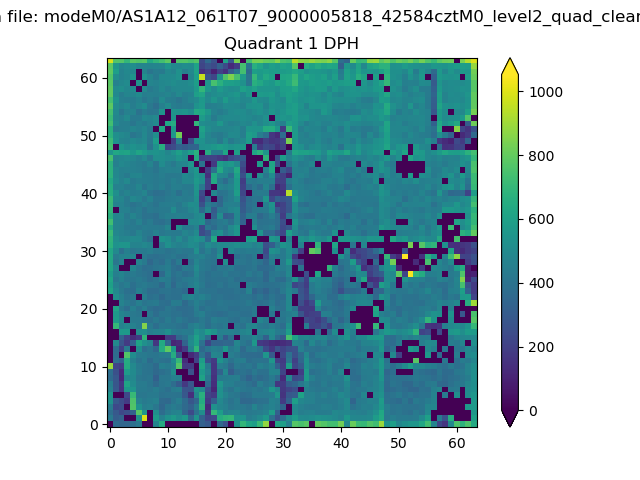 |
Quadrant B |
|---|---|---|---|
| Quadrant D | 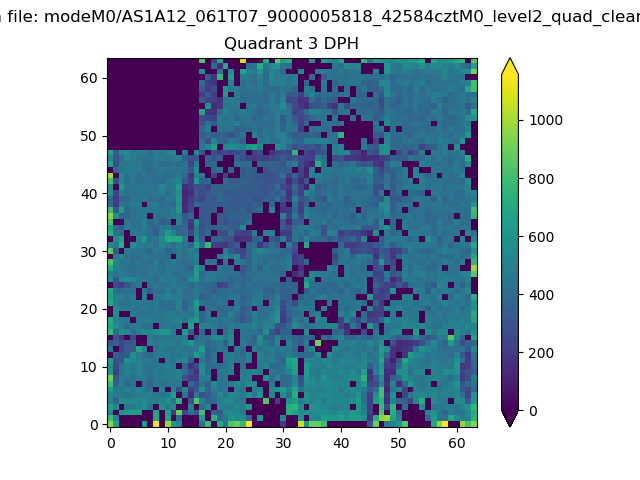 |
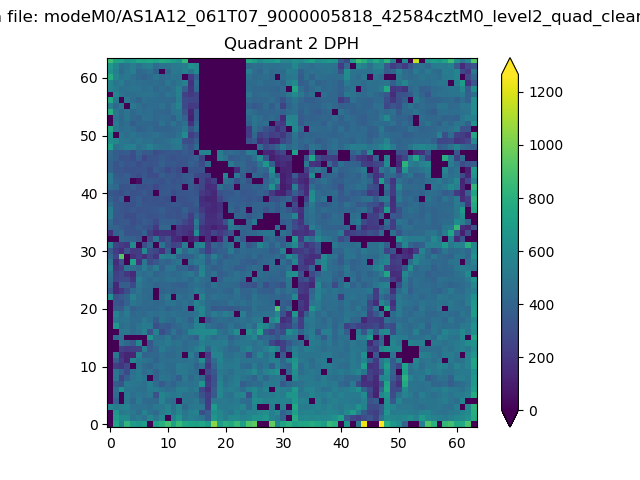 |
Quadrant C |
| Plot type | Count rate plots | Images |
|---|---|---|
| Comparison with Poisson distribution Blue bars denote a histogram of data divided into 1 sec bins. Red curve is a Poisson curve with rate = median count rate of data. |
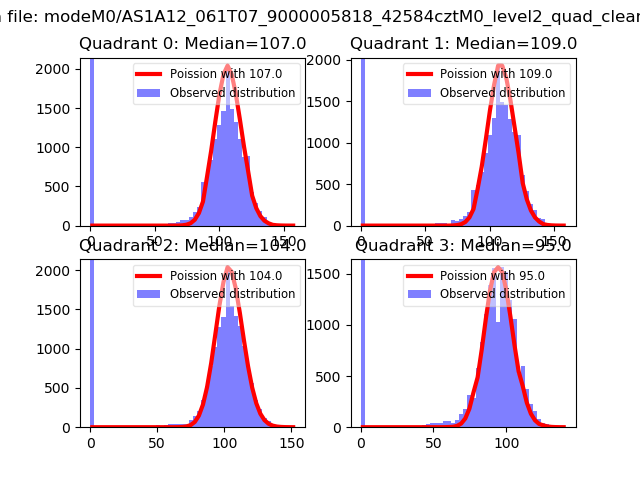 |
 |
| Quadrant-wise count rates Data is divided into 100 sec bins |
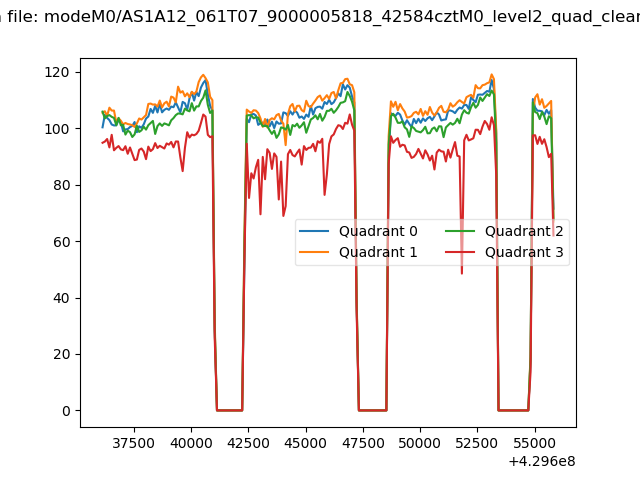 |
|
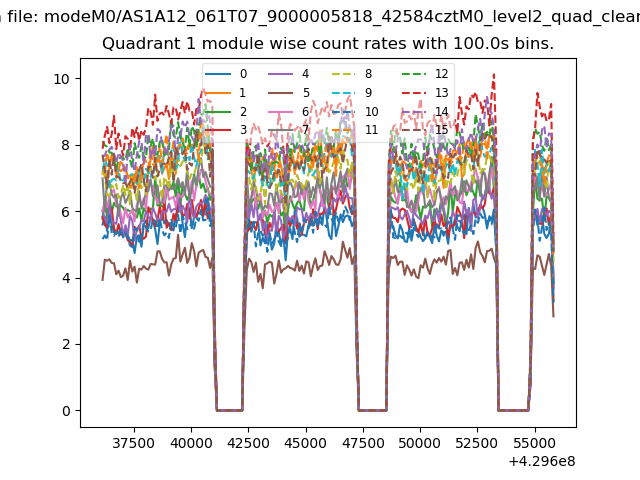
| Module-wise count rates for Quadrant A Data is divided into 100 sec bins |
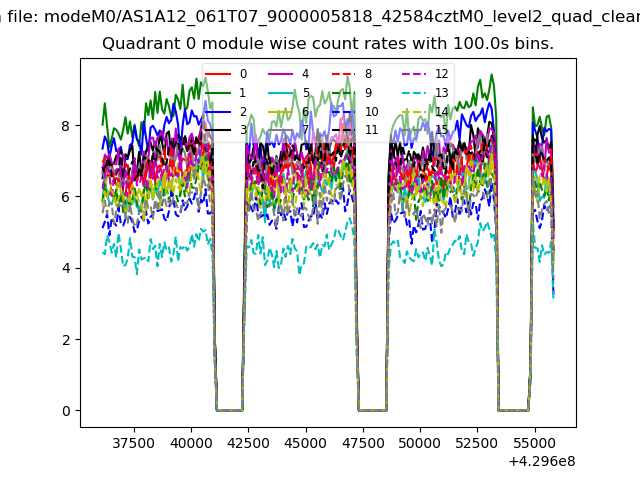 |
 |
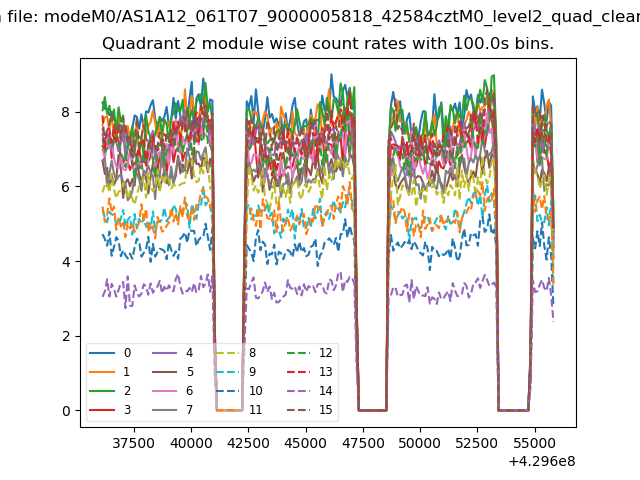
| Module-wise count rates for Quadrant B Data is divided into 100 sec bins |
 |
 |
| Module-wise count rates for Quadrant C Data is divided into 100 sec bins |
 |
 |
| Module-wise count rates for Quadrant D Data is divided into 100 sec bins |
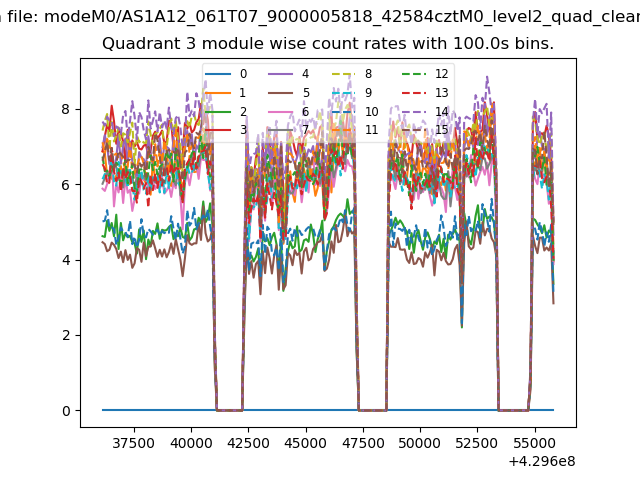 |
 |
| Parameter | Plot |
|---|---|
| CZT HV Monitor | 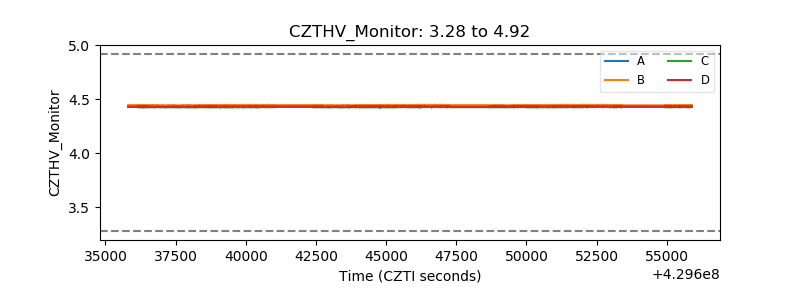 |
| D_VDD | 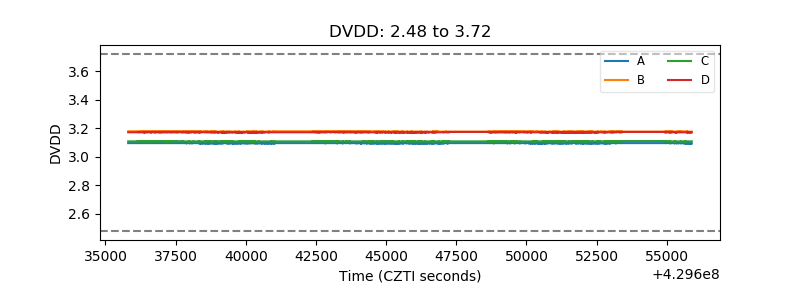 |
| Temperature 1 | 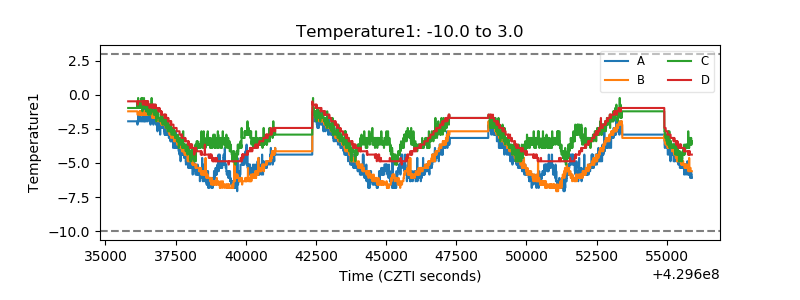 |
| Veto HV Monitor | 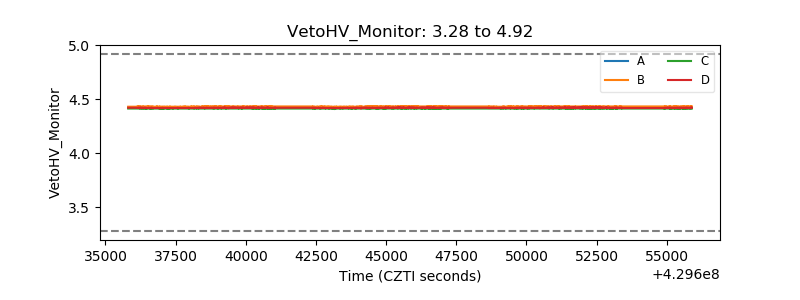 |
| Veto LLD | 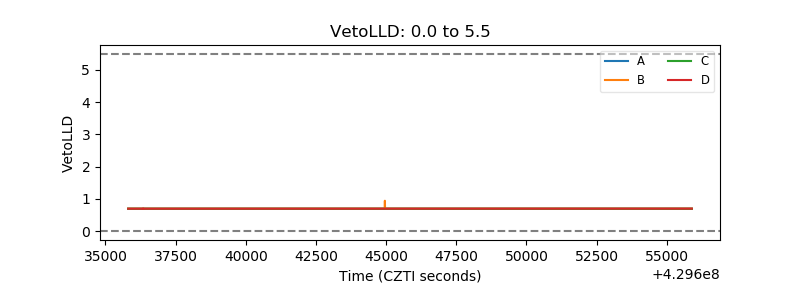 |
| Alpha Counter | 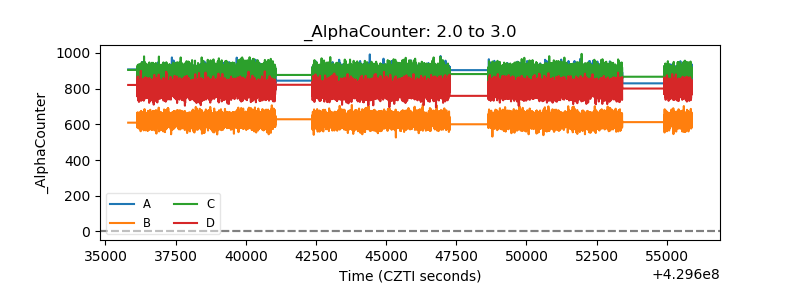 |
| _CPM_Rate | 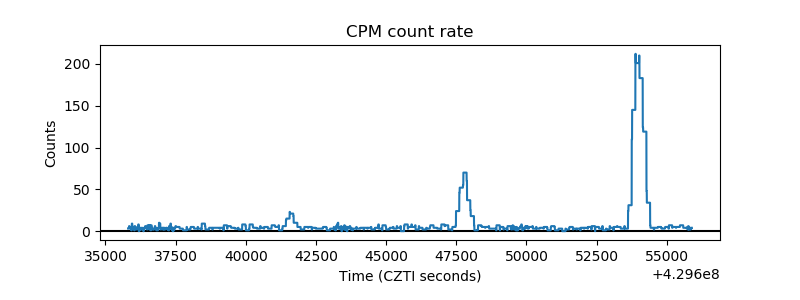 |
| CZT Counter | 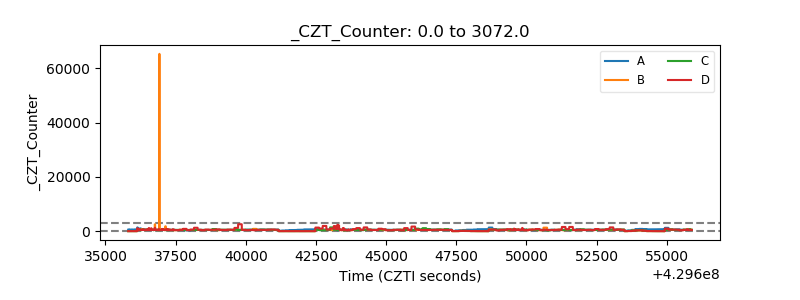 |
| +2.5 Volts monitor | 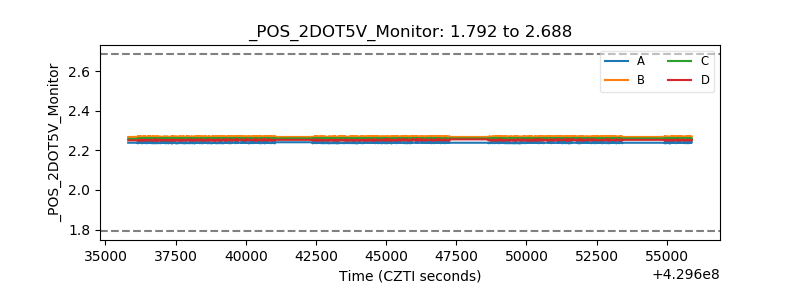 |
| +5 Volts monitor | 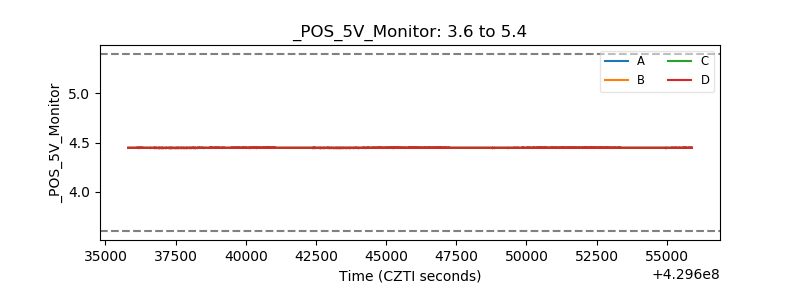 |
| _ROLL_ROT | 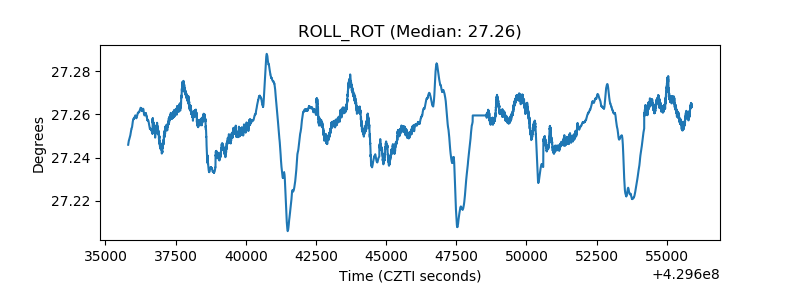 |
| _Roll_DEC | 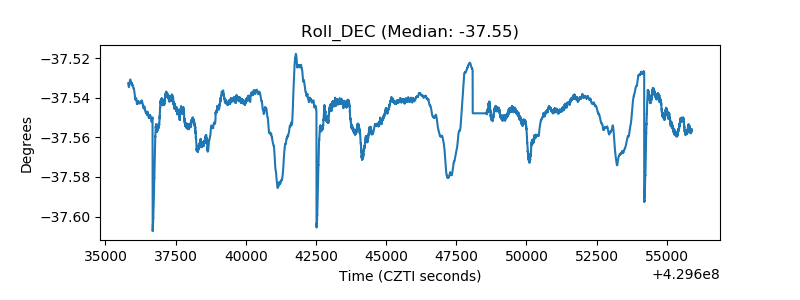 |
| _Roll_RA | 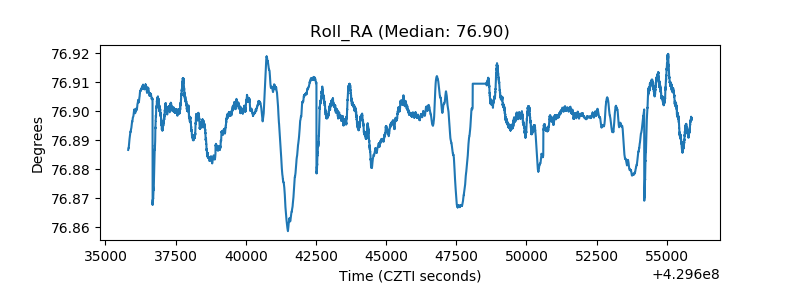 |
| Veto Counter | 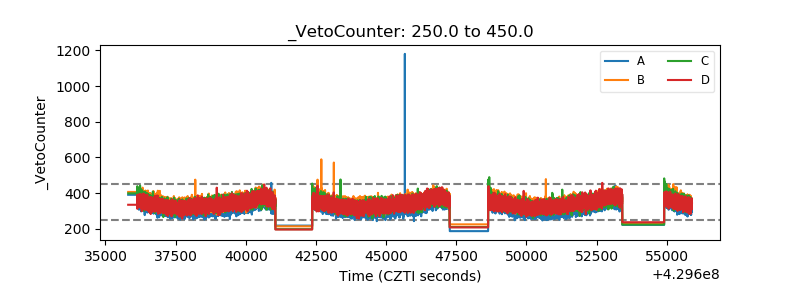 |