| Param | Original file | Final file |
|---|---|---|
| Filename | modeM0/AS1A12_061T07_9000005818_42585cztM0_level2.fits | modeM0/AS1A12_061T07_9000005818_42585cztM0_level2_quad_clean.evt |
| Size (bytes) | 335,113,920 | 92,566,080 |
| Size | 319.6 MB | 88.3 MB |
| Events in quadrant A | 3,034,187 | 624,303 |
| Events in quadrant B | 2,614,499 | 636,609 |
| Events in quadrant C | 2,699,282 | 606,135 |
| Events in quadrant D | 3,613,581 | 537,349 |
| Mode M0 | |||
|---|---|---|---|
| Quadrant | BADHDUFLAG | Total packets | Discarded packets |
| A | 0 | 12530 | 2 |
| B | 0 | 11794 | 2 |
| C | 0 | 11576 | 2 |
| D | 0 | 14744 | 2 |
| Mode SS | |||
|---|---|---|---|
| Quadrant | BADHDUFLAG | Total packets | Discarded packets |
| A | 0 | 120 | 0 |
| B | 0 | 120 | 0 |
| C | 0 | 120 | 0 |
| D | 0 | 120 | 0 |
| Mode M9 | |||
|---|---|---|---|
| Quadrant | BADHDUFLAG | Total packets | Discarded packets |
| A | 0 | 30 | 0 |
| B | 0 | 30 | 0 |
| C | 0 | 30 | 0 |
| D | 0 | 30 | 0 |
| Quadrant | Total seconds | Saturated seconds | Saturation percentage |
|---|---|---|---|
| A | 5689 | 13 | 0.228511% |
| B | 5689 | 36 | 0.632800% |
| C | 5689 | 8 | 0.140622% |
| D | 5689 | 264 | 4.640534% |
Noise dominated data is calculated using 1-second bins in cleaned event files. If a bin has >2000 counts, and if more than 50% of those come from <1% of pixels, then it is considered to be noise-dominated and hence unusable.
| Quadrant | # 1 sec bins | Bins with >0 counts | Bins with >2000 counts | High rate bins dominated by noise | Noise dominated (total time) | Noise dominated (detector-on time) | Marked lightcurve |
|---|---|---|---|---|---|---|---|
| A | 8794 | 5691 | 6 | 6 | 0.07% | 0.11% | 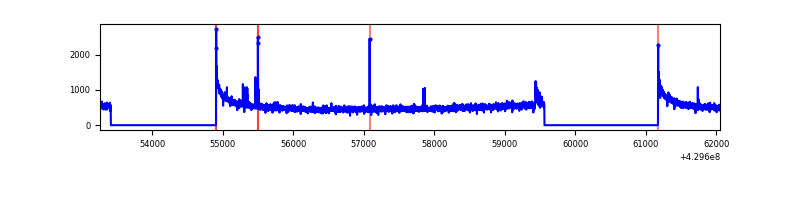 |
| B | 8794 | 5691 | 22 | 22 | 0.25% | 0.39% | 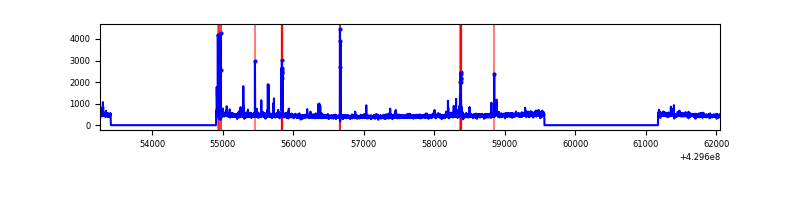 |
| C | 8794 | 5691 | 3 | 3 | 0.03% | 0.05% | 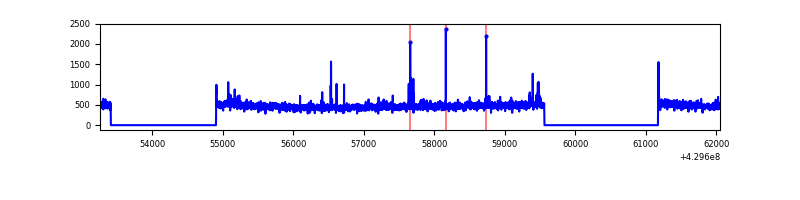 |
| D | 8794 | 5691 | 231 | 231 | 2.63% | 4.06% | 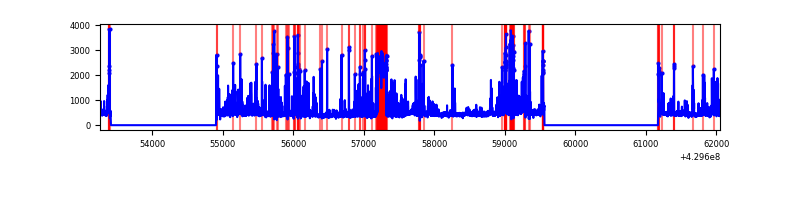 |
Top three noisy pixels from each quadrant. If the there are fewer than three noisy pixels in the level2.evt file, extra rows are filled as -1
| Pixel properties | Quadrant properties | ||||||
|---|---|---|---|---|---|---|---|
| Quadrant | DetID | PixID | Counts | Sigma | Mean | Median | Sigma |
| A | 10 | 83 | 574362 | 4460.92 | 623 | 610 | 128.6 |
| A | 9 | 143 | 22735 | 172.02 | 623 | 610 | 128.6 |
| A | 7 | 3 | 17566 | 131.83 | 623 | 610 | 128.6 |
| B | 0 | 245 | 45628 | 369.02 | 620 | 601 | 122.0 |
| B | 4 | 141 | 42828 | 346.08 | 620 | 601 | 122.0 |
| B | 3 | 112 | 35090 | 282.66 | 620 | 601 | 122.0 |
| C | 15 | 214 | 237554 | 1661.27 | 611 | 616 | 142.6 |
| C | 14 | 254 | 33762 | 232.4 | 611 | 616 | 142.6 |
| C | 4 | 254 | 19424 | 131.87 | 611 | 616 | 142.6 |
| D | 1 | 52 | 578838 | 3936.29 | 595 | 578 | 146.9 |
| D | 12 | 6 | 405159 | 2754.04 | 595 | 578 | 146.9 |
| D | 12 | 217 | 75710 | 511.43 | 595 | 578 | 146.9 |
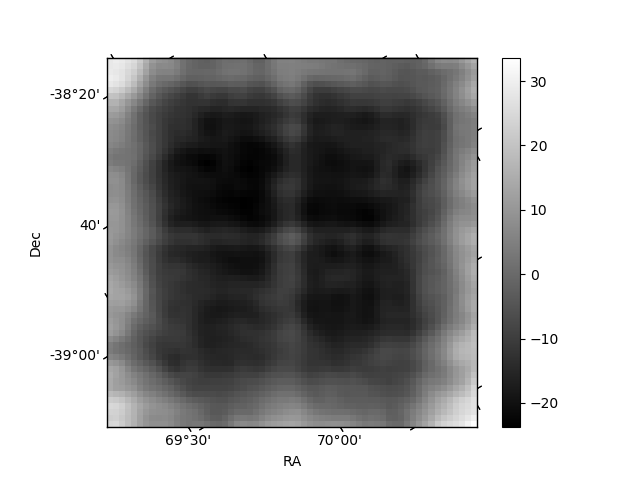
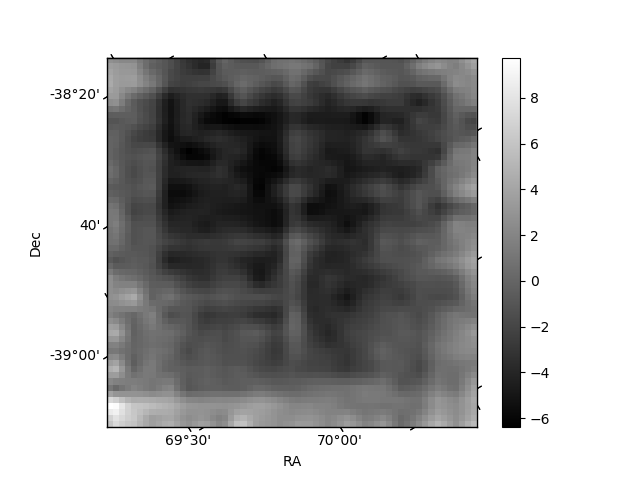
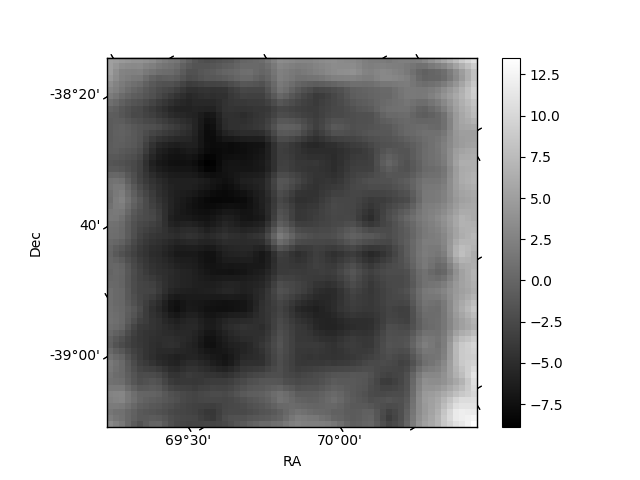
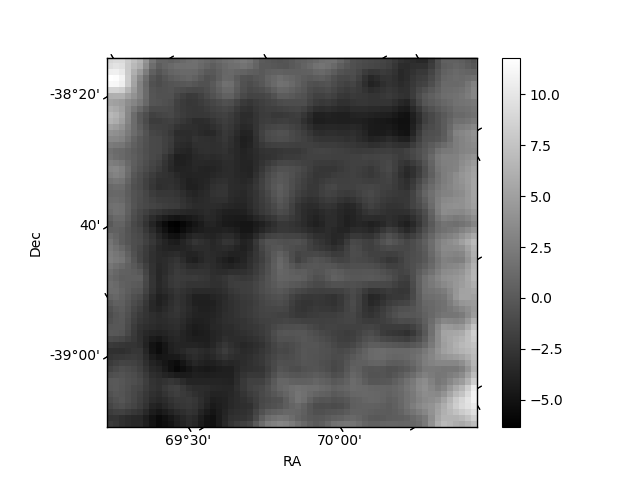
Histogram calculated using DETX and DETY for each event in the final _common_clean file
| Quadrant A | 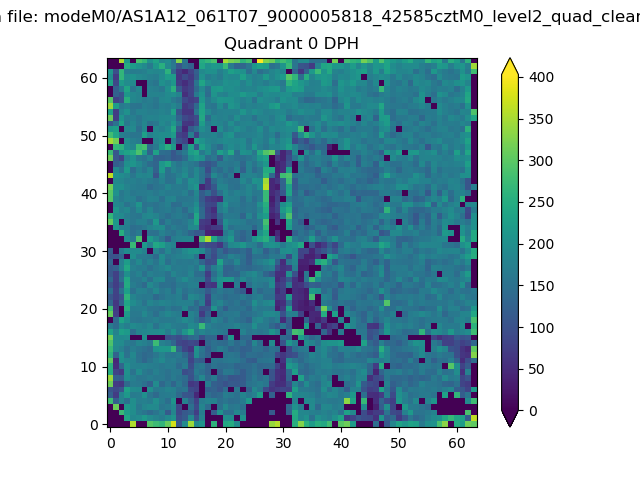 |
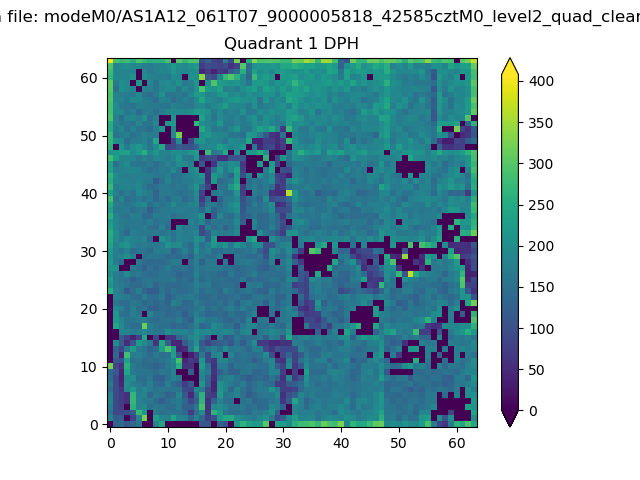 |
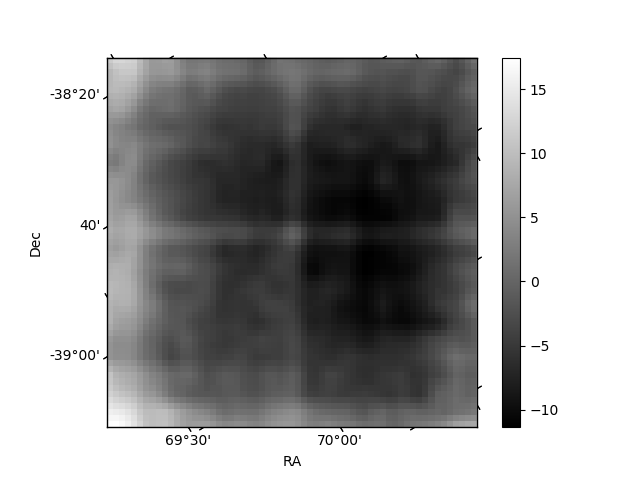
Quadrant B |
|---|---|---|---|
| Quadrant D | 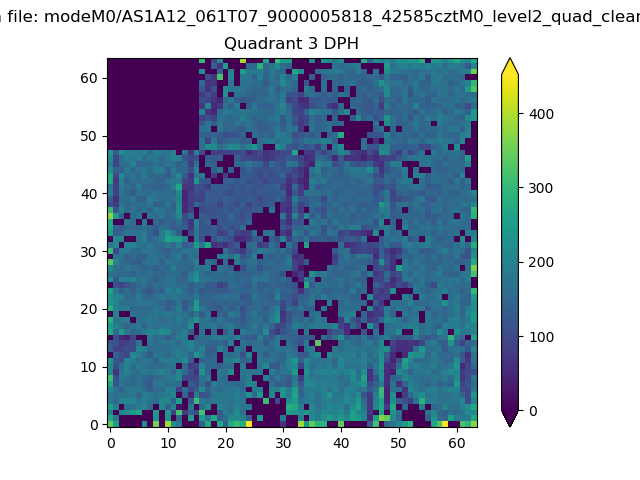 |
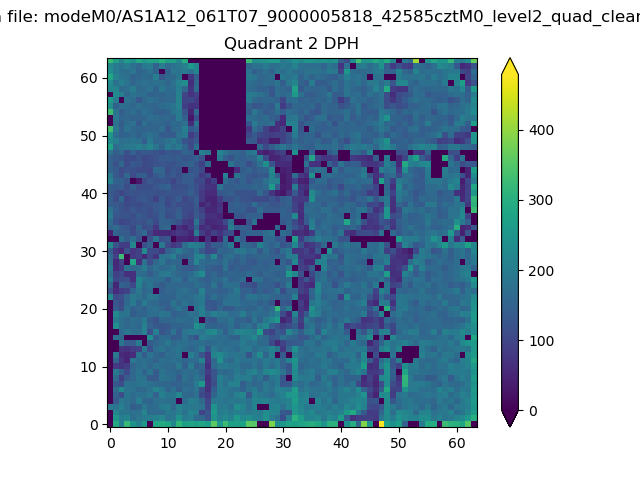 |
Quadrant C |
| Plot type | Count rate plots | Images |
|---|---|---|
| Comparison with Poisson distribution Blue bars denote a histogram of data divided into 1 sec bins. Red curve is a Poisson curve with rate = median count rate of data. |
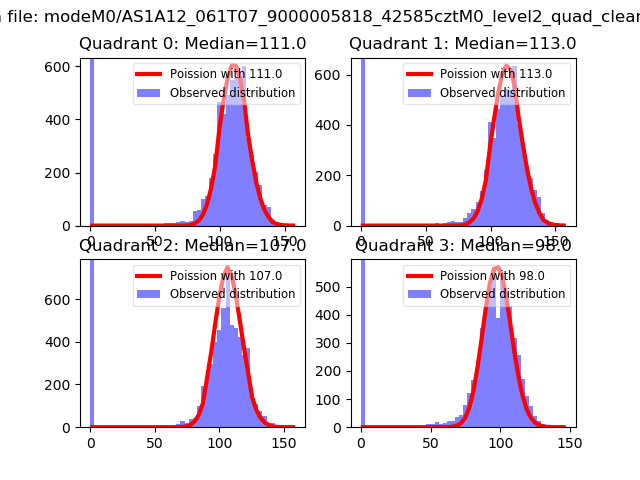 |
 |
| Quadrant-wise count rates Data is divided into 100 sec bins |
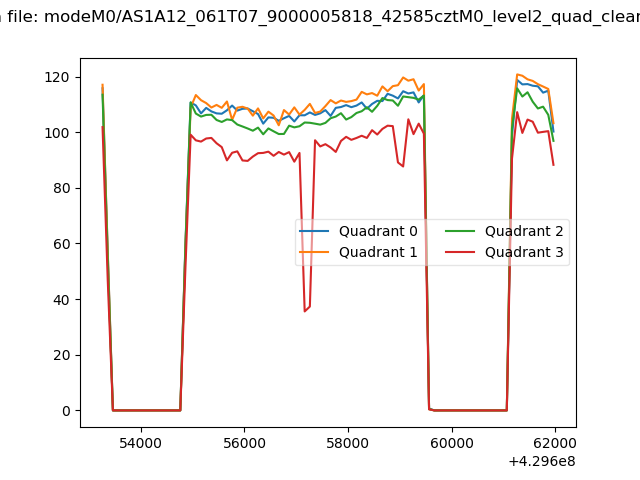 |
|
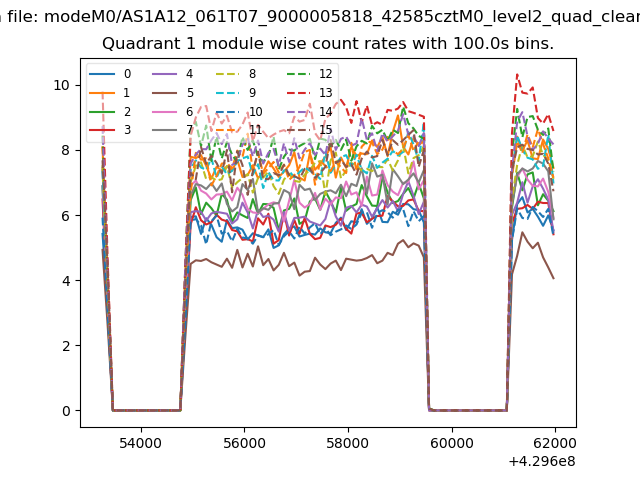
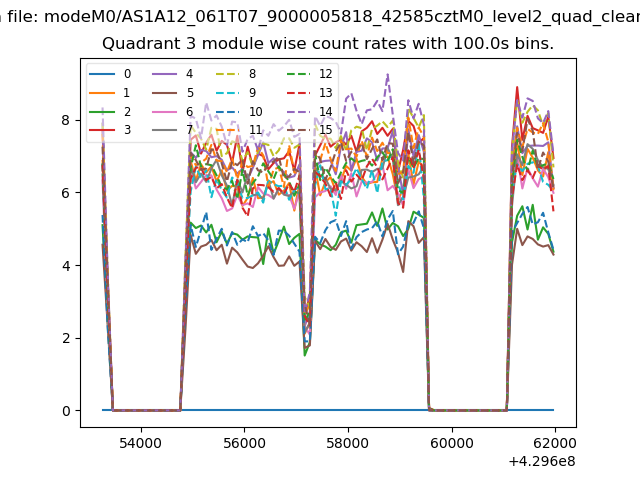
| Module-wise count rates for Quadrant A Data is divided into 100 sec bins |
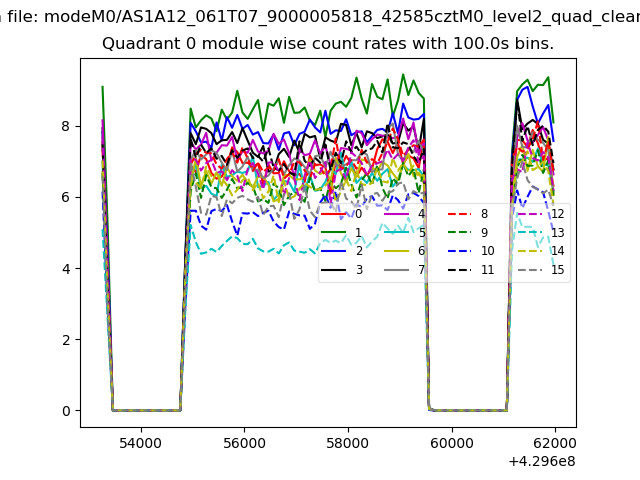 |
 |
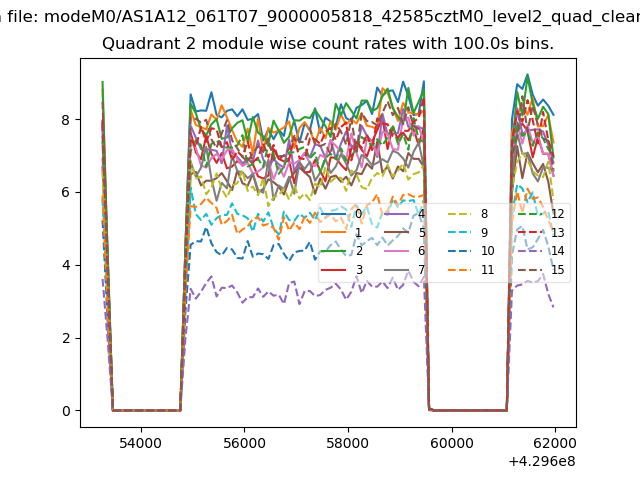
| Module-wise count rates for Quadrant B Data is divided into 100 sec bins |
 |
 |
| Module-wise count rates for Quadrant C Data is divided into 100 sec bins |
 |
 |
| Module-wise count rates for Quadrant D Data is divided into 100 sec bins |
 |
 |
| Parameter | Plot |
|---|---|
| CZT HV Monitor | 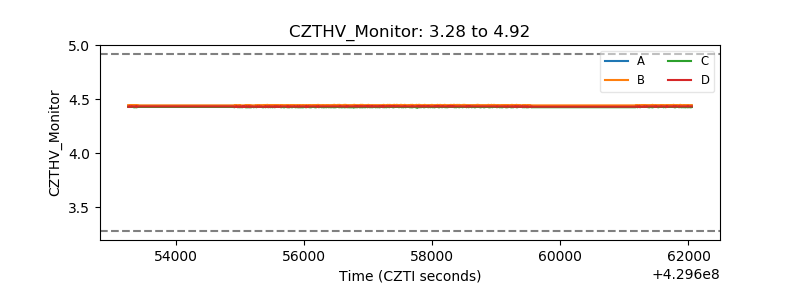 |
| D_VDD | 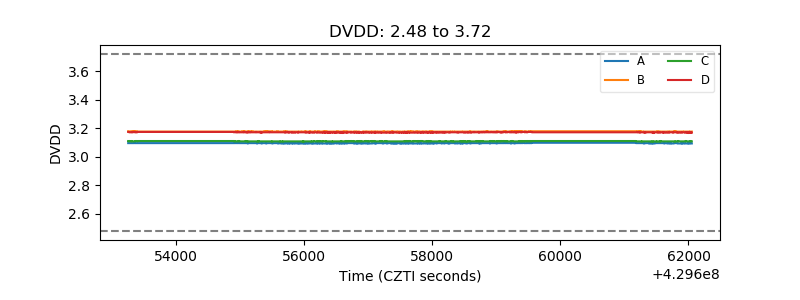 |
| Temperature 1 | 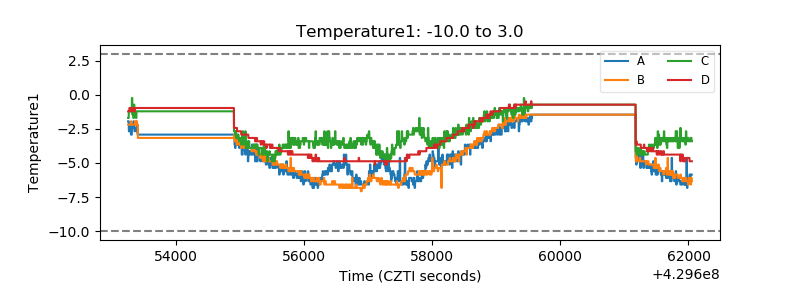 |
| Veto HV Monitor | 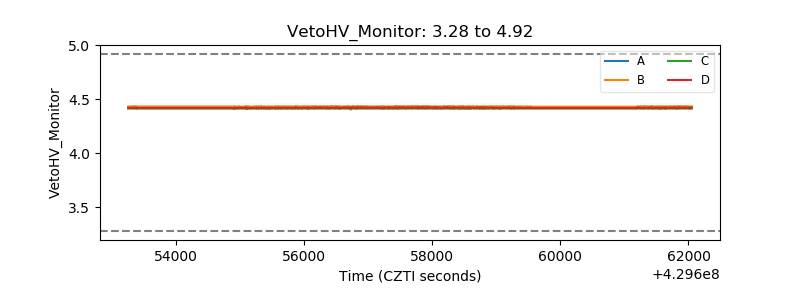 |
| Veto LLD | 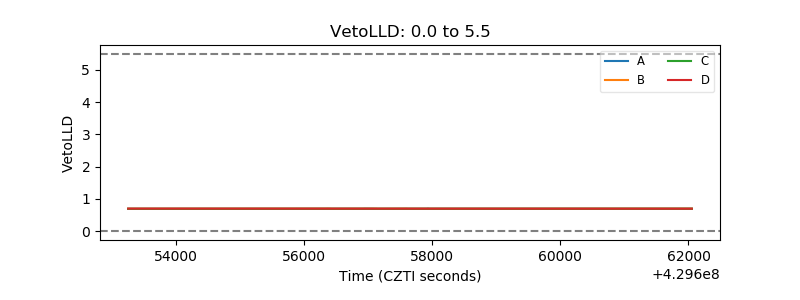 |
| Alpha Counter | 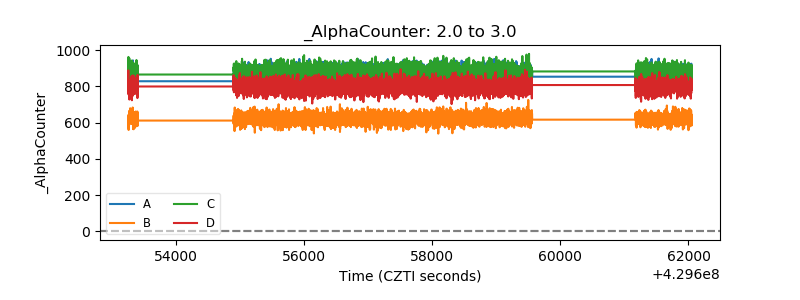 |
| _CPM_Rate | 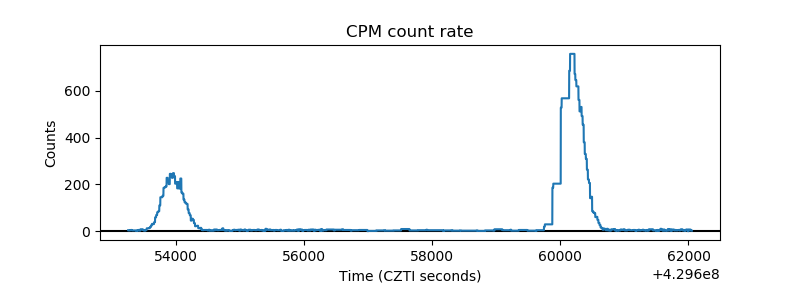 |
| CZT Counter | 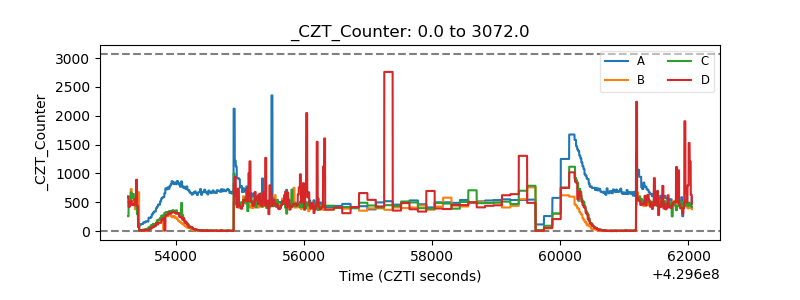 |
| +2.5 Volts monitor | 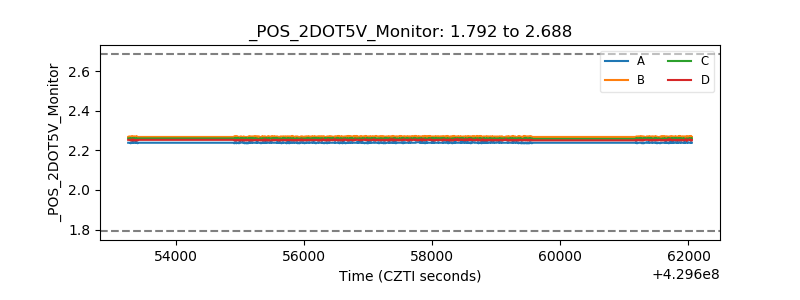 |
| +5 Volts monitor | 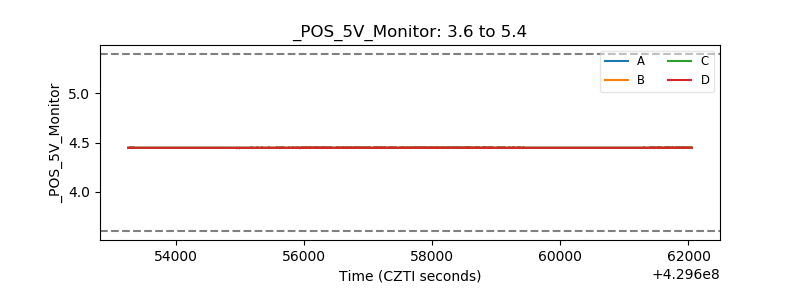 |
| _ROLL_ROT | 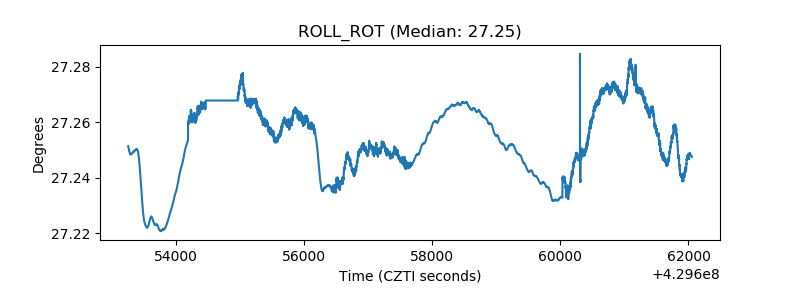 |
| _Roll_DEC | 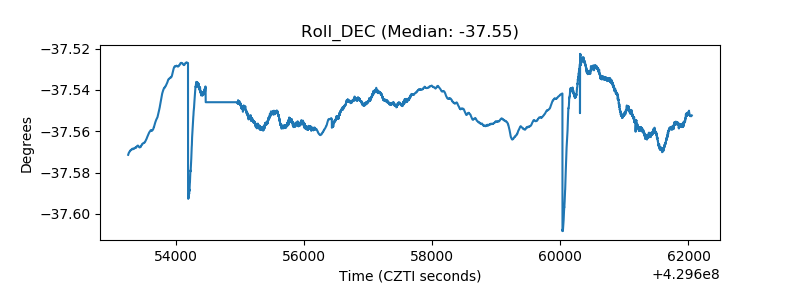 |
| _Roll_RA | 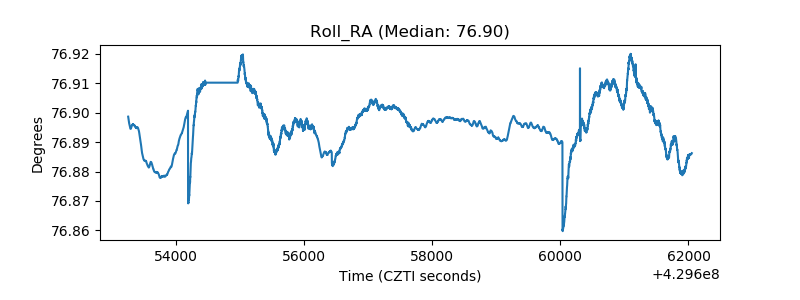 |
| Veto Counter | 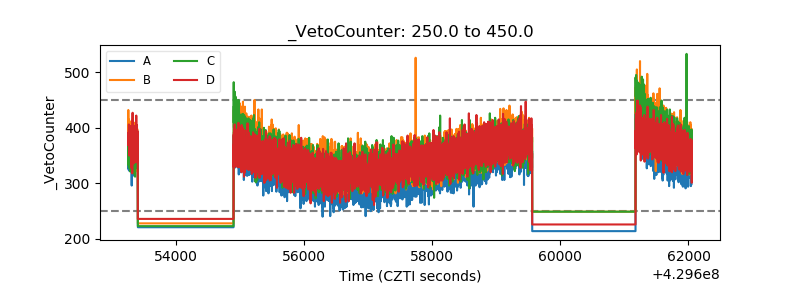 |