| Param | Original file | Final file |
|---|---|---|
| Filename | modeM0/AS1A12_061T07_9000005818_42587cztM0_level2.fits | modeM0/AS1A12_061T07_9000005818_42587cztM0_level2_quad_clean.evt |
| Size (bytes) | 299,093,760 | 90,973,440 |
| Size | 285.2 MB | 86.8 MB |
| Events in quadrant A | 2,866,067 | 609,709 |
| Events in quadrant B | 2,413,793 | 626,052 |
| Events in quadrant C | 2,570,615 | 596,535 |
| Events in quadrant D | 2,798,628 | 543,328 |
| Mode M0 | |||
|---|---|---|---|
| Quadrant | BADHDUFLAG | Total packets | Discarded packets |
| A | 0 | 11851 | 2 |
| B | 0 | 10980 | 3 |
| C | 0 | 10983 | 2 |
| D | 0 | 12242 | 2 |
| Mode SS | |||
|---|---|---|---|
| Quadrant | BADHDUFLAG | Total packets | Discarded packets |
| A | 0 | 110 | 0 |
| B | 0 | 110 | 0 |
| C | 0 | 110 | 0 |
| D | 0 | 110 | 0 |
| Mode M9 | |||
|---|---|---|---|
| Quadrant | BADHDUFLAG | Total packets | Discarded packets |
| A | 0 | 26 | 0 |
| B | 0 | 27 | 0 |
| C | 0 | 27 | 0 |
| D | 0 | 27 | 0 |
| Quadrant | Total seconds | Saturated seconds | Saturation percentage |
|---|---|---|---|
| A | 5416 | 14 | 0.258493% |
| B | 5415 | 8 | 0.147738% |
| C | 5415 | 3 | 0.055402% |
| D | 5415 | 30 | 0.554017% |
Noise dominated data is calculated using 1-second bins in cleaned event files. If a bin has >2000 counts, and if more than 50% of those come from <1% of pixels, then it is considered to be noise-dominated and hence unusable.
| Quadrant | # 1 sec bins | Bins with >0 counts | Bins with >2000 counts | High rate bins dominated by noise | Noise dominated (total time) | Noise dominated (detector-on time) | Marked lightcurve |
|---|---|---|---|---|---|---|---|
| A | 7178 | 5417 | 3 | 3 | 0.04% | 0.06% | 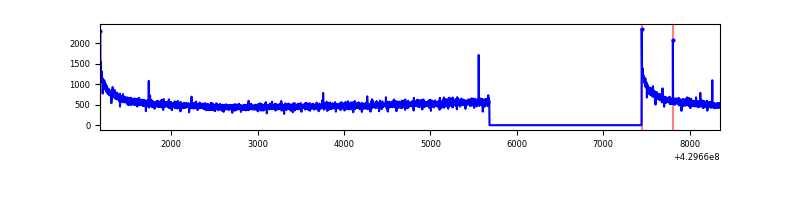 |
| B | 7177 | 5416 | 1 | 1 | 0.01% | 0.02% | 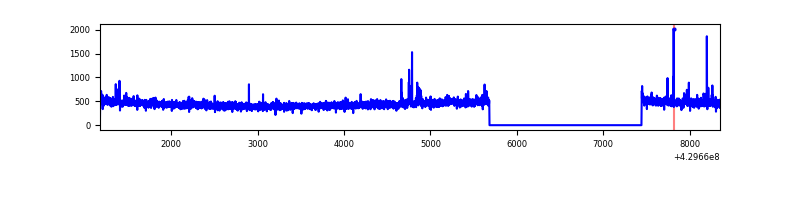 |
| C | 7177 | 5416 | 1 | 1 | 0.01% | 0.02% | 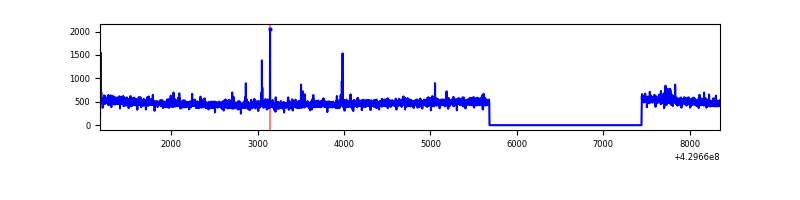 |
| D | 7177 | 5416 | 33 | 33 | 0.46% | 0.61% | 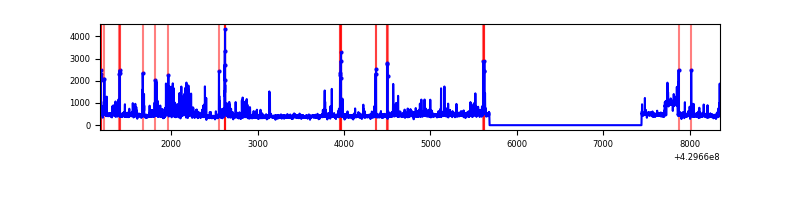 |
Top three noisy pixels from each quadrant. If the there are fewer than three noisy pixels in the level2.evt file, extra rows are filled as -1
| Pixel properties | Quadrant properties | ||||||
|---|---|---|---|---|---|---|---|
| Quadrant | DetID | PixID | Counts | Sigma | Mean | Median | Sigma |
| A | 10 | 83 | 544474 | 4426.15 | 598 | 586 | 122.9 |
| A | 3 | 137 | 6710 | 49.84 | 598 | 586 | 122.9 |
| A | 13 | 254 | 5664 | 41.32 | 598 | 586 | 122.9 |
| B | 0 | 245 | 28658 | 242.36 | 597 | 579 | 115.9 |
| B | 5 | 172 | 15599 | 129.64 | 597 | 579 | 115.9 |
| B | 12 | 111 | 14408 | 119.36 | 597 | 579 | 115.9 |
| C | 15 | 214 | 226499 | 1617.99 | 592 | 596 | 139.6 |
| C | 14 | 254 | 19529 | 135.6 | 592 | 596 | 139.6 |
| C | 7 | 220 | 8509 | 56.68 | 592 | 596 | 139.6 |
| D | 12 | 217 | 150570 | 1051.06 | 587 | 571 | 142.7 |
| D | 12 | 6 | 88063 | 613.07 | 587 | 571 | 142.7 |
| D | 1 | 52 | 88042 | 612.92 | 587 | 571 | 142.7 |
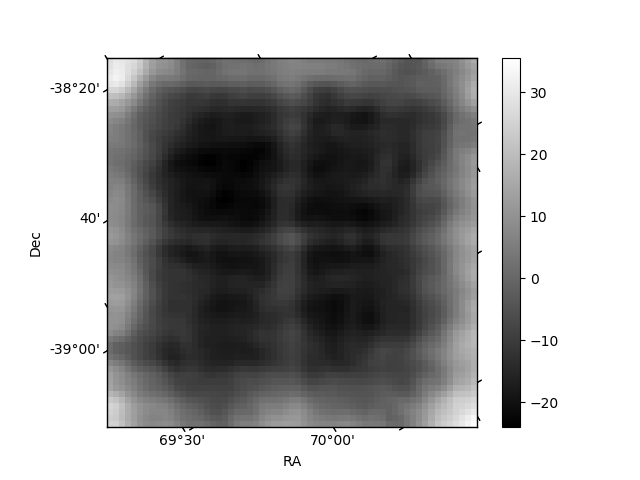
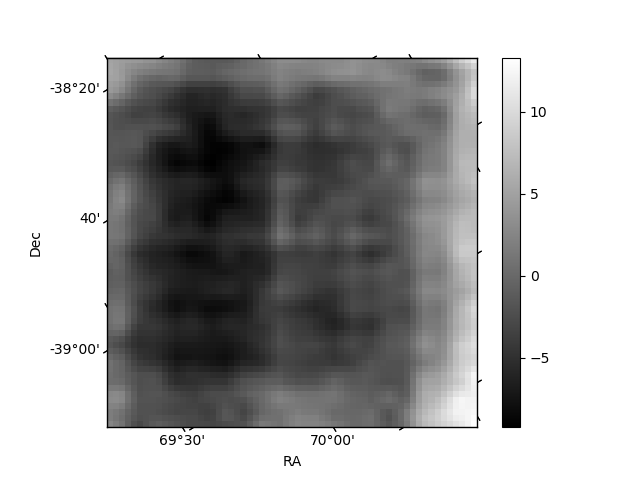
Histogram calculated using DETX and DETY for each event in the final _common_clean file
| Quadrant A | 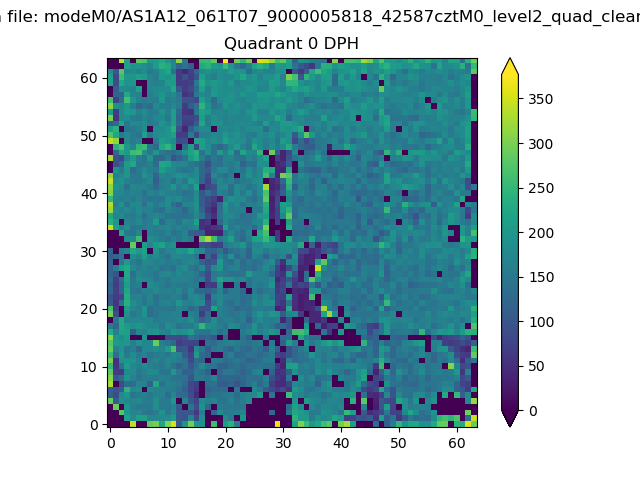 |
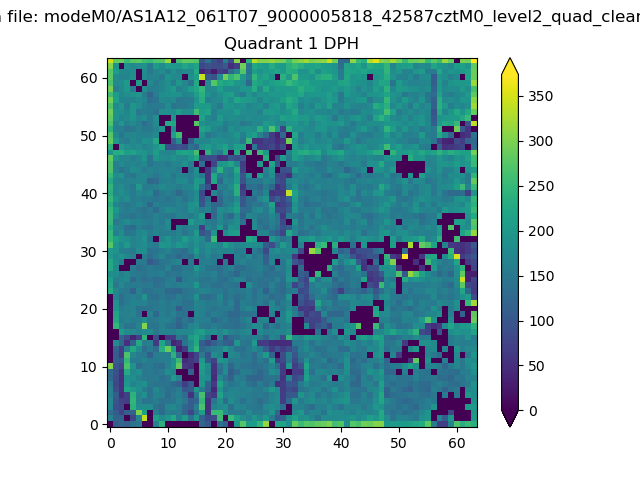 |
Quadrant B |
|---|---|---|---|
| Quadrant D | 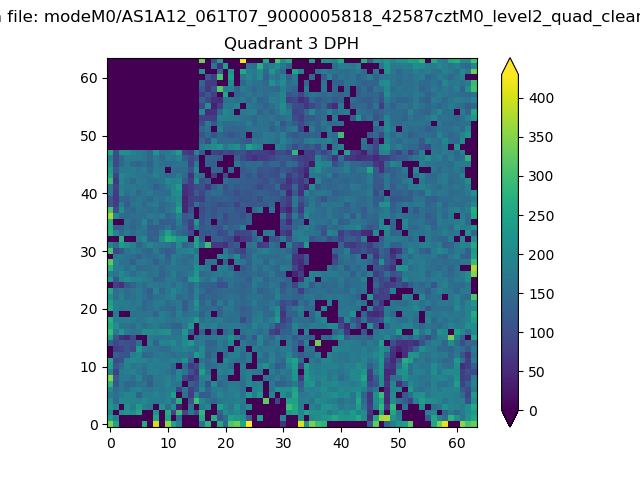 |
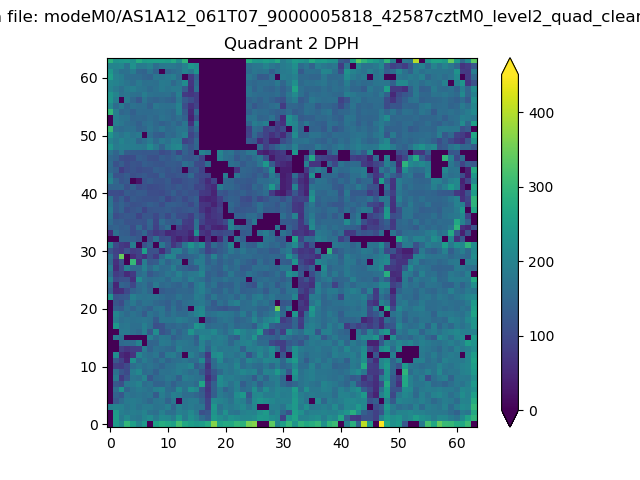 |
Quadrant C |
| Plot type | Count rate plots | Images |
|---|---|---|
| Comparison with Poisson distribution Blue bars denote a histogram of data divided into 1 sec bins. Red curve is a Poisson curve with rate = median count rate of data. |
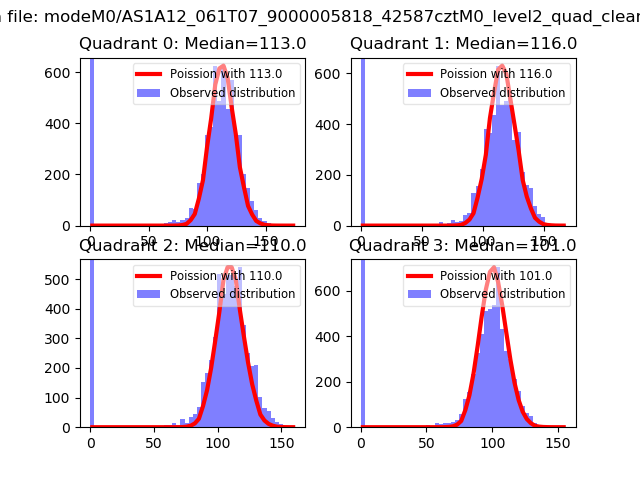 |
 |
| Quadrant-wise count rates Data is divided into 100 sec bins |
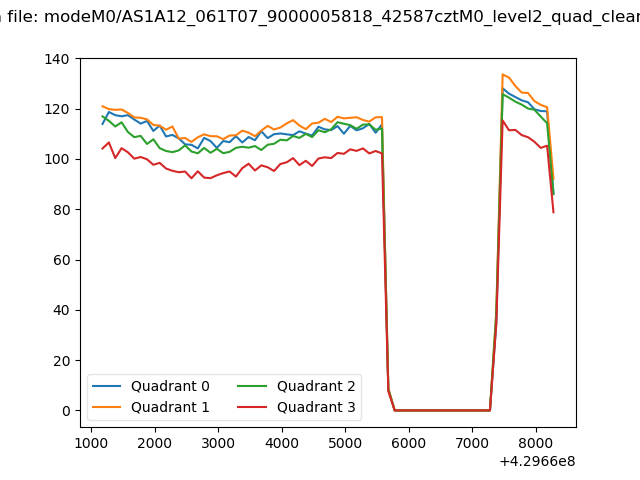 |
|
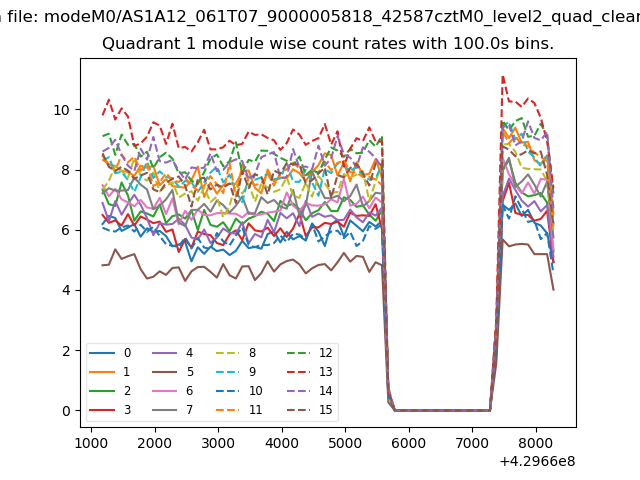
| Module-wise count rates for Quadrant A Data is divided into 100 sec bins |
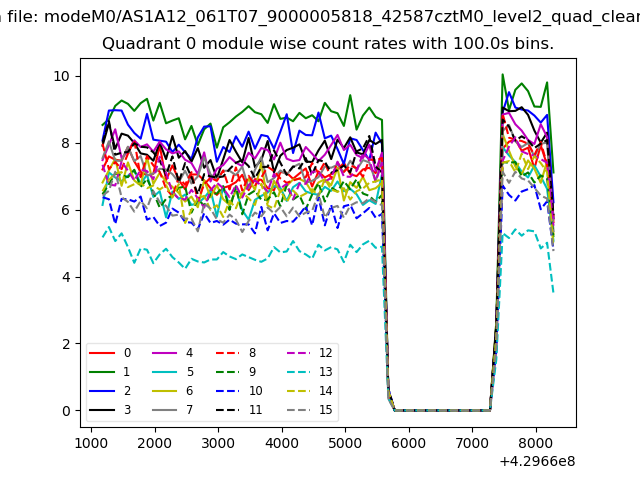 |
 |
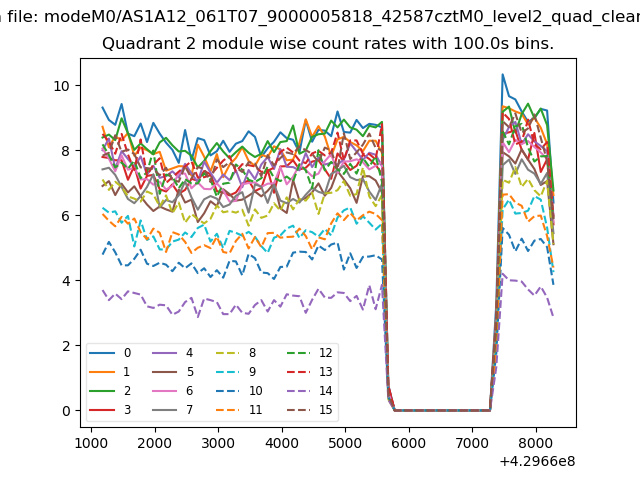
| Module-wise count rates for Quadrant B Data is divided into 100 sec bins |
 |
 |
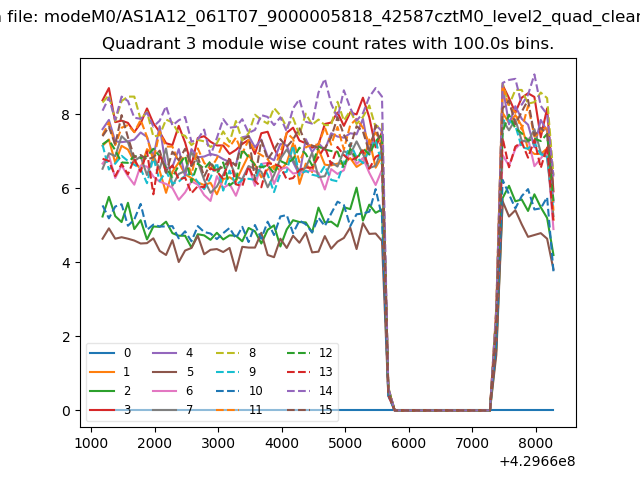
| Module-wise count rates for Quadrant C Data is divided into 100 sec bins |
 |
 |
| Module-wise count rates for Quadrant D Data is divided into 100 sec bins |
 |
 |
| Parameter | Plot |
|---|---|
| CZT HV Monitor | 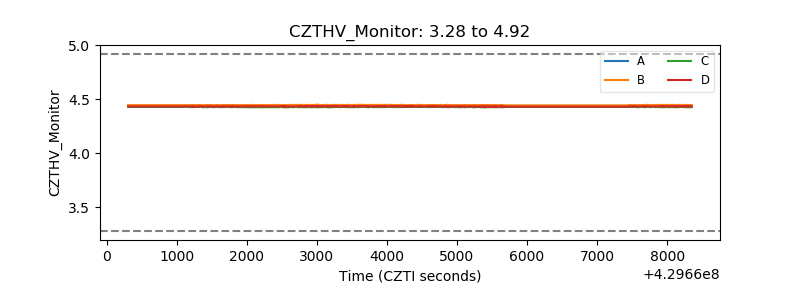 |
| D_VDD | 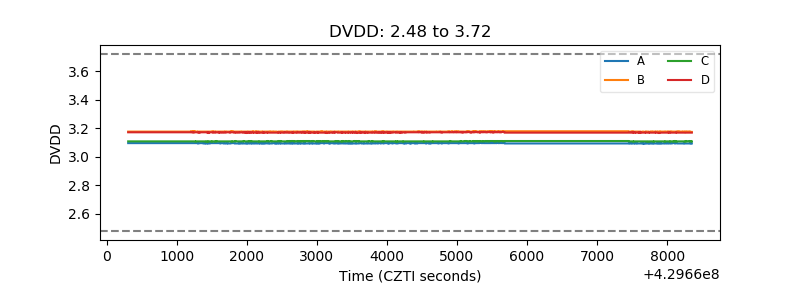 |
| Temperature 1 | 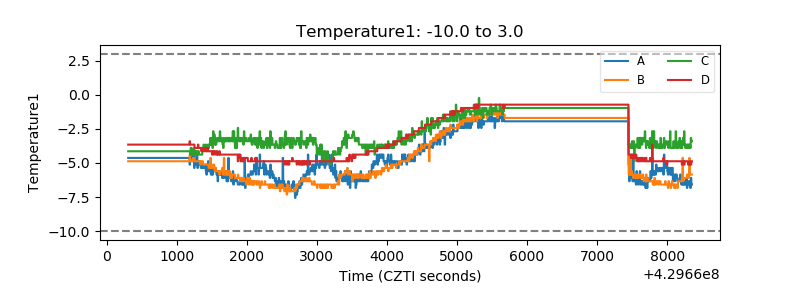 |
| Veto HV Monitor | 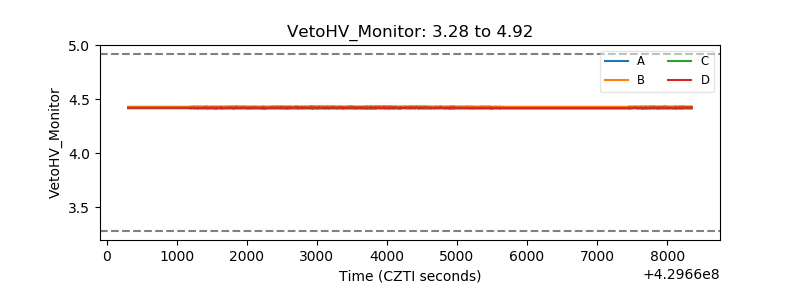 |
| Veto LLD | 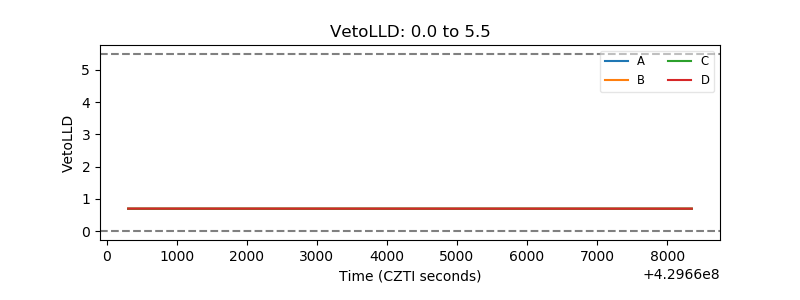 |
| Alpha Counter | 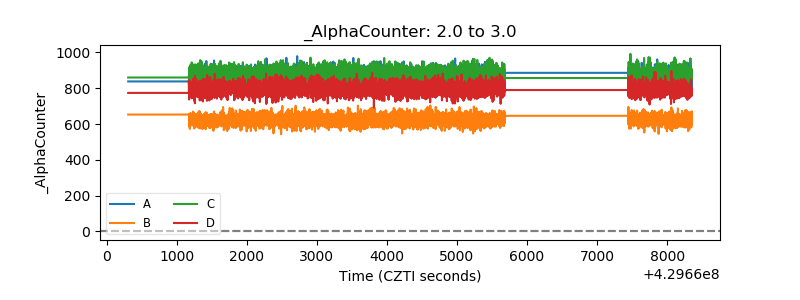 |
| _CPM_Rate | 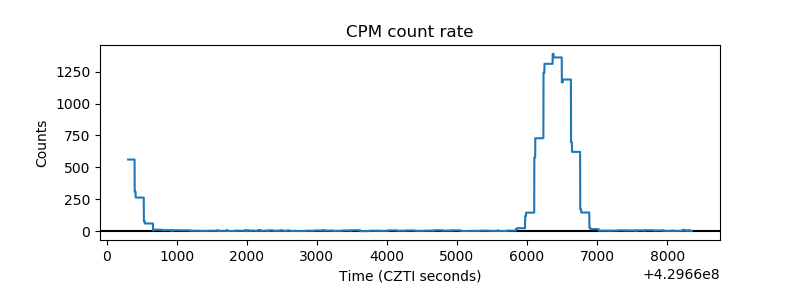 |
| CZT Counter | 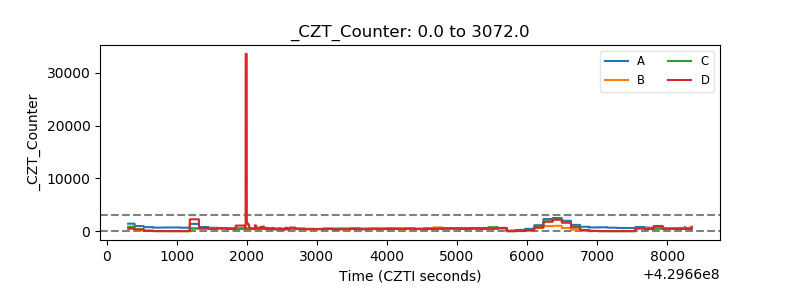 |
| +2.5 Volts monitor | 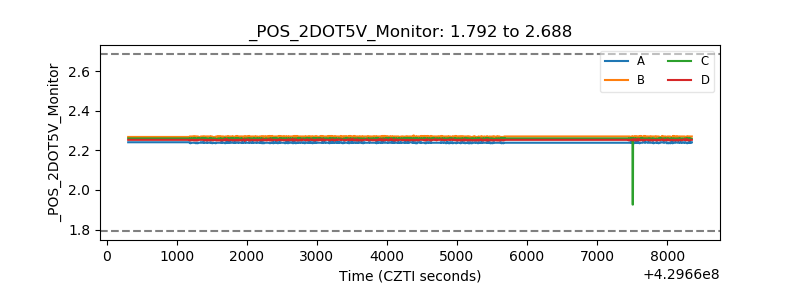 |
| +5 Volts monitor | 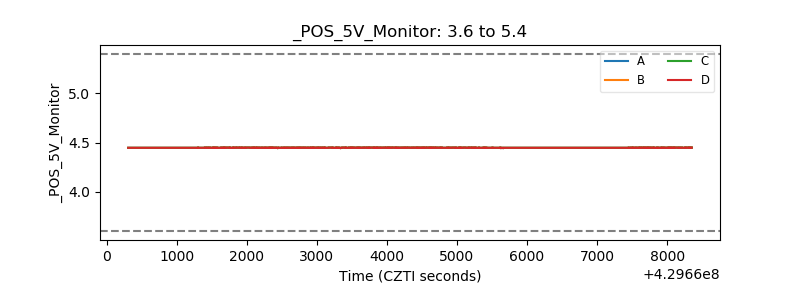 |
| _ROLL_ROT | 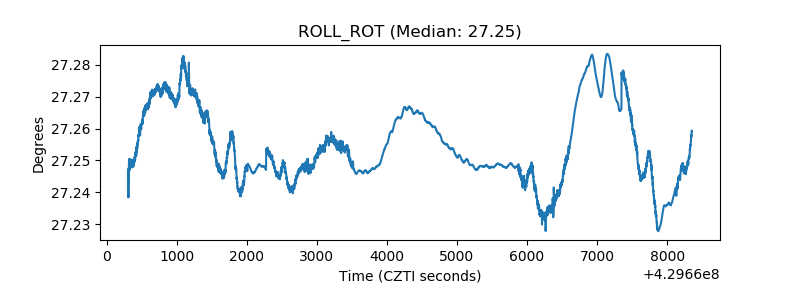 |
| _Roll_DEC | 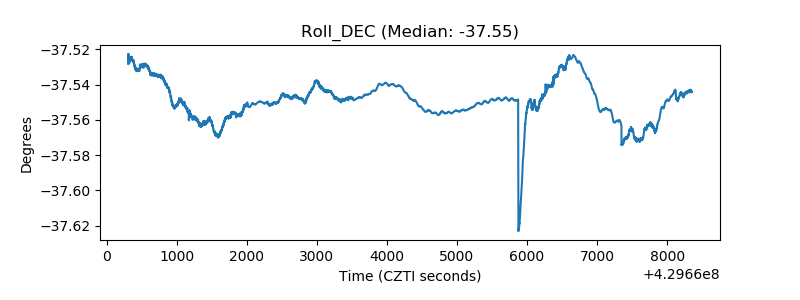 |
| _Roll_RA | 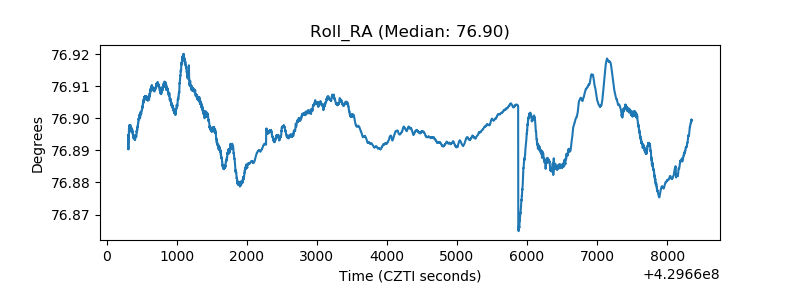 |
| Veto Counter | 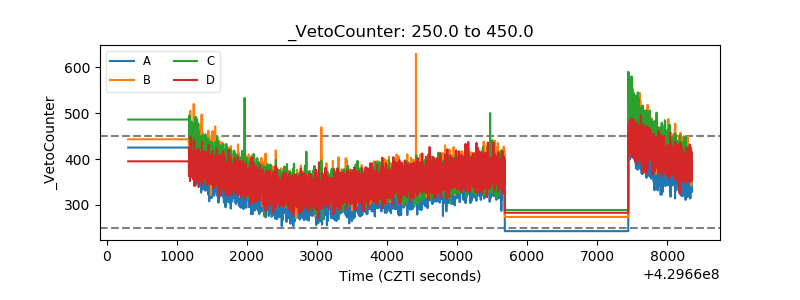 |