| Param | Original file | Final file |
|---|---|---|
| Filename | modeM0/AS1A12_061T07_9000005818_42588cztM0_level2.fits | modeM0/AS1A12_061T07_9000005818_42588cztM0_level2_quad_clean.evt |
| Size (bytes) | 295,600,320 | 91,681,920 |
| Size | 281.9 MB | 87.4 MB |
| Events in quadrant A | 2,841,592 | 613,839 |
| Events in quadrant B | 2,414,022 | 632,151 |
| Events in quadrant C | 2,567,858 | 608,627 |
| Events in quadrant D | 2,710,096 | 554,462 |
| Mode M0 | |||
|---|---|---|---|
| Quadrant | BADHDUFLAG | Total packets | Discarded packets |
| A | 0 | 11584 | 2 |
| B | 0 | 10698 | 2 |
| C | 0 | 10745 | 2 |
| D | 0 | 11734 | 2 |
| Mode SS | |||
|---|---|---|---|
| Quadrant | BADHDUFLAG | Total packets | Discarded packets |
| A | 0 | 108 | 0 |
| B | 0 | 108 | 0 |
| C | 0 | 108 | 0 |
| D | 0 | 108 | 0 |
| Mode M9 | |||
|---|---|---|---|
| Quadrant | BADHDUFLAG | Total packets | Discarded packets |
| A | 0 | 33 | 0 |
| B | 0 | 34 | 0 |
| C | 0 | 34 | 0 |
| D | 0 | 34 | 0 |
| Quadrant | Total seconds | Saturated seconds | Saturation percentage |
|---|---|---|---|
| A | 5240 | 14 | 0.267176% |
| B | 5240 | 9 | 0.171756% |
| C | 5240 | 9 | 0.171756% |
| D | 5240 | 33 | 0.629771% |
Noise dominated data is calculated using 1-second bins in cleaned event files. If a bin has >2000 counts, and if more than 50% of those come from <1% of pixels, then it is considered to be noise-dominated and hence unusable.
| Quadrant | # 1 sec bins | Bins with >0 counts | Bins with >2000 counts | High rate bins dominated by noise | Noise dominated (total time) | Noise dominated (detector-on time) | Marked lightcurve |
|---|---|---|---|---|---|---|---|
| A | 7092 | 5241 | 5 | 5 | 0.07% | 0.10% | 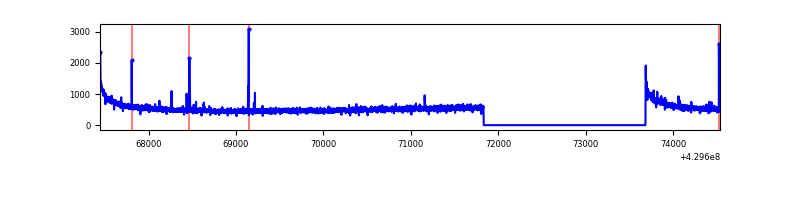 |
| B | 7092 | 5241 | 1 | 1 | 0.01% | 0.02% | 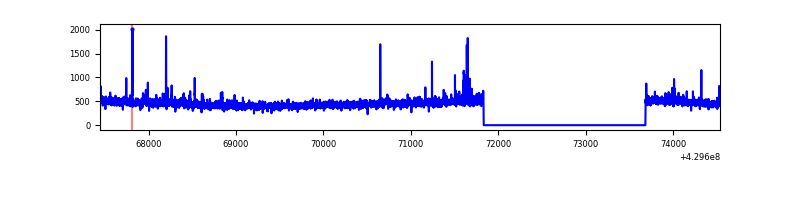 |
| C | 7092 | 5241 | 5 | 5 | 0.07% | 0.10% | 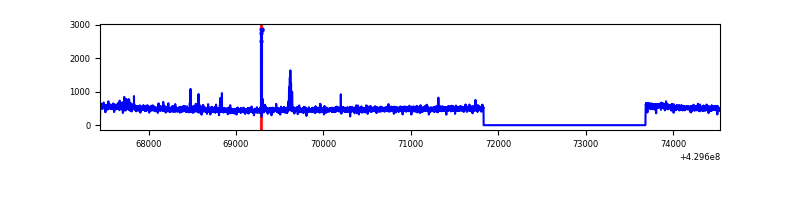 |
| D | 7092 | 5241 | 28 | 28 | 0.39% | 0.53% | 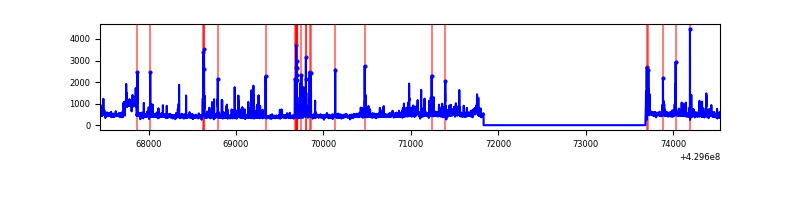 |
Top three noisy pixels from each quadrant. If the there are fewer than three noisy pixels in the level2.evt file, extra rows are filled as -1
| Pixel properties | Quadrant properties | ||||||
|---|---|---|---|---|---|---|---|
| Quadrant | DetID | PixID | Counts | Sigma | Mean | Median | Sigma |
| A | 10 | 83 | 529496 | 4381.89 | 590 | 580 | 120.7 |
| A | 7 | 3 | 16579 | 132.55 | 590 | 580 | 120.7 |
| A | 3 | 137 | 6523 | 49.24 | 590 | 580 | 120.7 |
| B | 0 | 245 | 48808 | 425.93 | 589 | 574 | 113.2 |
| B | 12 | 111 | 14085 | 119.31 | 589 | 574 | 113.2 |
| B | 5 | 255 | 13611 | 115.12 | 589 | 574 | 113.2 |
| C | 15 | 214 | 219494 | 1606.76 | 588 | 593 | 136.2 |
| C | 14 | 254 | 22309 | 159.4 | 588 | 593 | 136.2 |
| C | 5 | 250 | 14997 | 105.73 | 588 | 593 | 136.2 |
| D | 12 | 6 | 146376 | 1029.7 | 584 | 569 | 141.6 |
| D | 1 | 52 | 88635 | 621.93 | 584 | 569 | 141.6 |
| D | 2 | 16 | 79633 | 558.35 | 584 | 569 | 141.6 |
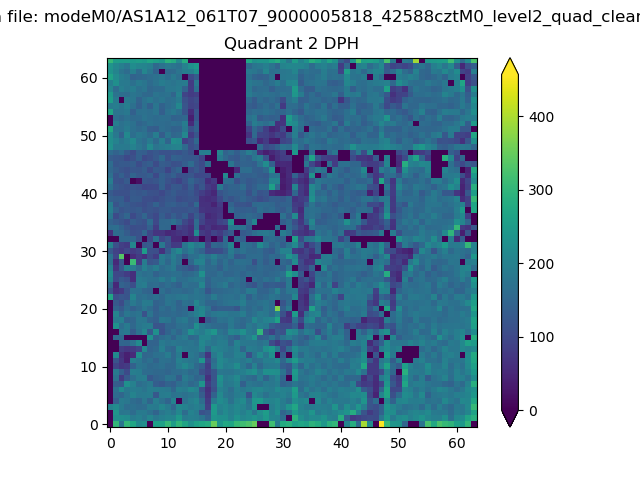
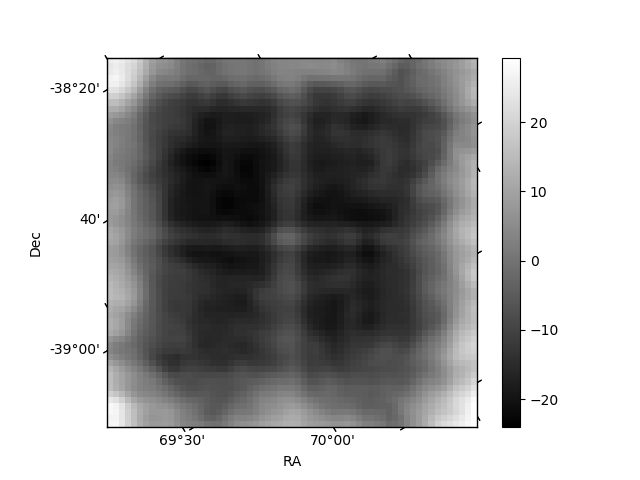
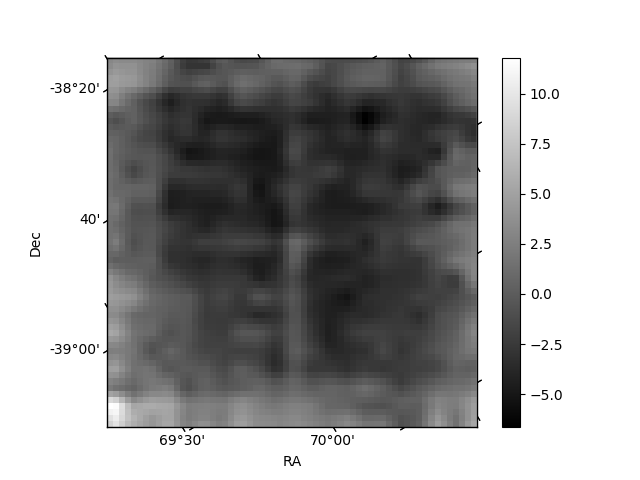
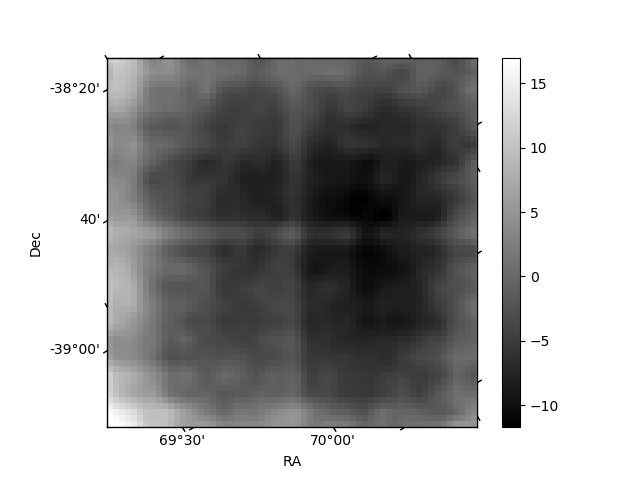
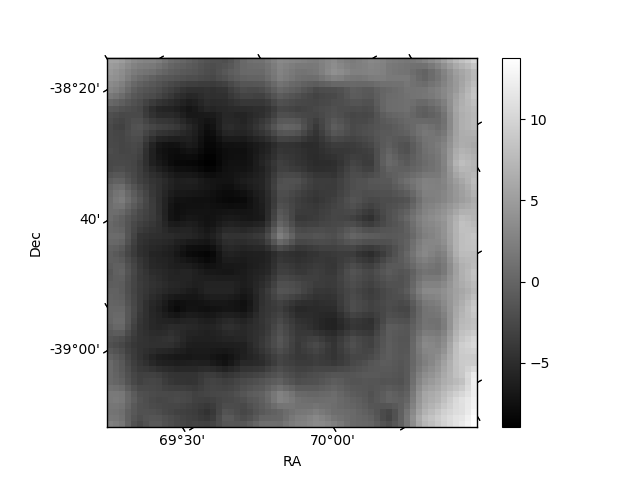
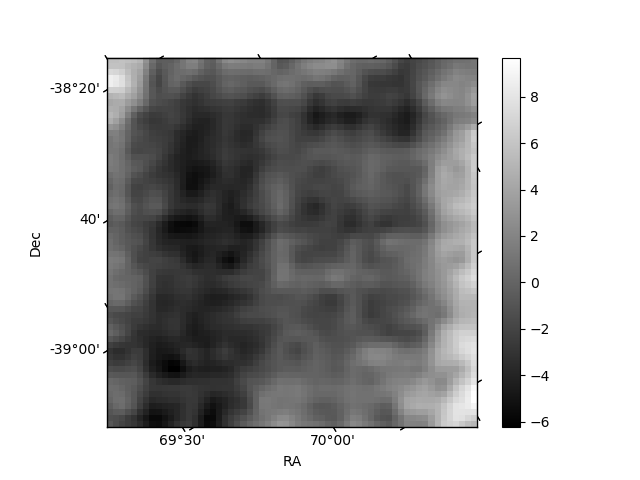
Histogram calculated using DETX and DETY for each event in the final _common_clean file
| Quadrant A | 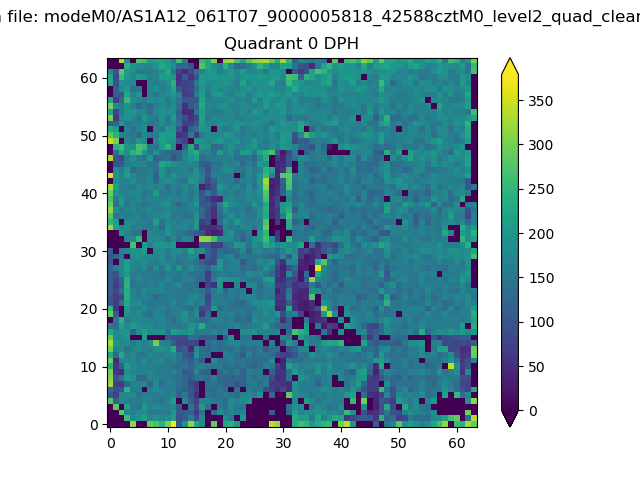 |
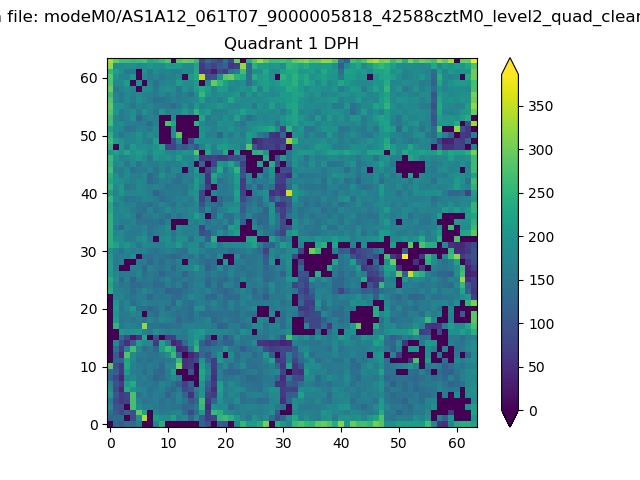 |
Quadrant B |
|---|---|---|---|
| Quadrant D | 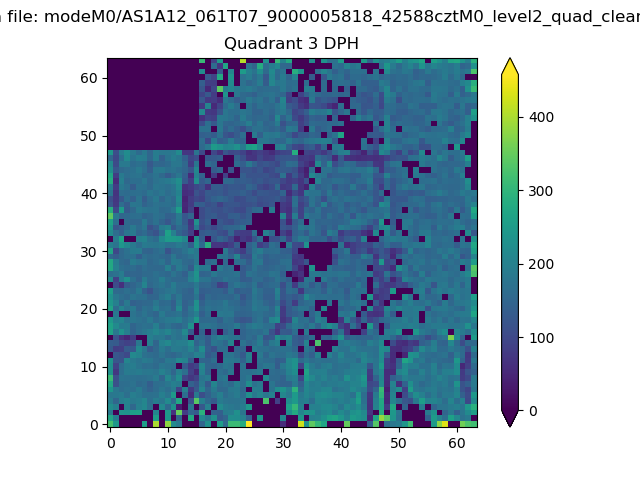 |
 |
Quadrant C |
| Plot type | Count rate plots | Images |
|---|---|---|
| Comparison with Poisson distribution Blue bars denote a histogram of data divided into 1 sec bins. Red curve is a Poisson curve with rate = median count rate of data. |
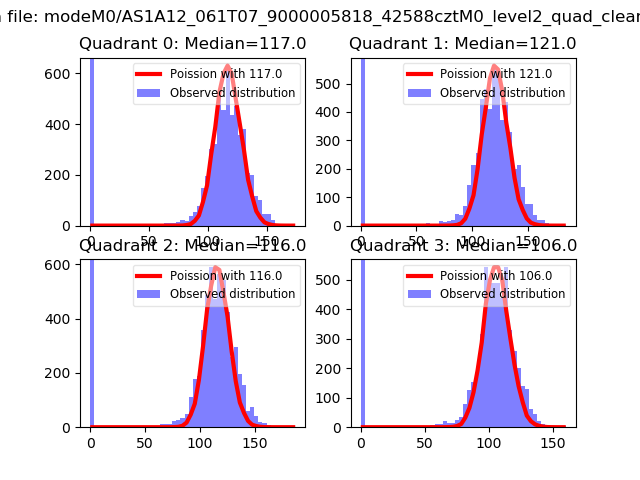 |
 |
| Quadrant-wise count rates Data is divided into 100 sec bins |
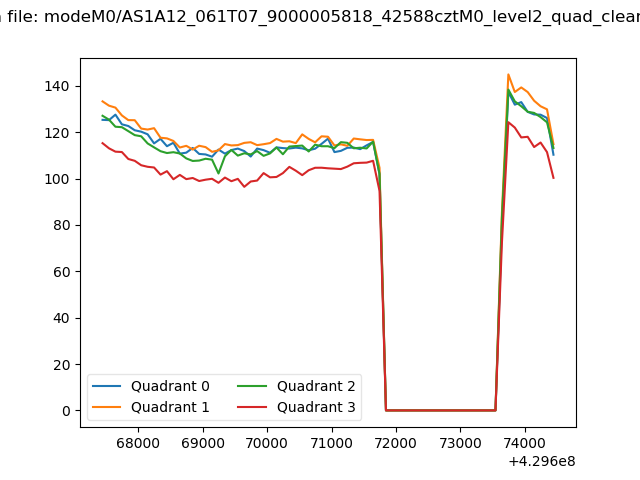 |
|
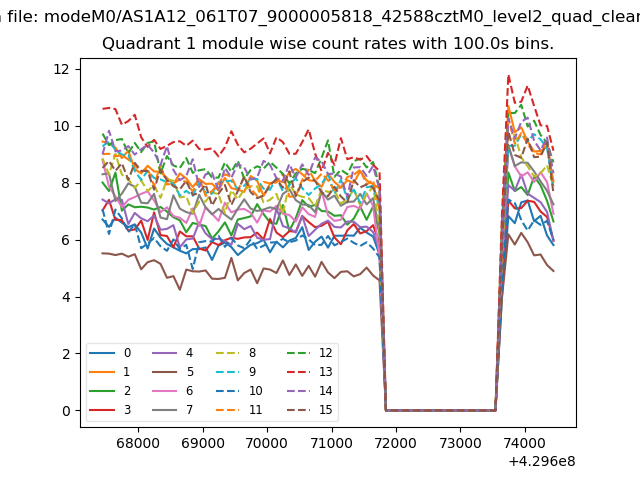
| Module-wise count rates for Quadrant A Data is divided into 100 sec bins |
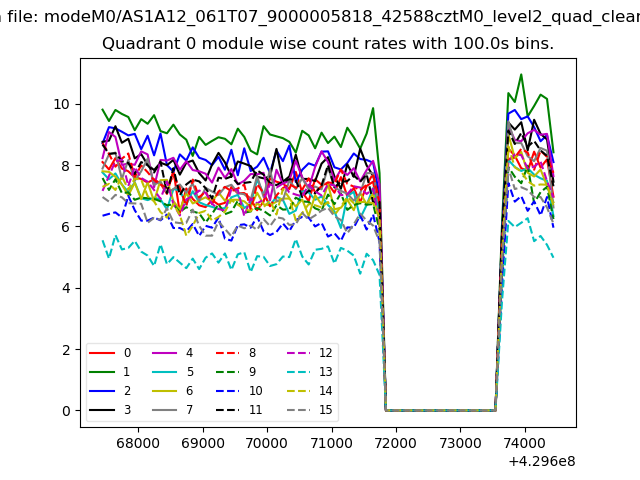 |
 |
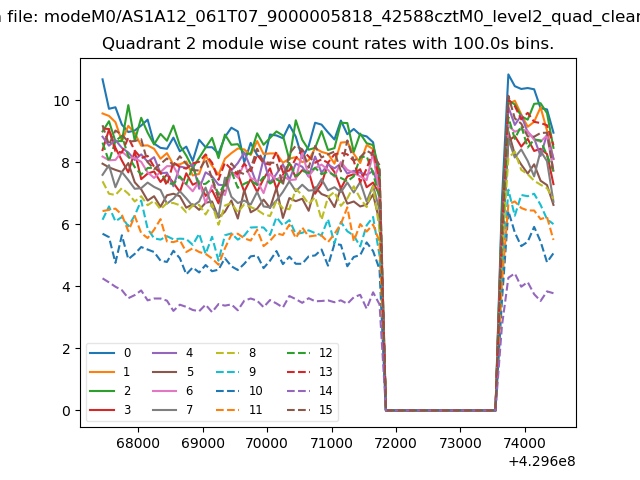
| Module-wise count rates for Quadrant B Data is divided into 100 sec bins |
 |
 |
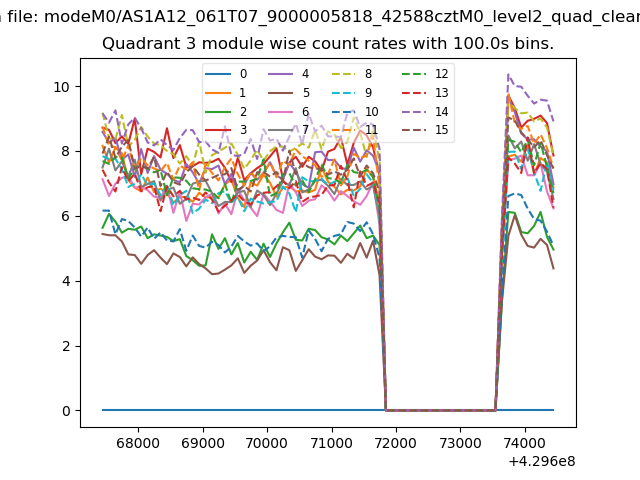
| Module-wise count rates for Quadrant C Data is divided into 100 sec bins |
 |
 |
| Module-wise count rates for Quadrant D Data is divided into 100 sec bins |
 |
 |
| Parameter | Plot |
|---|---|
| CZT HV Monitor | 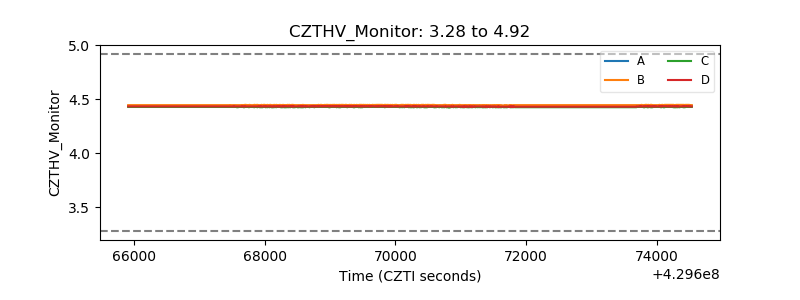 |
| D_VDD | 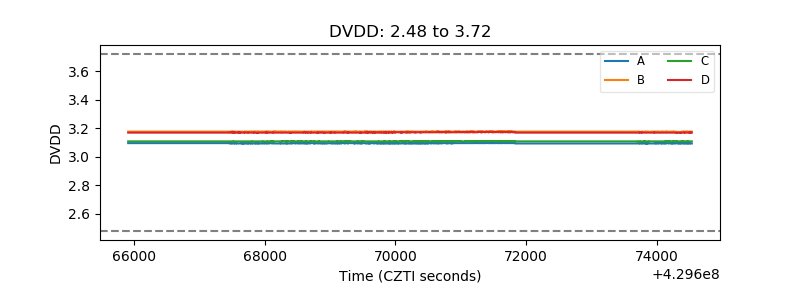 |
| Temperature 1 | 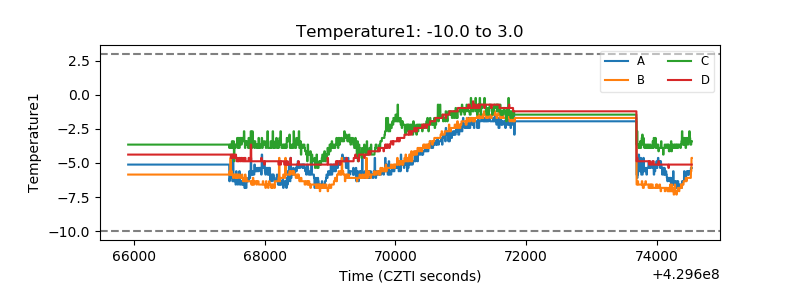 |
| Veto HV Monitor | 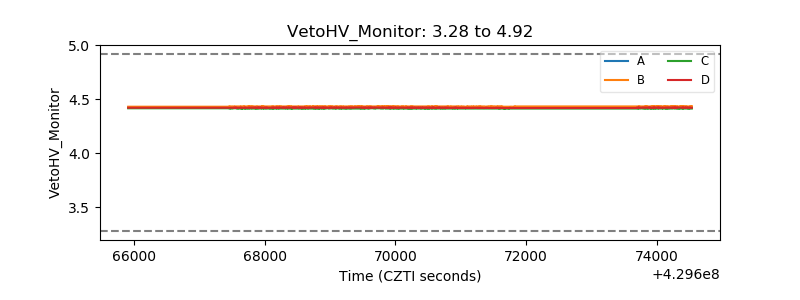 |
| Veto LLD | 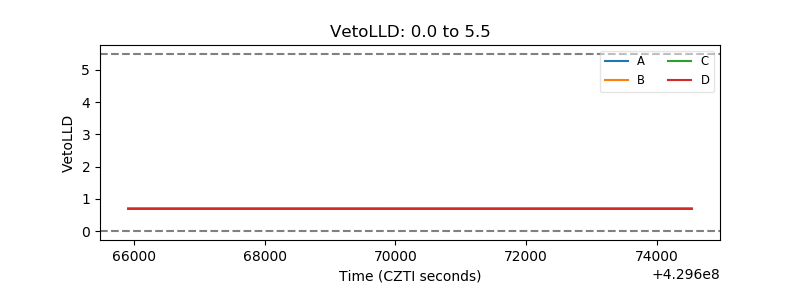 |
| Alpha Counter |  |
| _CPM_Rate | 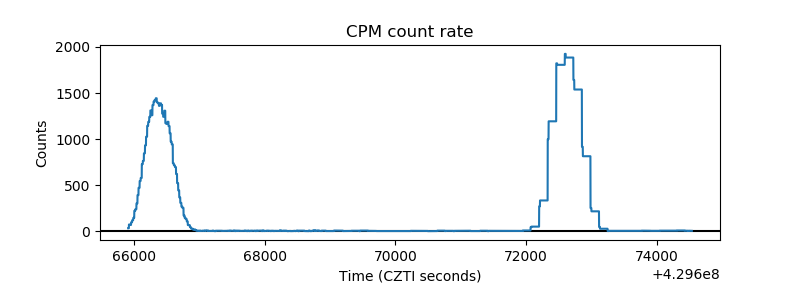 |
| CZT Counter | 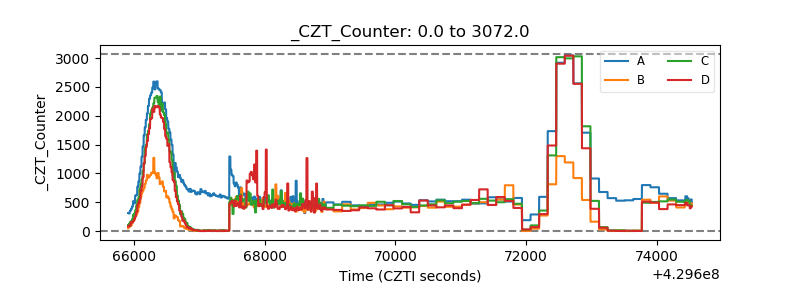 |
| +2.5 Volts monitor |  |
| +5 Volts monitor | 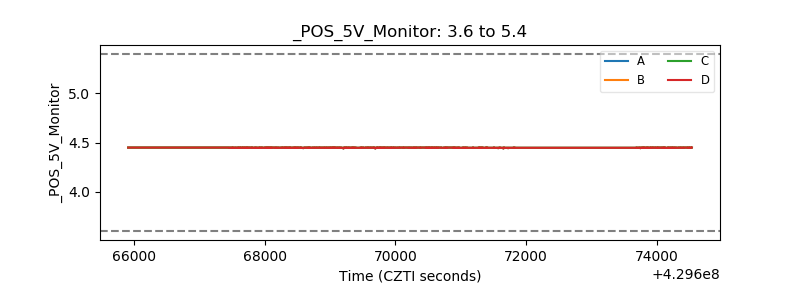 |
| _ROLL_ROT | 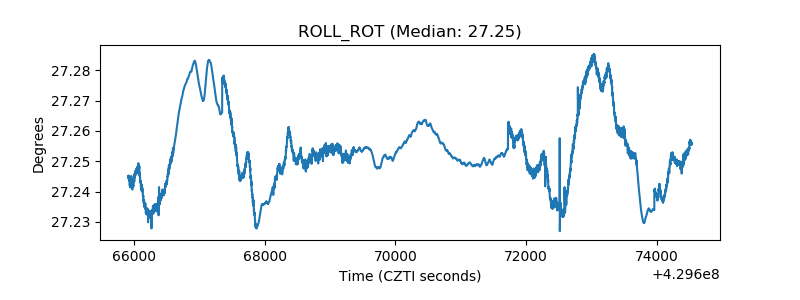 |
| _Roll_DEC | 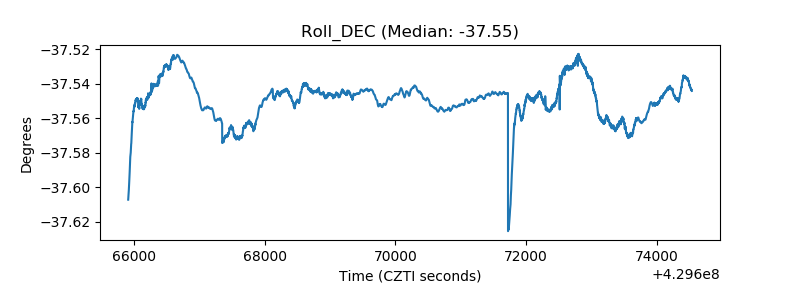 |
| _Roll_RA | 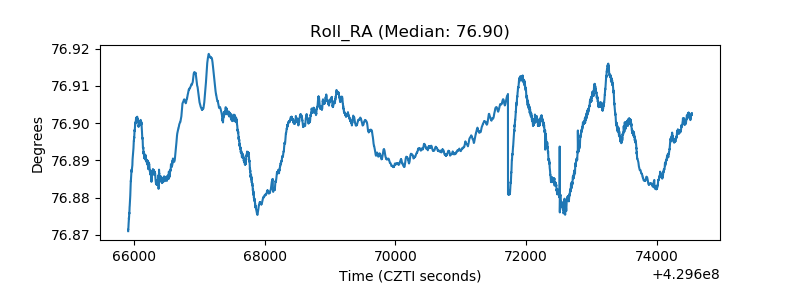 |
| Veto Counter | 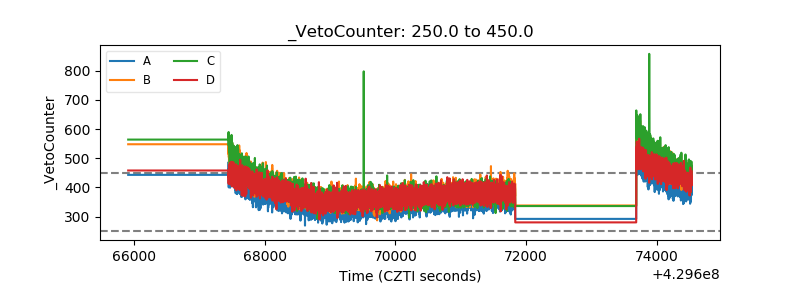 |