| Param | Original file | Final file |
|---|---|---|
| Filename | modeM0/AS1A12_061T07_9000005818_42589cztM0_level2.fits | modeM0/AS1A12_061T07_9000005818_42589cztM0_level2_quad_clean.evt |
| Size (bytes) | 288,668,160 | 91,584,000 |
| Size | 275.3 MB | 87.3 MB |
| Events in quadrant A | 2,826,241 | 610,539 |
| Events in quadrant B | 2,372,007 | 634,986 |
| Events in quadrant C | 2,504,607 | 615,177 |
| Events in quadrant D | 2,587,695 | 557,709 |
| Mode M0 | |||
|---|---|---|---|
| Quadrant | BADHDUFLAG | Total packets | Discarded packets |
| A | 0 | 11358 | 2 |
| B | 0 | 10361 | 2 |
| C | 0 | 10358 | 2 |
| D | 0 | 11068 | 2 |
| Mode SS | |||
|---|---|---|---|
| Quadrant | BADHDUFLAG | Total packets | Discarded packets |
| A | 0 | 104 | 0 |
| B | 0 | 104 | 0 |
| C | 0 | 104 | 0 |
| D | 0 | 104 | 0 |
| Mode M9 | |||
|---|---|---|---|
| Quadrant | BADHDUFLAG | Total packets | Discarded packets |
| A | 0 | 31 | 0 |
| B | 0 | 32 | 0 |
| C | 0 | 32 | 0 |
| D | 0 | 32 | 0 |
| Quadrant | Total seconds | Saturated seconds | Saturation percentage |
|---|---|---|---|
| A | 5064 | 19 | 0.375197% |
| B | 5064 | 6 | 0.118483% |
| C | 5064 | 5 | 0.098736% |
| D | 5064 | 39 | 0.770142% |
Noise dominated data is calculated using 1-second bins in cleaned event files. If a bin has >2000 counts, and if more than 50% of those come from <1% of pixels, then it is considered to be noise-dominated and hence unusable.
| Quadrant | # 1 sec bins | Bins with >0 counts | Bins with >2000 counts | High rate bins dominated by noise | Noise dominated (total time) | Noise dominated (detector-on time) | Marked lightcurve |
|---|---|---|---|---|---|---|---|
| A | 7067 | 5065 | 8 | 8 | 0.11% | 0.16% | 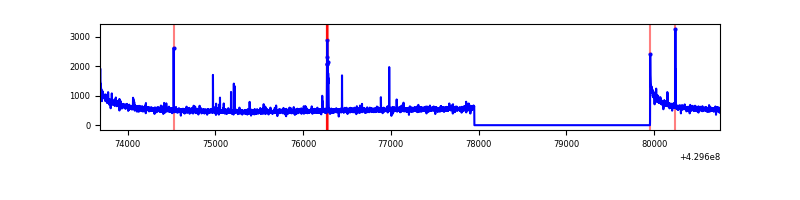 |
| B | 7067 | 5065 | 0 | 0 | 0.00% | 0.00% | 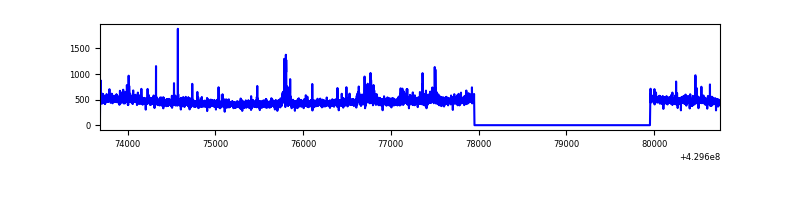 |
| C | 7067 | 5065 | 1 | 1 | 0.01% | 0.02% | 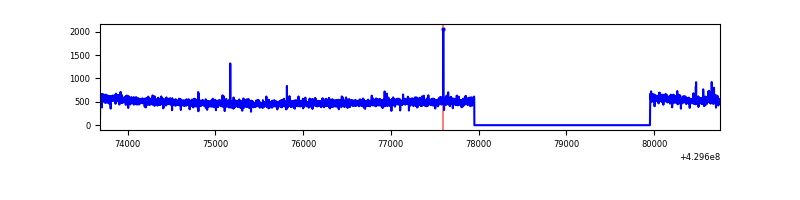 |
| D | 7067 | 5065 | 40 | 40 | 0.57% | 0.79% | 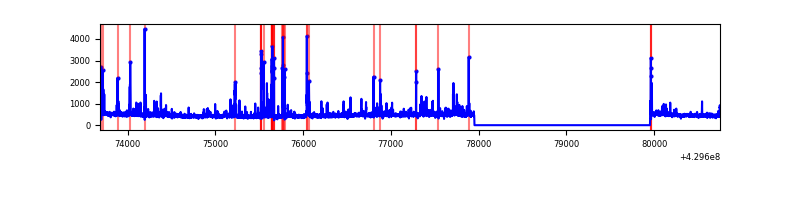 |
Top three noisy pixels from each quadrant. If the there are fewer than three noisy pixels in the level2.evt file, extra rows are filled as -1
| Pixel properties | Quadrant properties | ||||||
|---|---|---|---|---|---|---|---|
| Quadrant | DetID | PixID | Counts | Sigma | Mean | Median | Sigma |
| A | 10 | 83 | 518985 | 4391.72 | 581 | 568 | 118.0 |
| A | 15 | 237 | 37183 | 310.18 | 581 | 568 | 118.0 |
| A | 9 | 254 | 14750 | 120.14 | 581 | 568 | 118.0 |
| B | 0 | 245 | 32934 | 292.56 | 579 | 562 | 110.7 |
| B | 5 | 172 | 27467 | 243.15 | 579 | 562 | 110.7 |
| B | 5 | 255 | 19677 | 172.75 | 579 | 562 | 110.7 |
| C | 15 | 214 | 212680 | 1568.61 | 583 | 590 | 135.2 |
| C | 12 | 249 | 5143 | 33.67 | 583 | 590 | 135.2 |
| C | 4 | 254 | 4918 | 32.01 | 583 | 590 | 135.2 |
| D | 12 | 6 | 104496 | 749.24 | 577 | 562 | 138.7 |
| D | 1 | 52 | 98069 | 702.91 | 577 | 562 | 138.7 |
| D | 13 | 249 | 73988 | 529.31 | 577 | 562 | 138.7 |
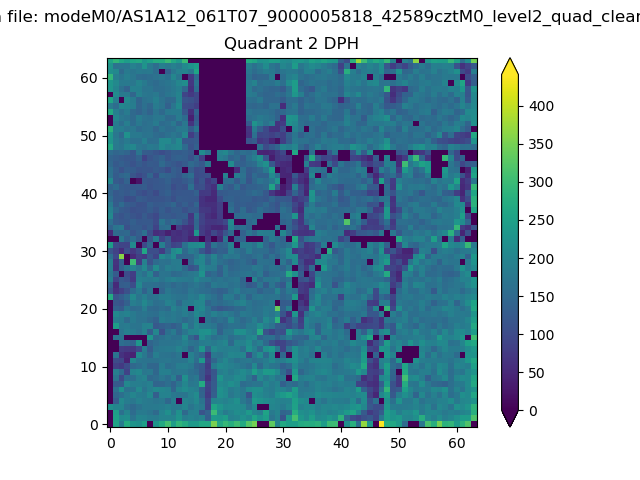
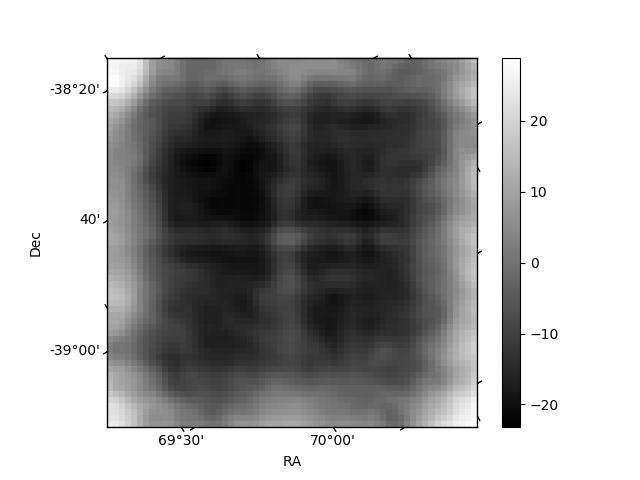
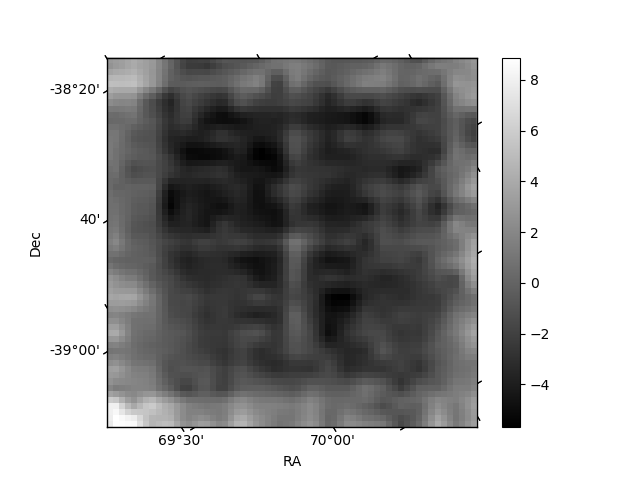
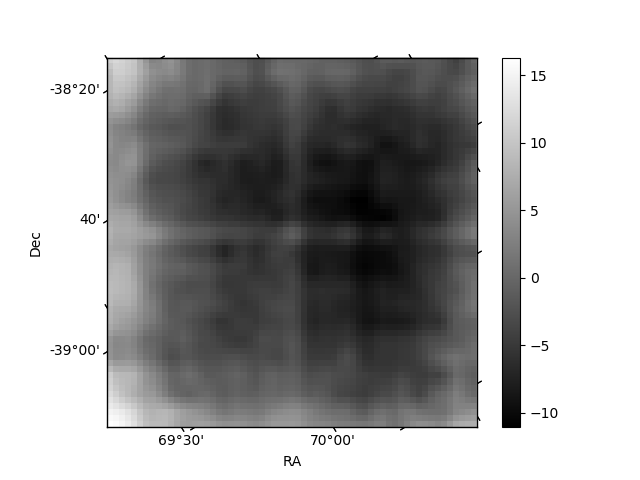
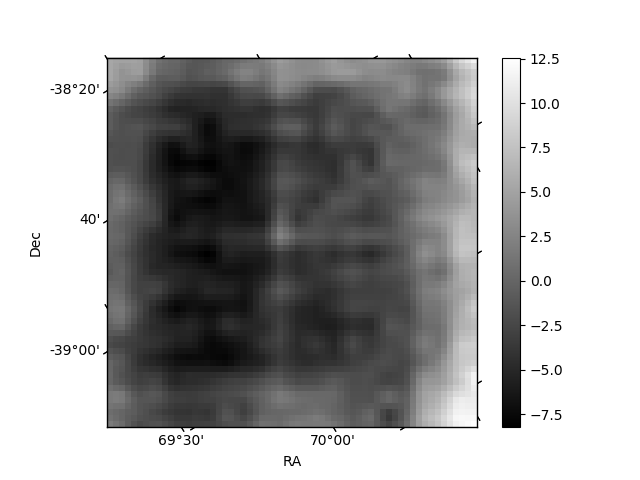
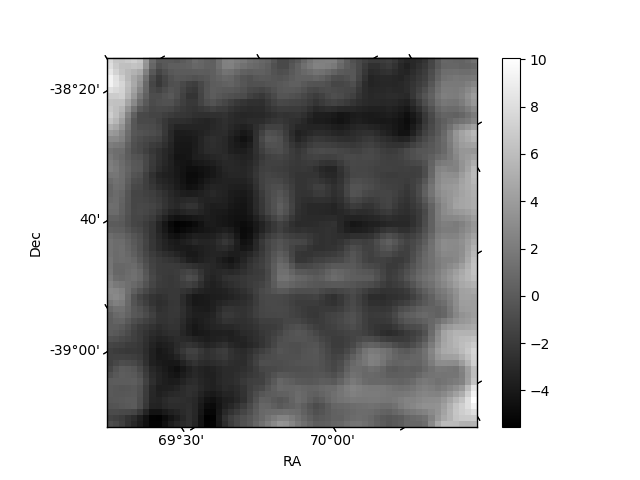
Histogram calculated using DETX and DETY for each event in the final _common_clean file
| Quadrant A | 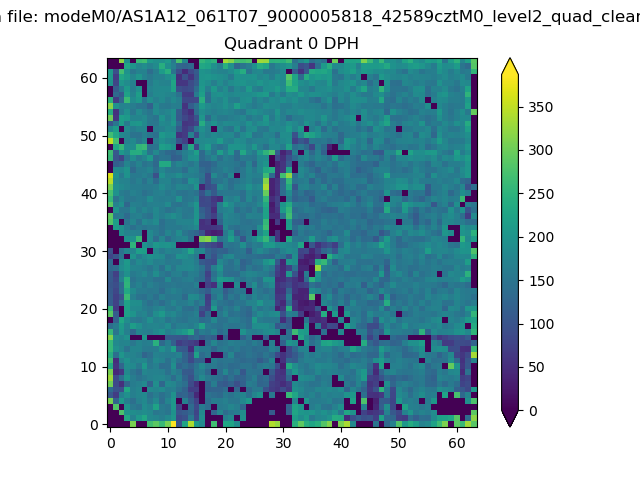 |
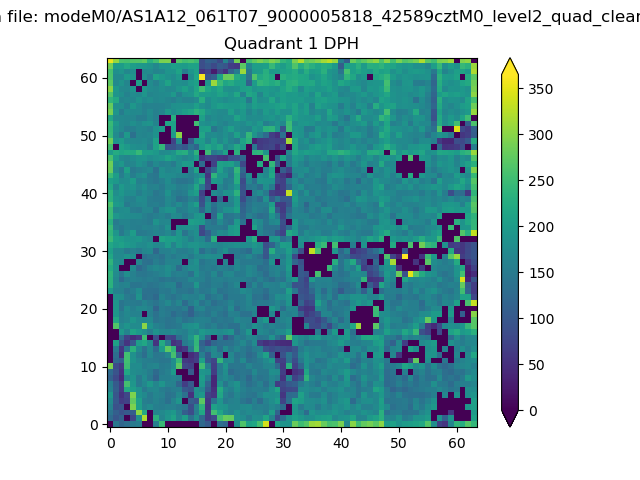 |
Quadrant B |
|---|---|---|---|
| Quadrant D | 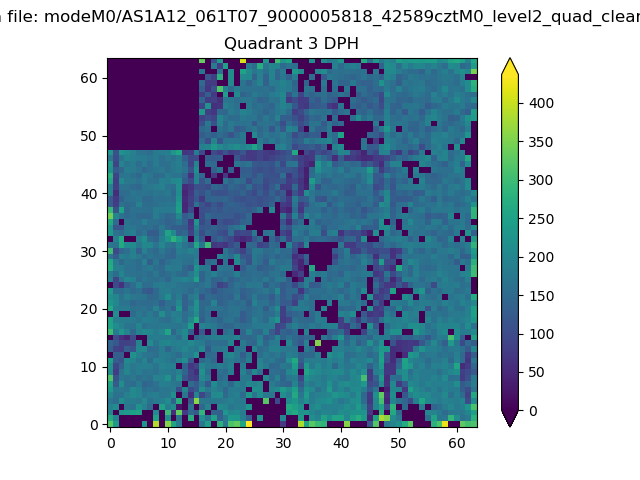 |
 |
Quadrant C |
| Plot type | Count rate plots | Images |
|---|---|---|
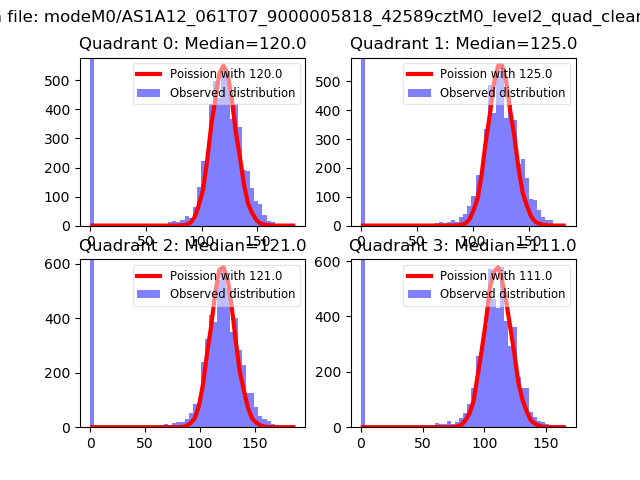
| Comparison with Poisson distribution Blue bars denote a histogram of data divided into 1 sec bins. Red curve is a Poisson curve with rate = median count rate of data. |
 |
 |
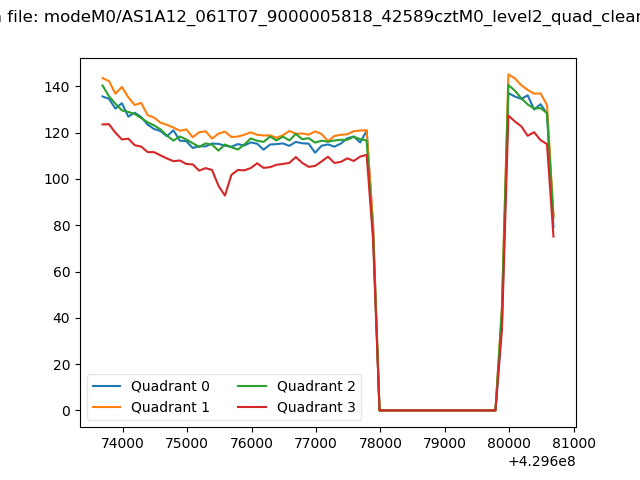
| Quadrant-wise count rates Data is divided into 100 sec bins |
 |
|
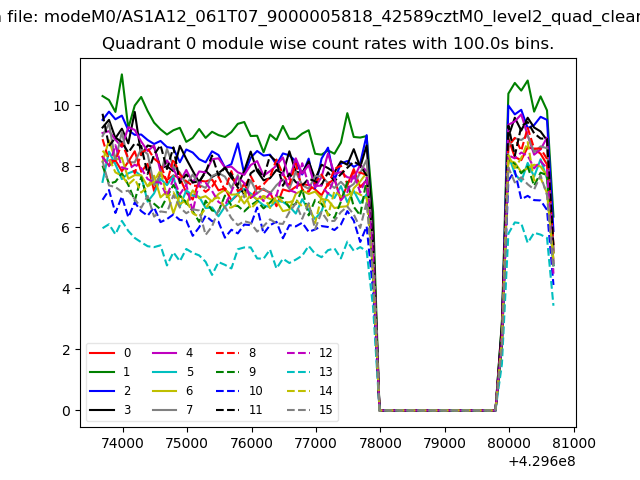
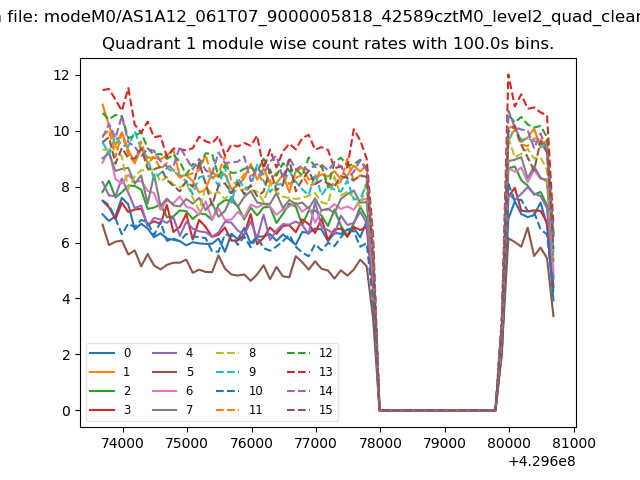
| Module-wise count rates for Quadrant A Data is divided into 100 sec bins |
 |
 |
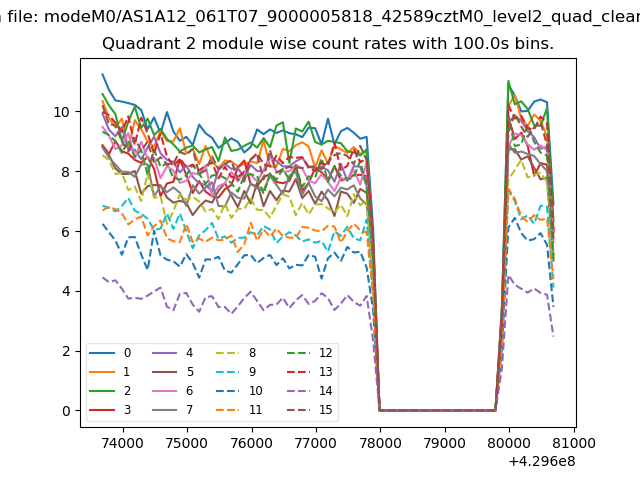
| Module-wise count rates for Quadrant B Data is divided into 100 sec bins |
 |
 |
| Module-wise count rates for Quadrant C Data is divided into 100 sec bins |
 |
 |
| Module-wise count rates for Quadrant D Data is divided into 100 sec bins |
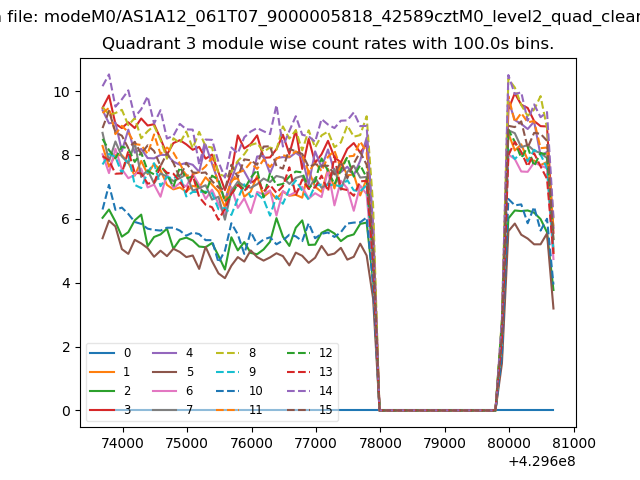 |
 |
| Parameter | Plot |
|---|---|
| CZT HV Monitor | 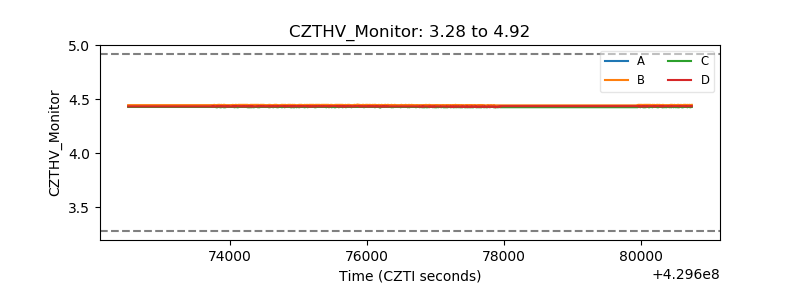 |
| D_VDD | 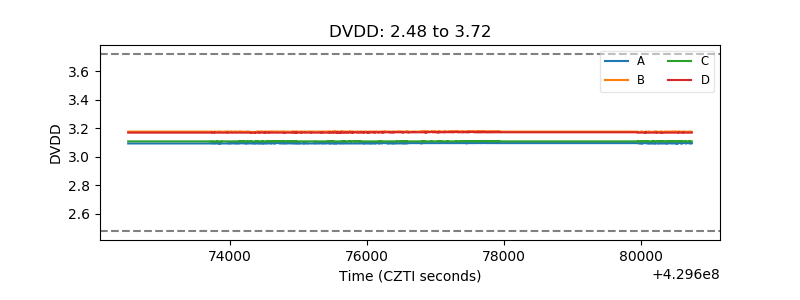 |
| Temperature 1 | 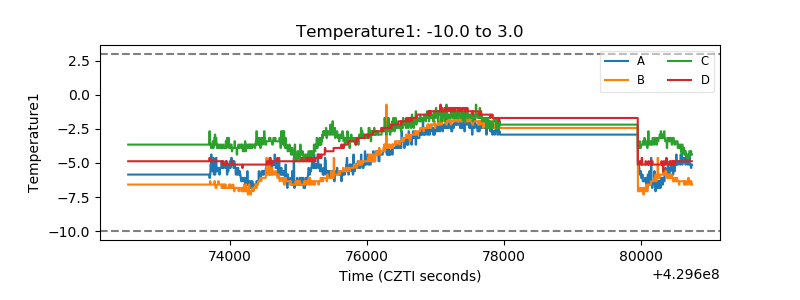 |
| Veto HV Monitor | 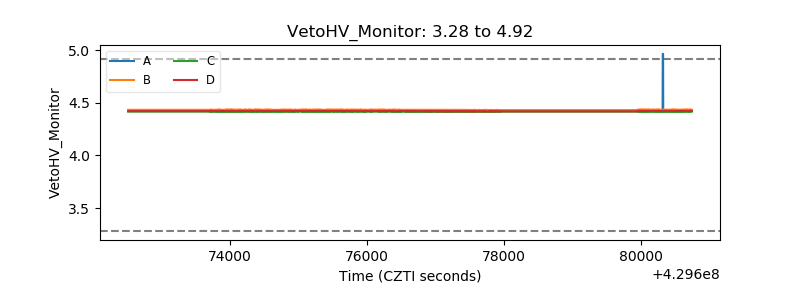 |
| Veto LLD | 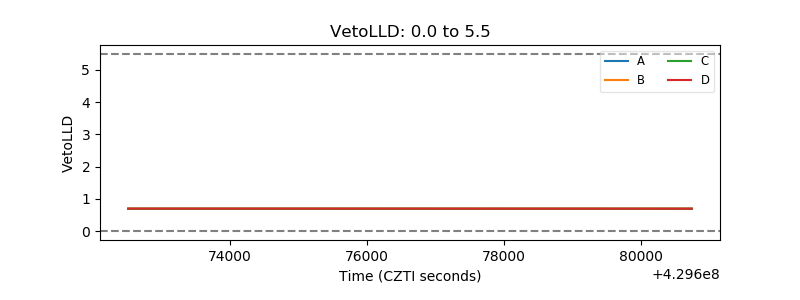 |
| Alpha Counter | 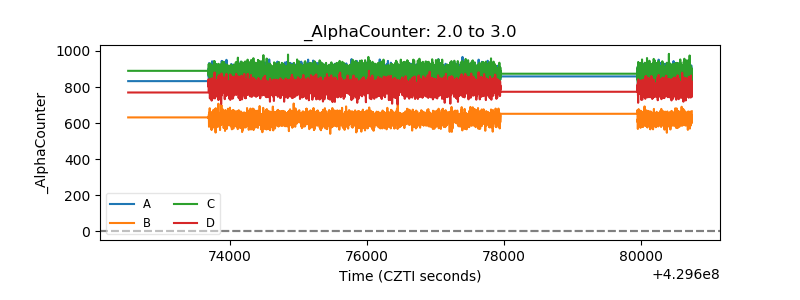 |
| _CPM_Rate | 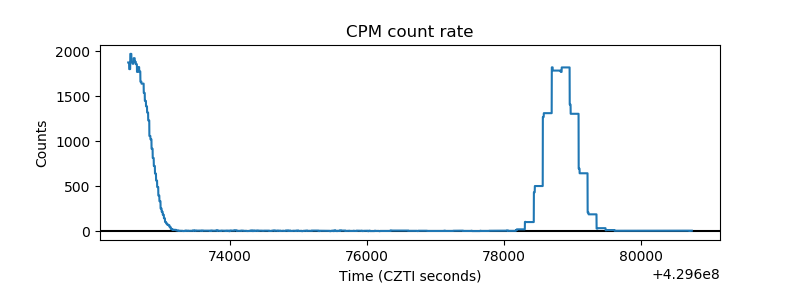 |
| CZT Counter | 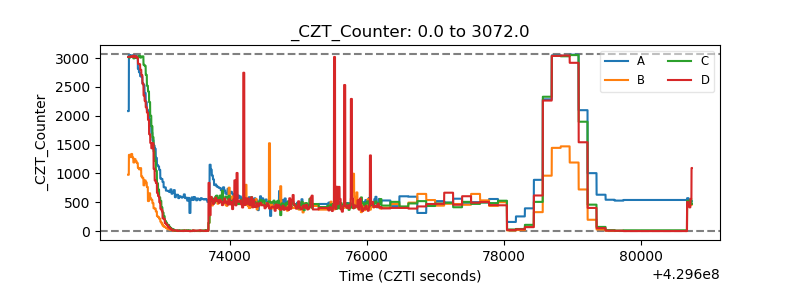 |
| +2.5 Volts monitor |  |
| +5 Volts monitor | 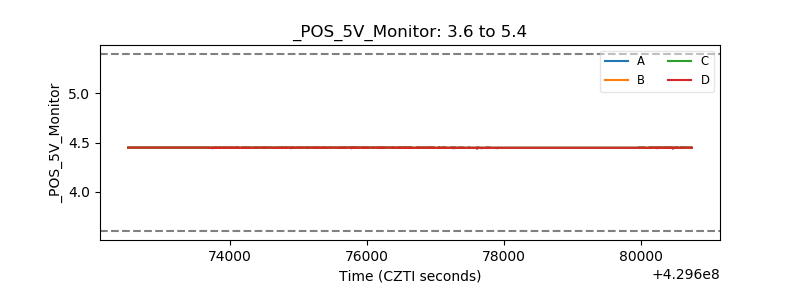 |
| _ROLL_ROT | 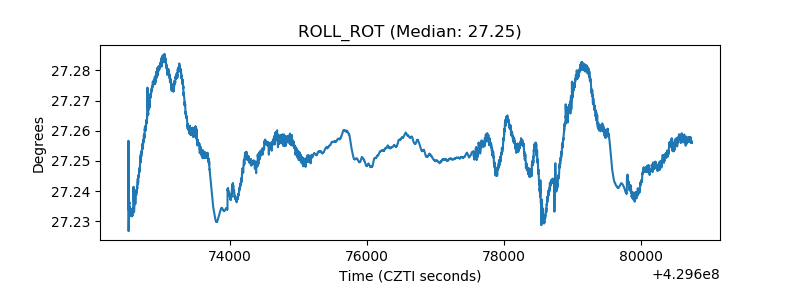 |
| _Roll_DEC | 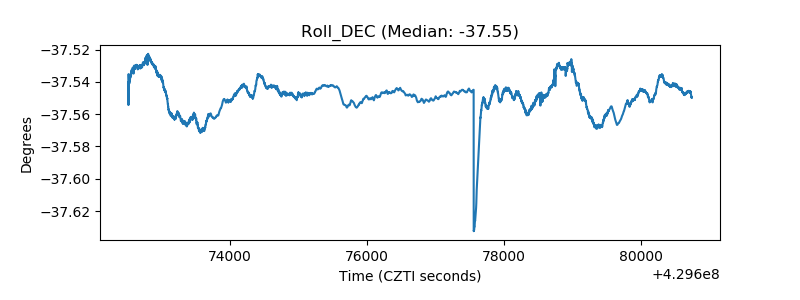 |
| _Roll_RA | 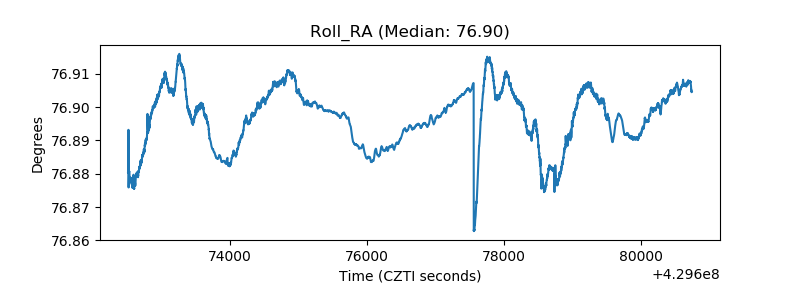 |
| Veto Counter | 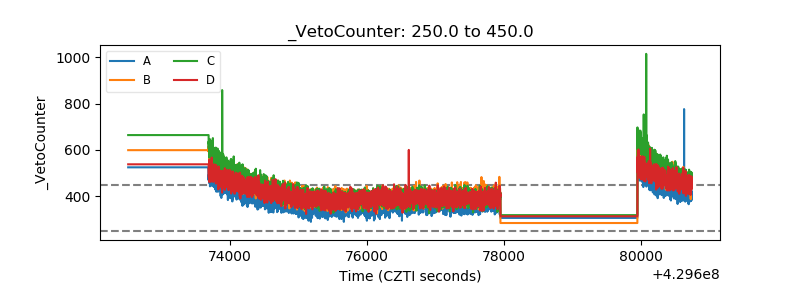 |