| Param | Original file | Final file |
|---|---|---|
| Filename | modeM0/AS1A12_061T07_9000005818_42590cztM0_level2.fits | modeM0/AS1A12_061T07_9000005818_42590cztM0_level2_quad_clean.evt |
| Size (bytes) | 286,920,000 | 90,308,160 |
| Size | 273.6 MB | 86.1 MB |
| Events in quadrant A | 2,781,817 | 603,587 |
| Events in quadrant B | 2,335,179 | 624,949 |
| Events in quadrant C | 2,465,947 | 608,272 |
| Events in quadrant D | 2,651,147 | 550,535 |
| Mode M0 | |||
|---|---|---|---|
| Quadrant | BADHDUFLAG | Total packets | Discarded packets |
| A | 0 | 11173 | 3 |
| B | 0 | 10152 | 2 |
| C | 0 | 10148 | 2 |
| D | 0 | 11198 | 2 |
| Mode SS | |||
|---|---|---|---|
| Quadrant | BADHDUFLAG | Total packets | Discarded packets |
| A | 0 | 100 | 0 |
| B | 0 | 100 | 0 |
| C | 0 | 100 | 0 |
| D | 0 | 100 | 0 |
| Mode M9 | |||
|---|---|---|---|
| Quadrant | BADHDUFLAG | Total packets | Discarded packets |
| A | 0 | 31 | 0 |
| B | 0 | 32 | 0 |
| C | 0 | 32 | 0 |
| D | 0 | 32 | 0 |
| Quadrant | Total seconds | Saturated seconds | Saturation percentage |
|---|---|---|---|
| A | 4957 | 17 | 0.342949% |
| B | 4957 | 16 | 0.322776% |
| C | 4957 | 6 | 0.121041% |
| D | 4957 | 60 | 1.210410% |
Noise dominated data is calculated using 1-second bins in cleaned event files. If a bin has >2000 counts, and if more than 50% of those come from <1% of pixels, then it is considered to be noise-dominated and hence unusable.
| Quadrant | # 1 sec bins | Bins with >0 counts | Bins with >2000 counts | High rate bins dominated by noise | Noise dominated (total time) | Noise dominated (detector-on time) | Marked lightcurve |
|---|---|---|---|---|---|---|---|
| A | 7049 | 4958 | 7 | 7 | 0.10% | 0.14% | 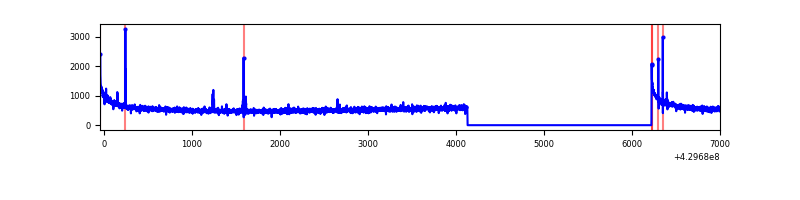 |
| B | 7049 | 4958 | 8 | 8 | 0.11% | 0.16% | 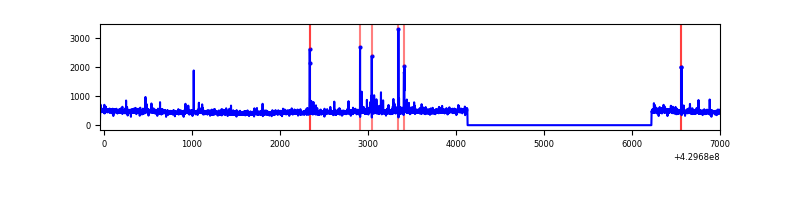 |
| C | 7049 | 4958 | 0 | 0 | 0.00% | 0.00% | 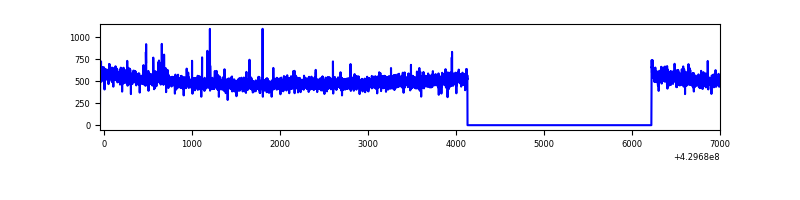 |
| D | 7049 | 4958 | 49 | 49 | 0.70% | 0.99% | 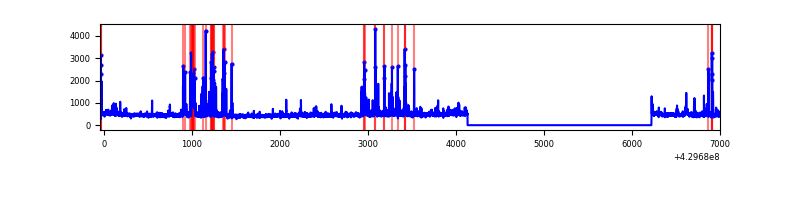 |
Top three noisy pixels from each quadrant. If the there are fewer than three noisy pixels in the level2.evt file, extra rows are filled as -1
| Pixel properties | Quadrant properties | ||||||
|---|---|---|---|---|---|---|---|
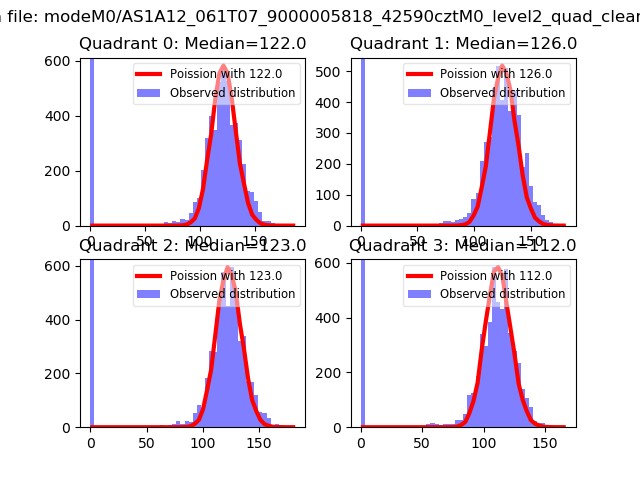
| Quadrant | DetID | PixID | Counts | Sigma | Mean | Median | Sigma |
| A | 10 | 83 | 521222 | 4471.59 | 572 | 560 | 116.4 |
| A | 15 | 237 | 21709 | 181.63 | 572 | 560 | 116.4 |
| A | 13 | 248 | 17849 | 148.48 | 572 | 560 | 116.4 |
| B | 5 | 255 | 55448 | 504.0 | 569 | 553 | 108.9 |
| B | 0 | 245 | 28421 | 255.86 | 569 | 553 | 108.9 |
| B | 5 | 252 | 15464 | 136.9 | 569 | 553 | 108.9 |
| C | 15 | 214 | 208909 | 1586.88 | 572 | 575 | 131.3 |
| C | 12 | 249 | 8013 | 56.65 | 572 | 575 | 131.3 |
| C | 4 | 254 | 6499 | 45.12 | 572 | 575 | 131.3 |
| D | 1 | 47 | 146697 | 1064.59 | 568 | 554 | 137.3 |
| D | 12 | 6 | 134212 | 973.64 | 568 | 554 | 137.3 |
| D | 13 | 249 | 114133 | 827.37 | 568 | 554 | 137.3 |
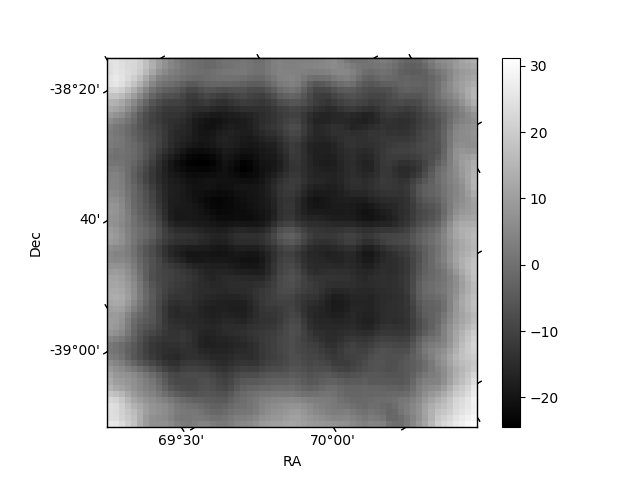
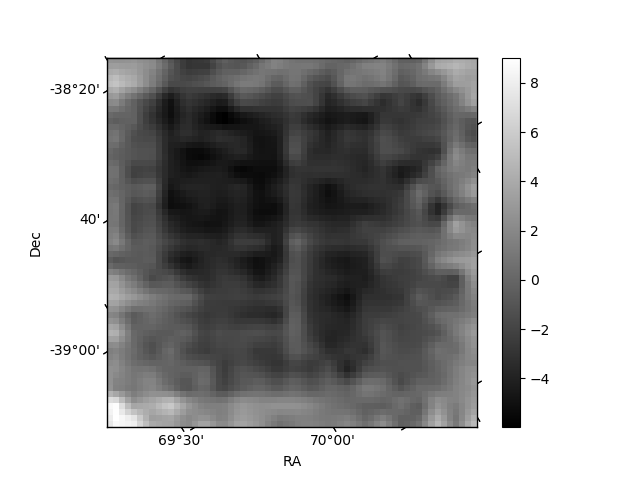
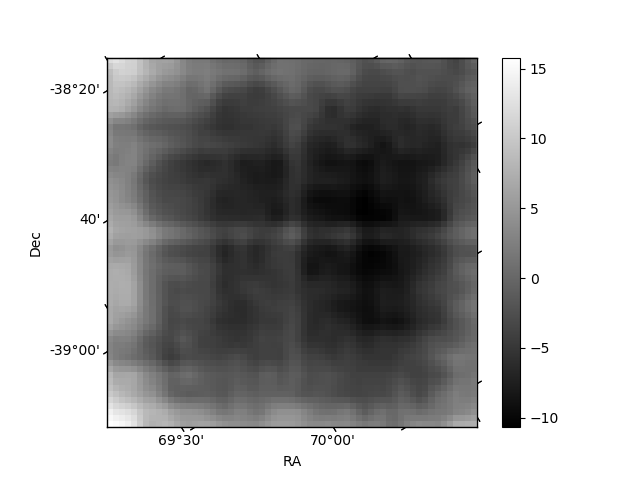
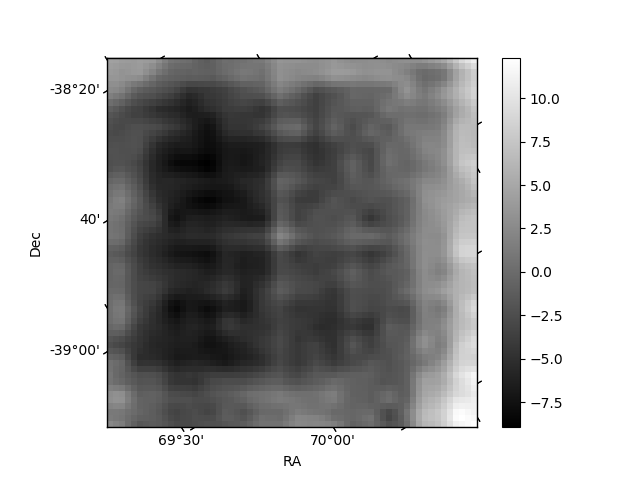
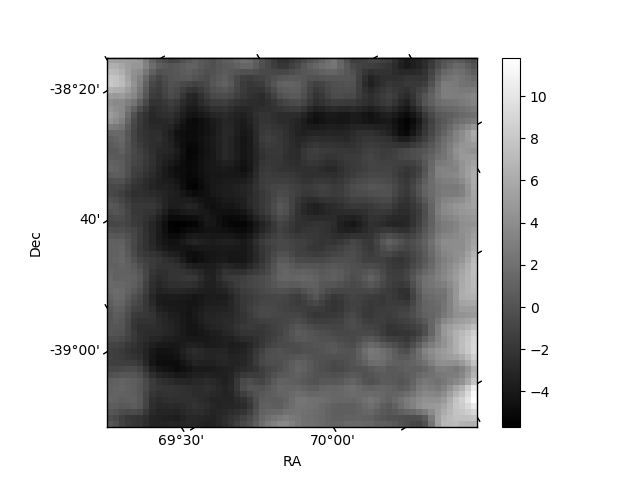
Histogram calculated using DETX and DETY for each event in the final _common_clean file
| Quadrant A | 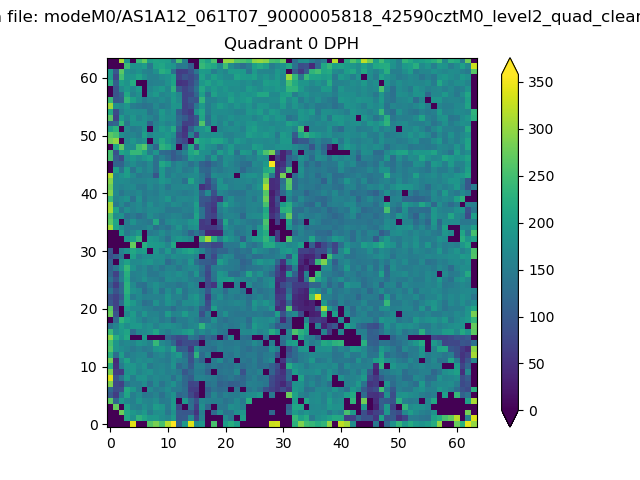 |
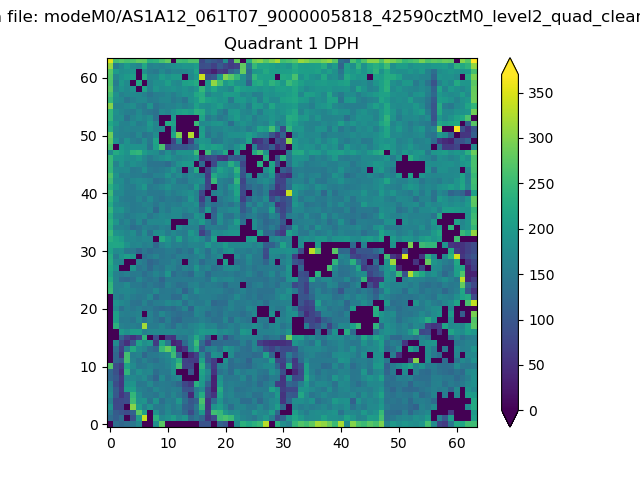 |
Quadrant B |
|---|---|---|---|
| Quadrant D | 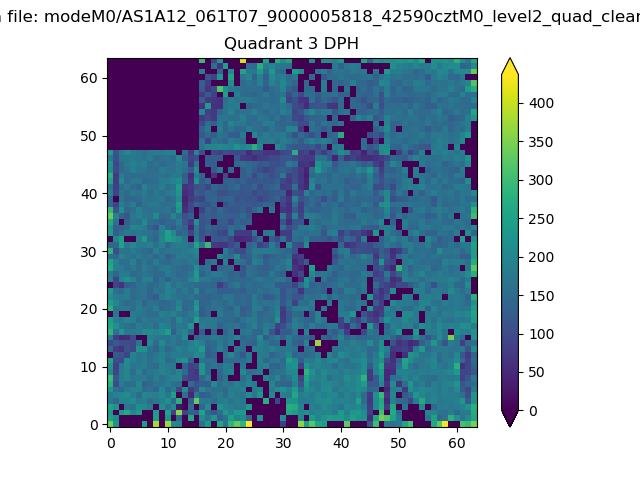 |
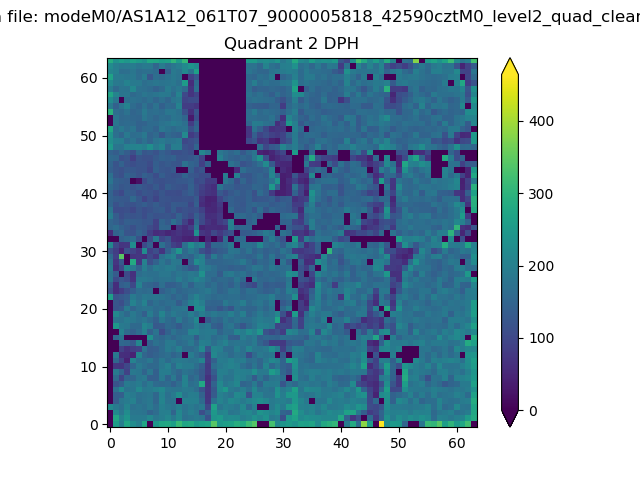 |
Quadrant C |
| Plot type | Count rate plots | Images |
|---|---|---|
| Comparison with Poisson distribution Blue bars denote a histogram of data divided into 1 sec bins. Red curve is a Poisson curve with rate = median count rate of data. |
 |
 |
| Quadrant-wise count rates Data is divided into 100 sec bins |
 |
|
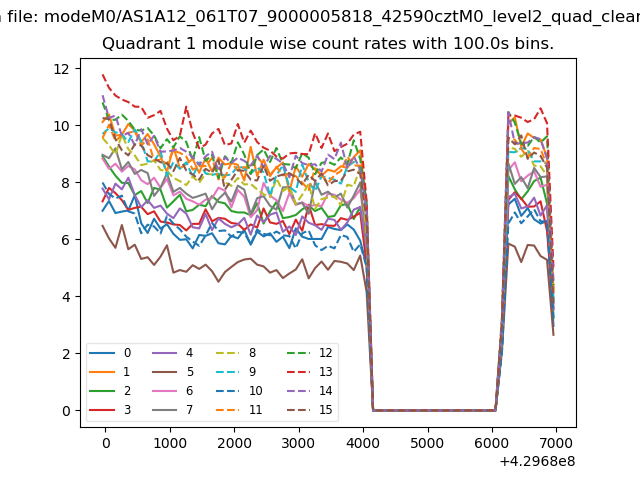
| Module-wise count rates for Quadrant A Data is divided into 100 sec bins |
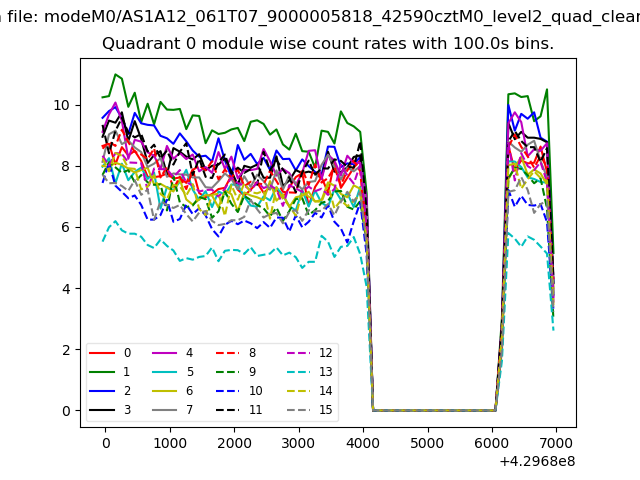 |
 |
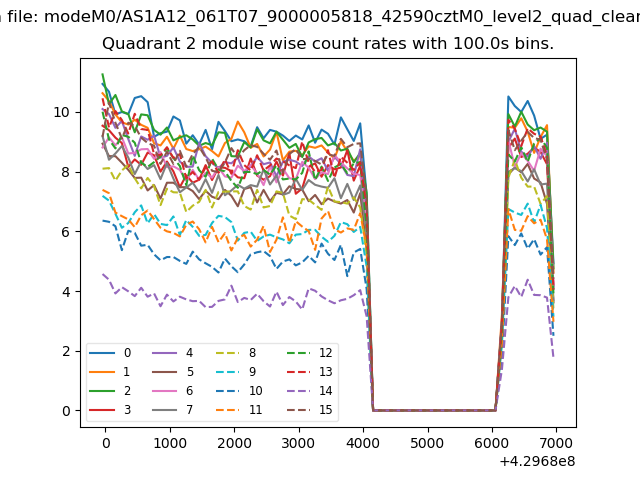
| Module-wise count rates for Quadrant B Data is divided into 100 sec bins |
 |
 |
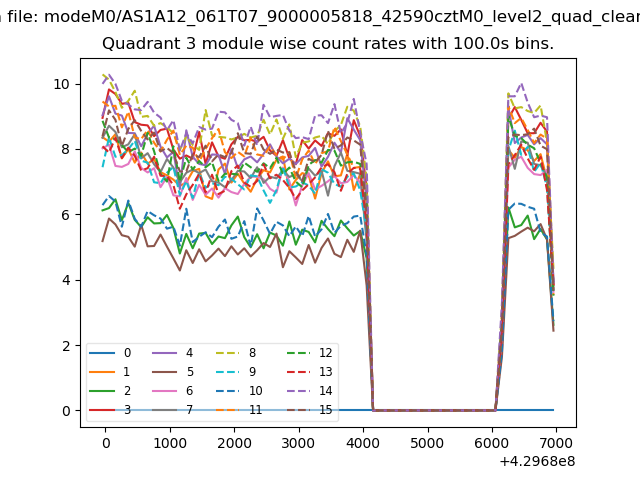
| Module-wise count rates for Quadrant C Data is divided into 100 sec bins |
 |
 |
| Module-wise count rates for Quadrant D Data is divided into 100 sec bins |
 |
 |
| Parameter | Plot |
|---|---|
| CZT HV Monitor | 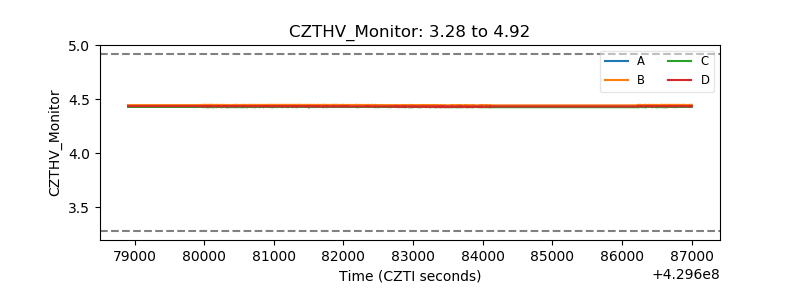 |
| D_VDD | 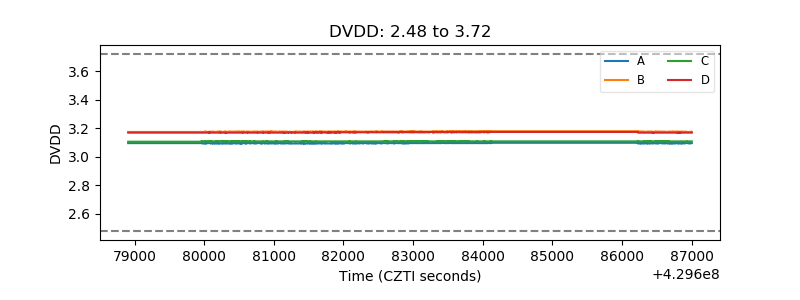 |
| Temperature 1 | 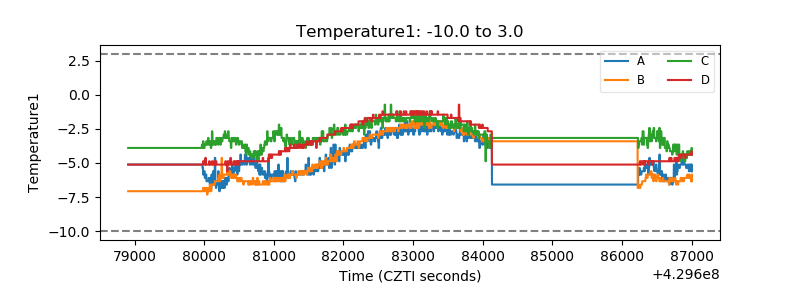 |
| Veto HV Monitor | 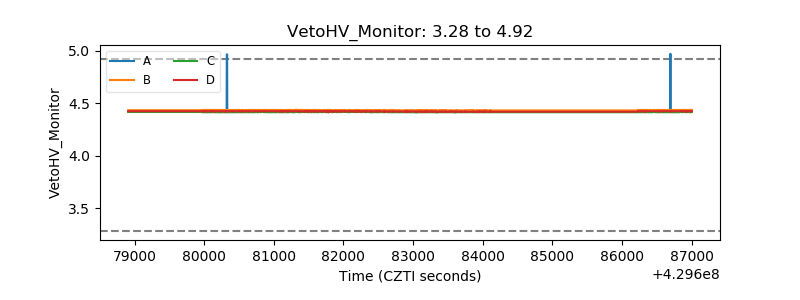 |
| Veto LLD | 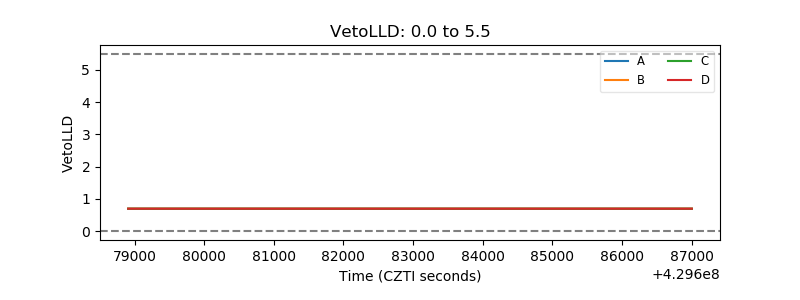 |
| Alpha Counter | 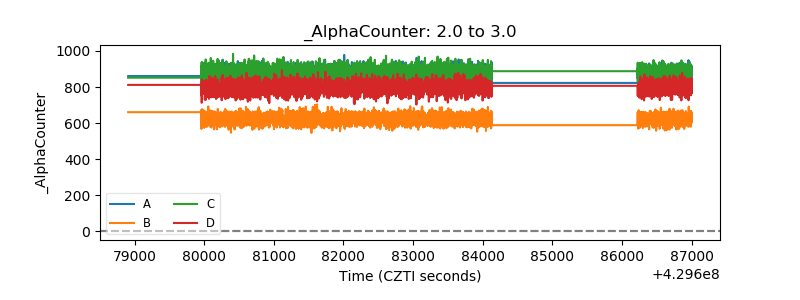 |
| _CPM_Rate | 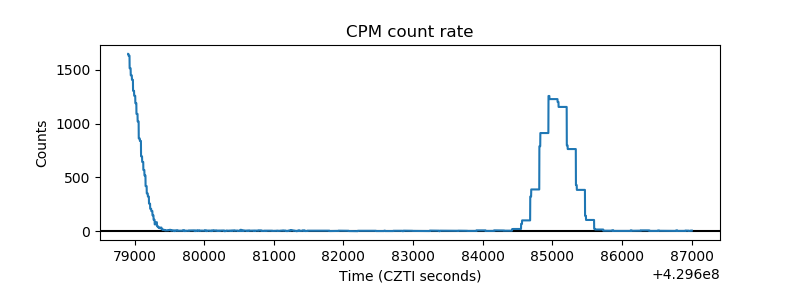 |
| CZT Counter | 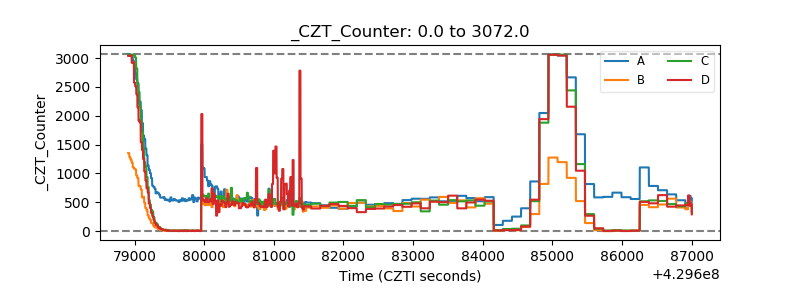 |
| +2.5 Volts monitor | 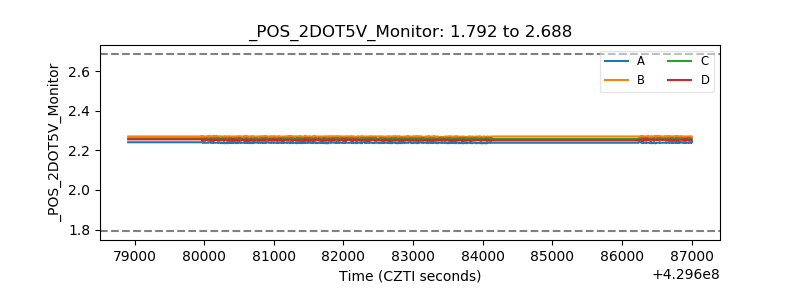 |
| +5 Volts monitor | 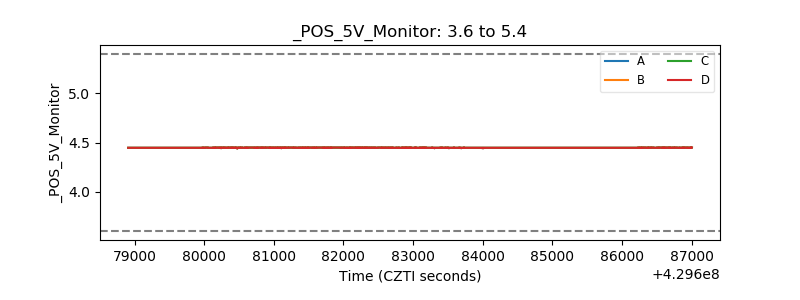 |
| _ROLL_ROT | 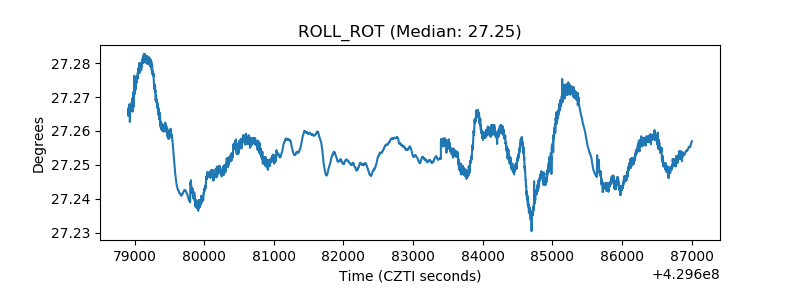 |
| _Roll_DEC | 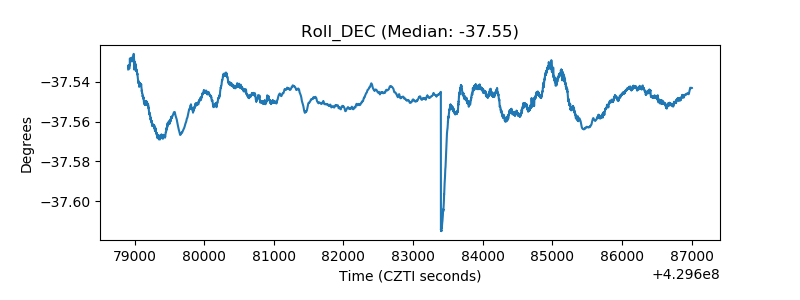 |
| _Roll_RA | 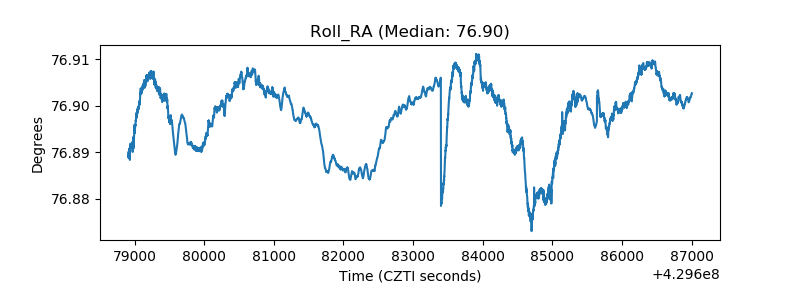 |
| Veto Counter | 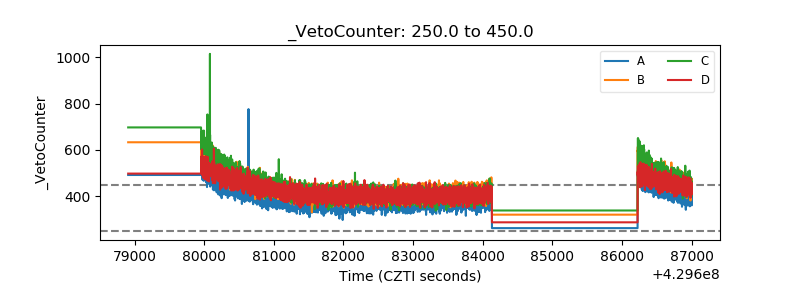 |