| Param | Original file | Final file |
|---|---|---|
| Filename | modeM0/AS1A12_061T07_9000005818_42591cztM0_level2.fits | modeM0/AS1A12_061T07_9000005818_42591cztM0_level2_quad_clean.evt |
| Size (bytes) | 947,514,240 | 284,207,040 |
| Size | 903.6 MB | 271.0 MB |
| Events in quadrant A | 8,849,750 | 1,907,055 |
| Events in quadrant B | 7,578,471 | 1,958,059 |
| Events in quadrant C | 8,091,836 | 1,880,989 |
| Events in quadrant D | 9,243,119 | 1,693,756 |
| Mode M0 | |||
|---|---|---|---|
| Quadrant | BADHDUFLAG | Total packets | Discarded packets |
| A | 0 | 36535 | 4 |
| B | 0 | 34495 | 4 |
| C | 0 | 34515 | 4 |
| D | 0 | 39528 | 4 |
| Mode SS | |||
|---|---|---|---|
| Quadrant | BADHDUFLAG | Total packets | Discarded packets |
| A | 0 | 344 | 0 |
| B | 0 | 344 | 0 |
| C | 0 | 344 | 0 |
| D | 0 | 344 | 0 |
| Mode M9 | |||
|---|---|---|---|
| Quadrant | BADHDUFLAG | Total packets | Discarded packets |
| A | 0 | 62 | 0 |
| B | 0 | 62 | 0 |
| C | 0 | 63 | 0 |
| D | 0 | 63 | 0 |
| Quadrant | Total seconds | Saturated seconds | Saturation percentage |
|---|---|---|---|
| A | 16907 | 27 | 0.159697% |
| B | 16907 | 40 | 0.236588% |
| C | 16908 | 17 | 0.100544% |
| D | 16908 | 364 | 2.152827% |
Noise dominated data is calculated using 1-second bins in cleaned event files. If a bin has >2000 counts, and if more than 50% of those come from <1% of pixels, then it is considered to be noise-dominated and hence unusable.
| Quadrant | # 1 sec bins | Bins with >0 counts | Bins with >2000 counts | High rate bins dominated by noise | Noise dominated (total time) | Noise dominated (detector-on time) | Marked lightcurve |
|---|---|---|---|---|---|---|---|
| A | 38331 | 16911 | 13 | 13 | 0.03% | 0.08% | 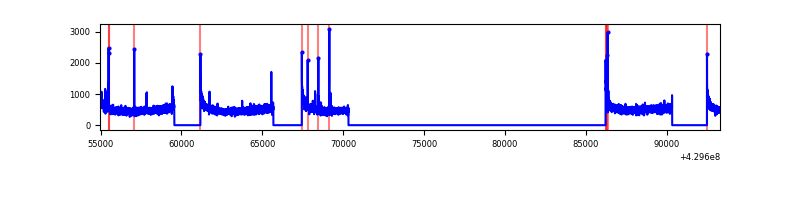 |
| B | 38331 | 16911 | 22 | 22 | 0.06% | 0.13% | 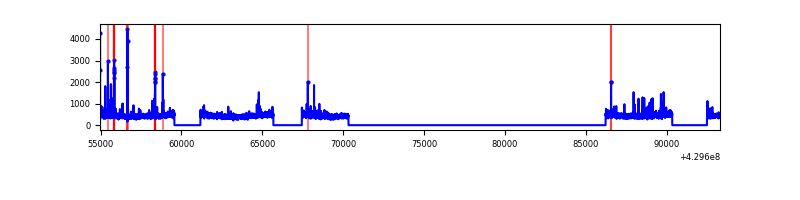 |
| C | 38332 | 16912 | 9 | 9 | 0.02% | 0.05% | 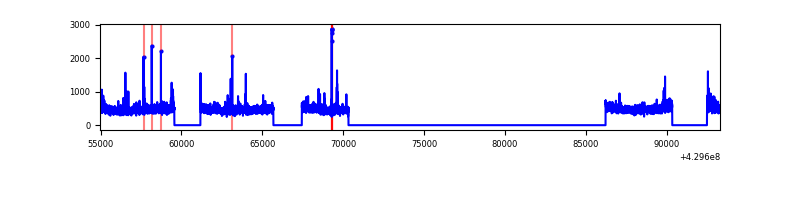 |
| D | 38332 | 16912 | 315 | 315 | 0.82% | 1.86% | 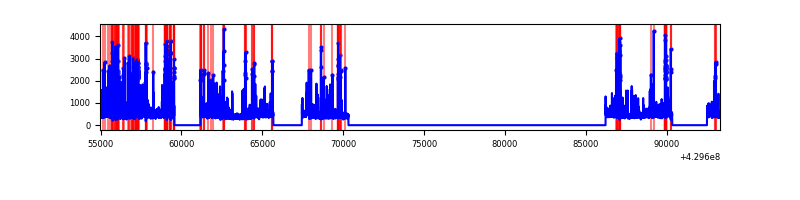 |
Top three noisy pixels from each quadrant. If the there are fewer than three noisy pixels in the level2.evt file, extra rows are filled as -1
| Pixel properties | Quadrant properties | ||||||
|---|---|---|---|---|---|---|---|
| Quadrant | DetID | PixID | Counts | Sigma | Mean | Median | Sigma |
| A | 10 | 83 | 1556047 | 4116.45 | 1862 | 1824 | 377.6 |
| A | 13 | 248 | 32959 | 82.46 | 1862 | 1824 | 377.6 |
| A | 7 | 3 | 29455 | 73.18 | 1862 | 1824 | 377.6 |
| B | 0 | 245 | 110214 | 308.5 | 1850 | 1801 | 351.4 |
| B | 5 | 255 | 79086 | 219.92 | 1850 | 1801 | 351.4 |
| B | 12 | 111 | 44444 | 121.35 | 1850 | 1801 | 351.4 |
| C | 15 | 214 | 699461 | 1642.26 | 1843 | 1854 | 424.8 |
| C | 14 | 254 | 73222 | 168.01 | 1843 | 1854 | 424.8 |
| C | 0 | 207 | 59696 | 136.17 | 1843 | 1854 | 424.8 |
| D | 12 | 6 | 725767 | 1645.54 | 1821 | 1774 | 440.0 |
| D | 1 | 52 | 695847 | 1577.54 | 1821 | 1774 | 440.0 |
| D | 12 | 233 | 210096 | 473.49 | 1821 | 1774 | 440.0 |
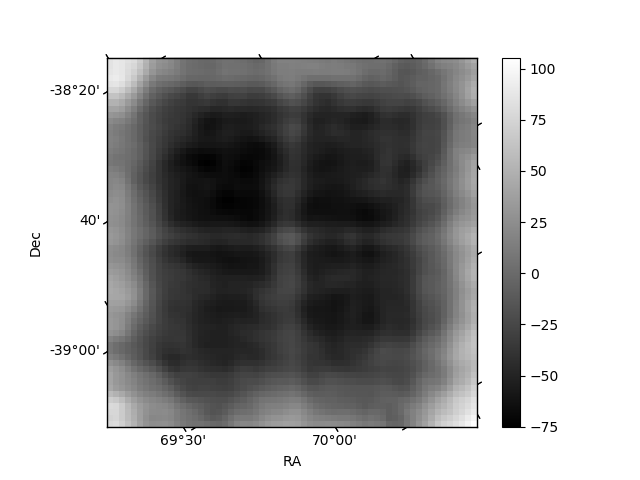
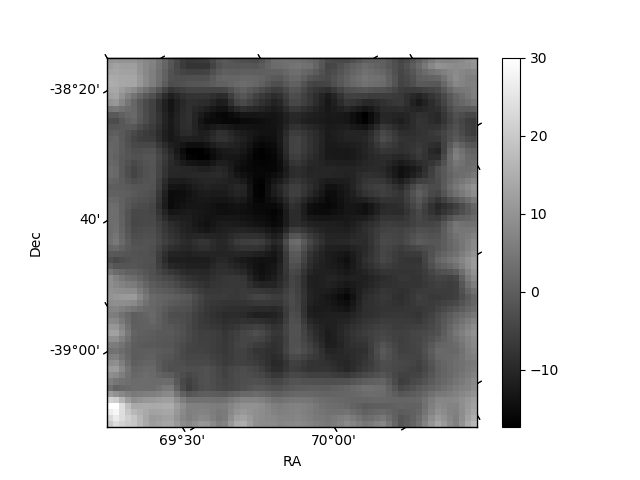
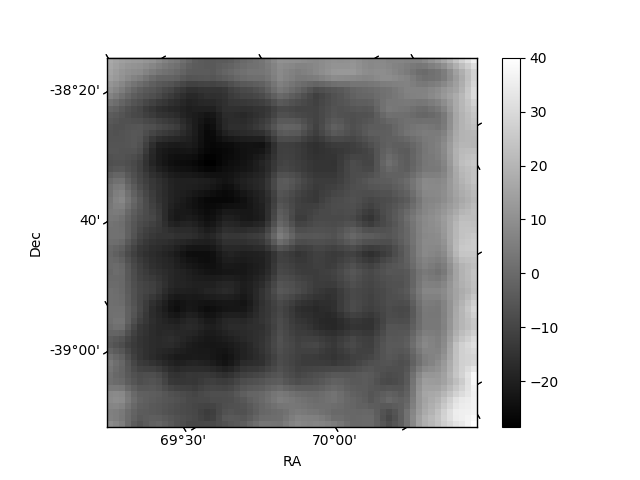
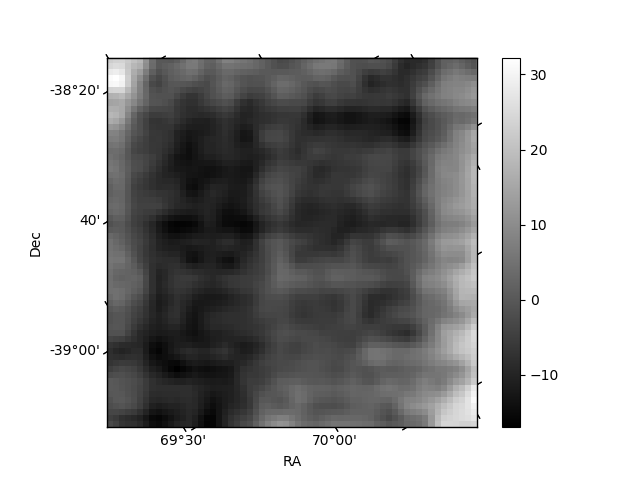
Histogram calculated using DETX and DETY for each event in the final _common_clean file
| Quadrant A | 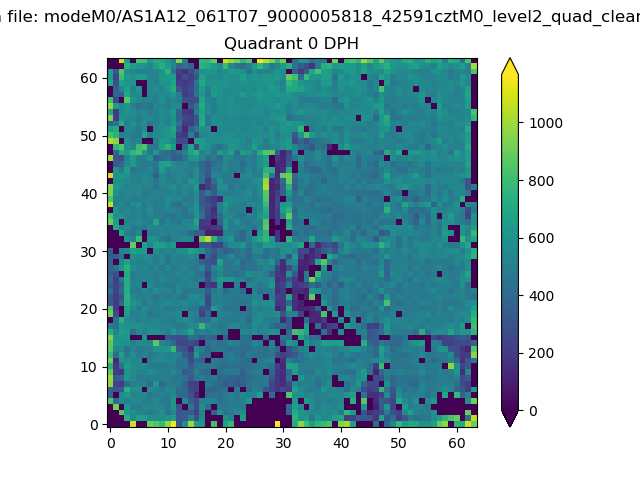 |
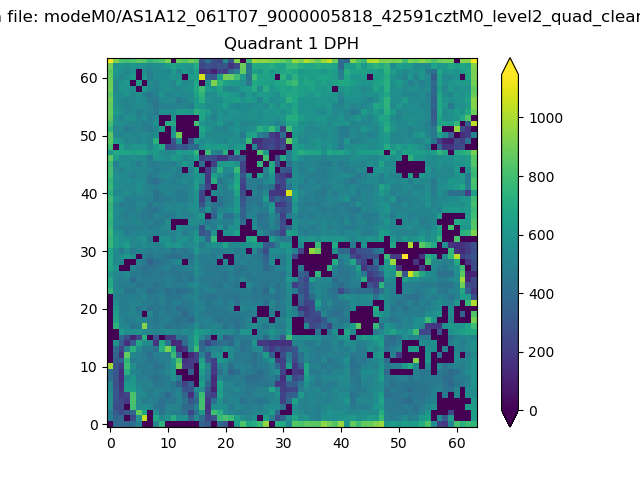 |
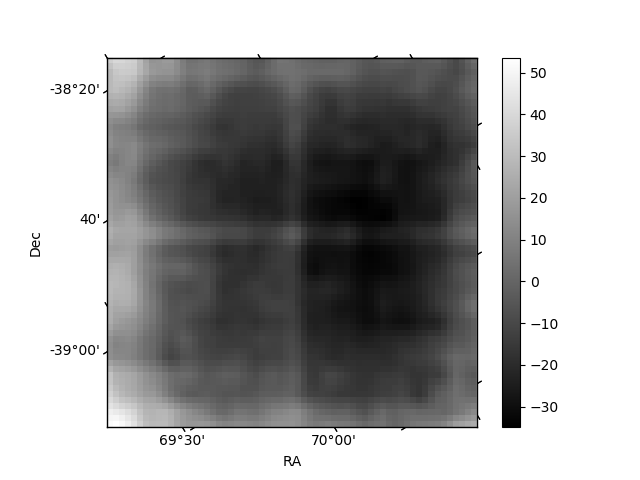
Quadrant B |
|---|---|---|---|
| Quadrant D | 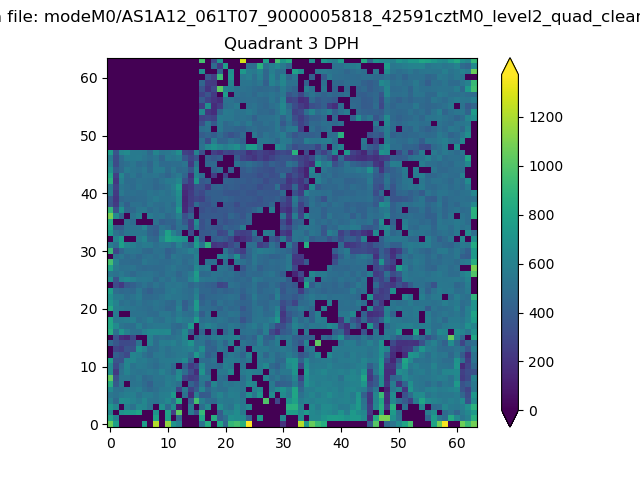 |
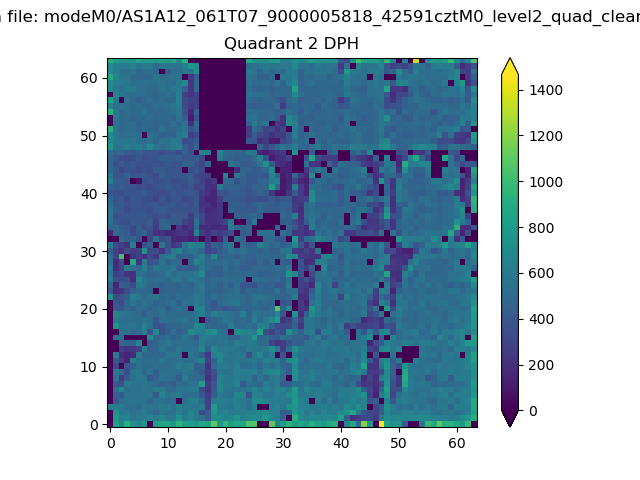 |
Quadrant C |
| Plot type | Count rate plots | Images |
|---|---|---|
| Comparison with Poisson distribution Blue bars denote a histogram of data divided into 1 sec bins. Red curve is a Poisson curve with rate = median count rate of data. |
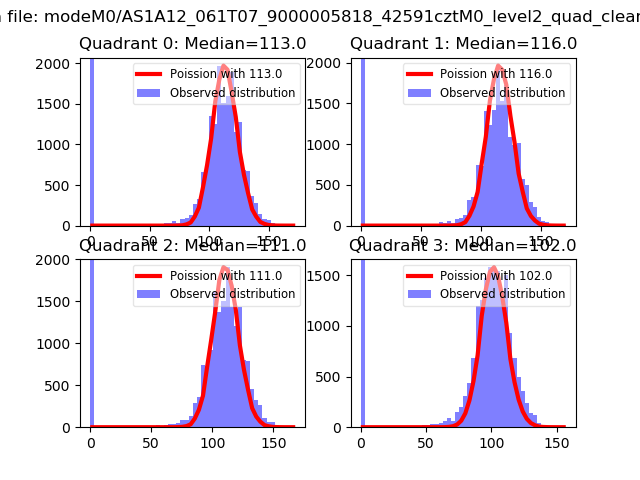 |
 |
| Quadrant-wise count rates Data is divided into 100 sec bins |
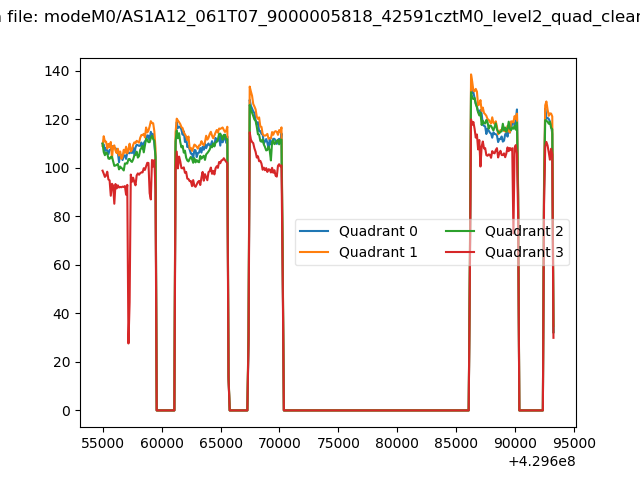 |
|
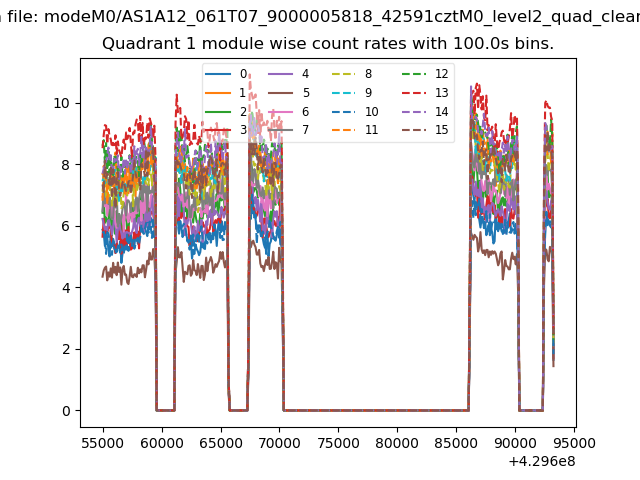
| Module-wise count rates for Quadrant A Data is divided into 100 sec bins |
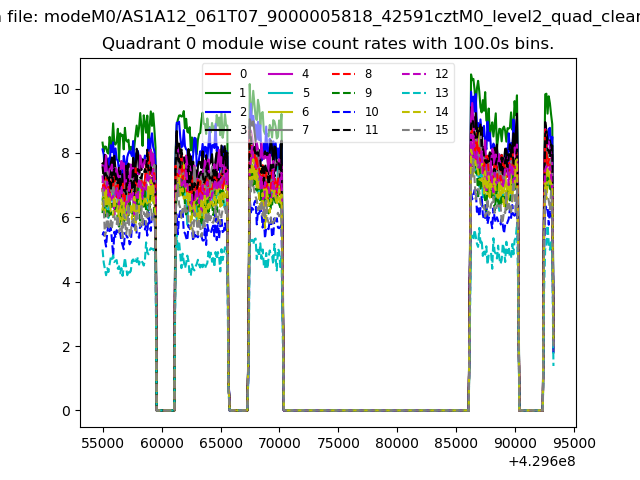 |
 |
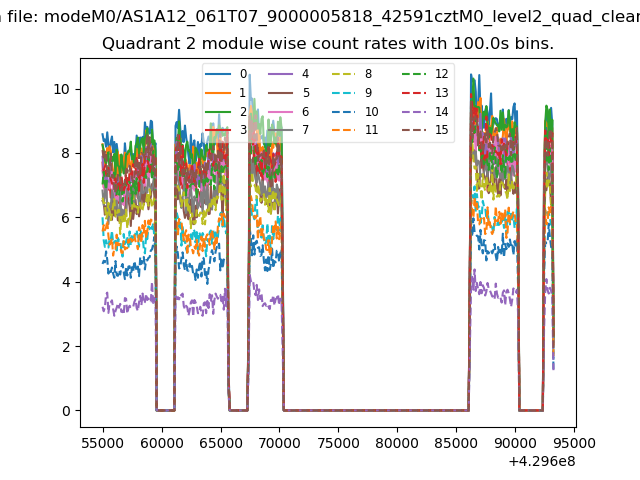
| Module-wise count rates for Quadrant B Data is divided into 100 sec bins |
 |
 |
| Module-wise count rates for Quadrant C Data is divided into 100 sec bins |
 |
 |
| Module-wise count rates for Quadrant D Data is divided into 100 sec bins |
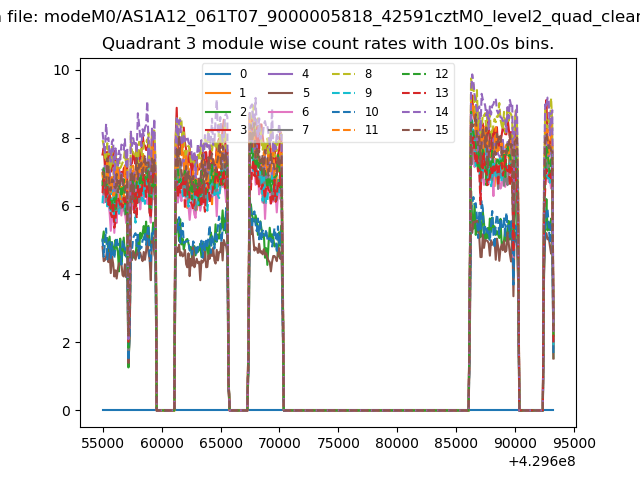 |
 |
| Parameter | Plot |
|---|---|
| CZT HV Monitor | 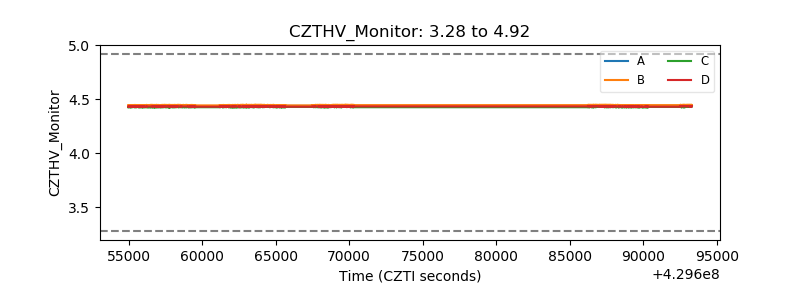 |
| D_VDD | 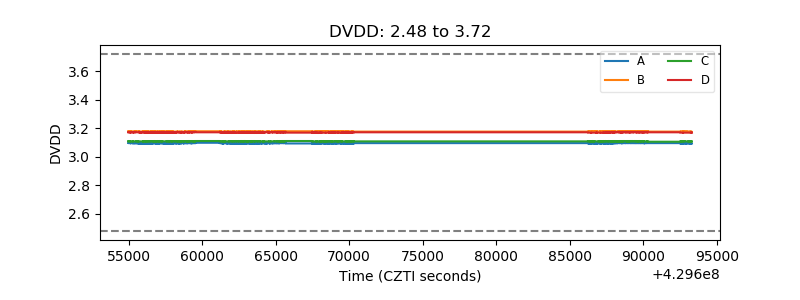 |
| Temperature 1 | 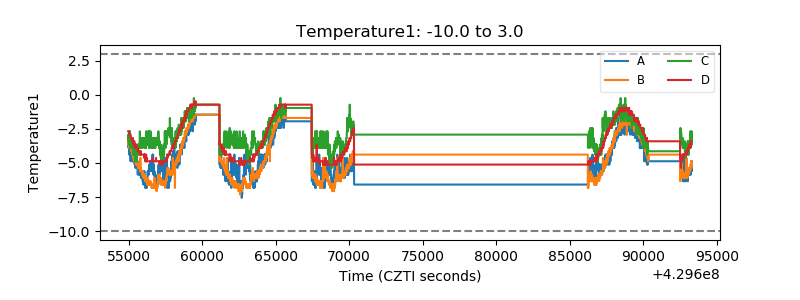 |
| Veto HV Monitor | 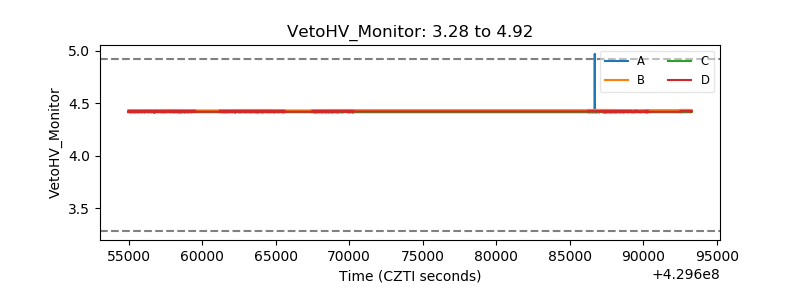 |
| Veto LLD | 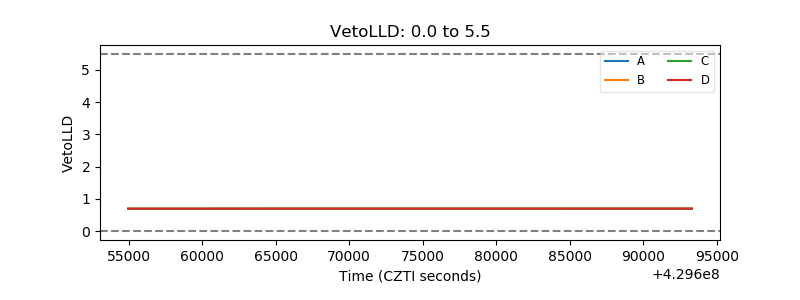 |
| Alpha Counter |  |
| _CPM_Rate | 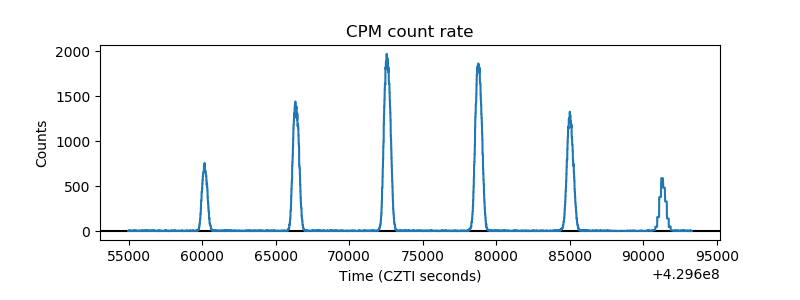 |
| CZT Counter | 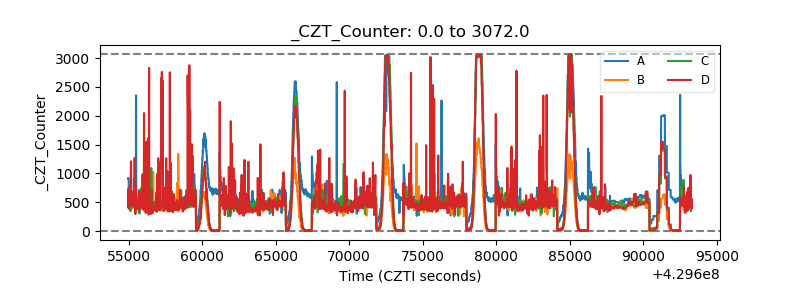 |
| +2.5 Volts monitor | 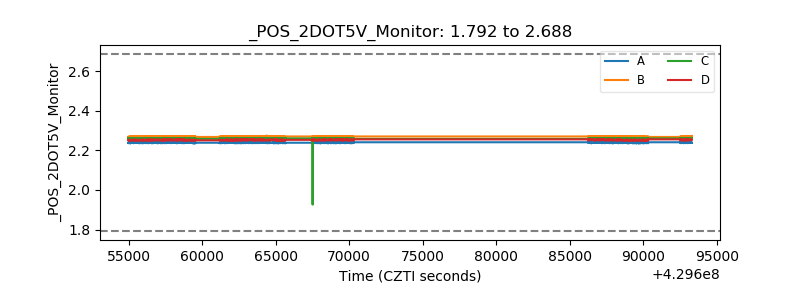 |
| +5 Volts monitor | 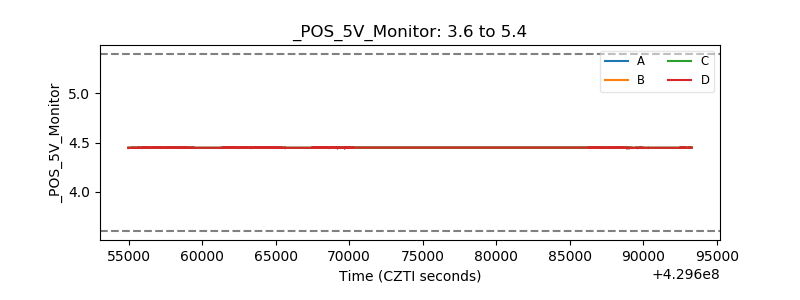 |
| _ROLL_ROT | 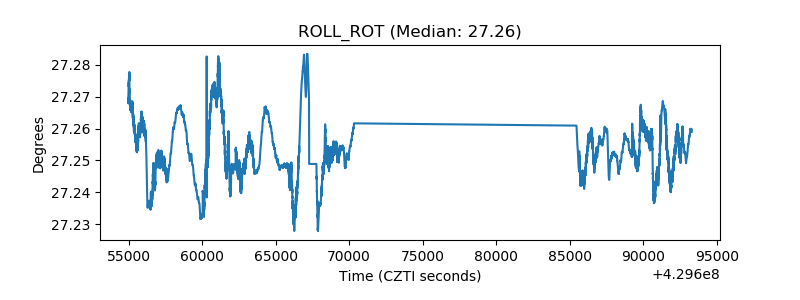 |
| _Roll_DEC | 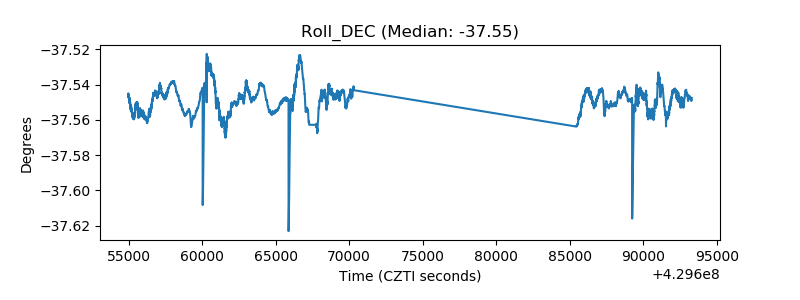 |
| _Roll_RA | 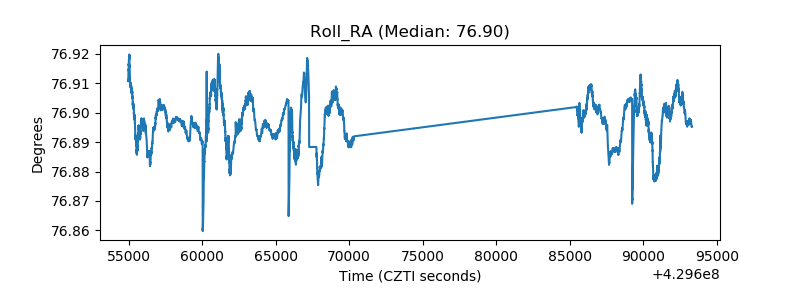 |
| Veto Counter | 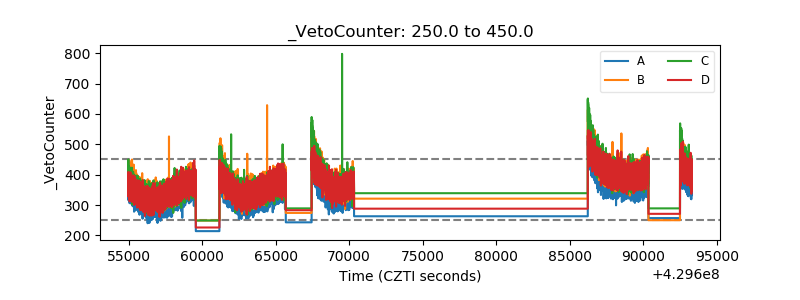 |