| Param | Original file | Final file |
|---|---|---|
| Filename | modeM0/AS1A12_061T07_9000005818_42592cztM0_level2.fits | modeM0/AS1A12_061T07_9000005818_42592cztM0_level2_quad_clean.evt |
| Size (bytes) | 304,176,960 | 90,357,120 |
| Size | 290.1 MB | 86.2 MB |
| Events in quadrant A | 2,837,224 | 600,993 |
| Events in quadrant B | 2,396,333 | 617,454 |
| Events in quadrant C | 2,616,521 | 598,524 |
| Events in quadrant D | 2,996,033 | 547,026 |
| Mode M0 | |||
|---|---|---|---|
| Quadrant | BADHDUFLAG | Total packets | Discarded packets |
| A | 0 | 11486 | 2 |
| B | 0 | 10866 | 2 |
| C | 0 | 11068 | 2 |
| D | 0 | 12583 | 2 |
| Mode SS | |||
|---|---|---|---|
| Quadrant | BADHDUFLAG | Total packets | Discarded packets |
| A | 0 | 110 | 0 |
| B | 0 | 110 | 0 |
| C | 0 | 110 | 0 |
| D | 0 | 110 | 0 |
| Mode M9 | |||
|---|---|---|---|
| Quadrant | BADHDUFLAG | Total packets | Discarded packets |
| A | 0 | 23 | 0 |
| B | 0 | 24 | 0 |
| C | 0 | 24 | 0 |
| D | 0 | 24 | 0 |
| Quadrant | Total seconds | Saturated seconds | Saturation percentage |
|---|---|---|---|
| A | 5306 | 9 | 0.169619% |
| B | 5306 | 9 | 0.169619% |
| C | 5306 | 18 | 0.339239% |
| D | 5306 | 49 | 0.923483% |
Noise dominated data is calculated using 1-second bins in cleaned event files. If a bin has >2000 counts, and if more than 50% of those come from <1% of pixels, then it is considered to be noise-dominated and hence unusable.
| Quadrant | # 1 sec bins | Bins with >0 counts | Bins with >2000 counts | High rate bins dominated by noise | Noise dominated (total time) | Noise dominated (detector-on time) | Marked lightcurve |
|---|---|---|---|---|---|---|---|
| A | 7429 | 5307 | 2 | 2 | 0.03% | 0.04% | 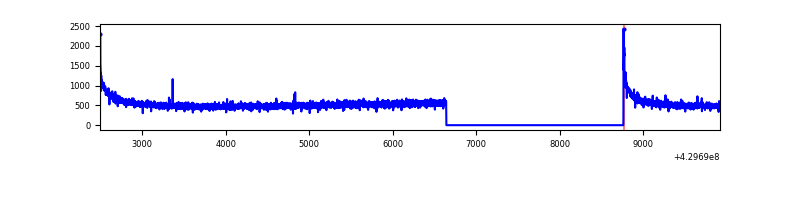 |
| B | 7429 | 5307 | 3 | 3 | 0.04% | 0.06% | 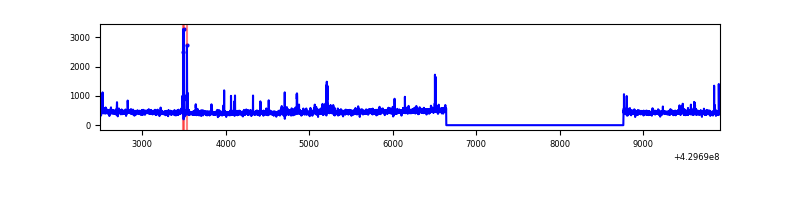 |
| C | 7429 | 5307 | 16 | 16 | 0.22% | 0.30% | 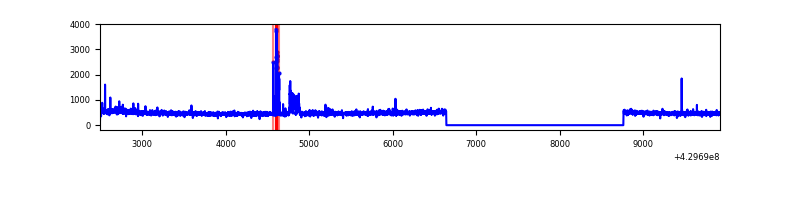 |
| D | 7429 | 5307 | 48 | 48 | 0.65% | 0.90% | 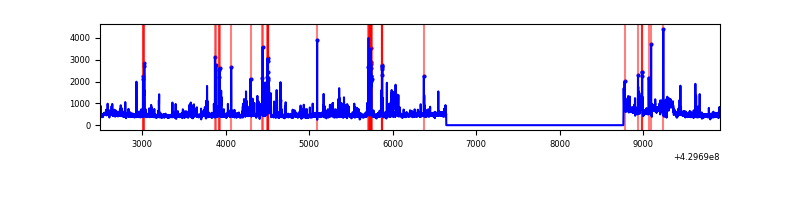 |
Top three noisy pixels from each quadrant. If the there are fewer than three noisy pixels in the level2.evt file, extra rows are filled as -1
| Pixel properties | Quadrant properties | ||||||
|---|---|---|---|---|---|---|---|
| Quadrant | DetID | PixID | Counts | Sigma | Mean | Median | Sigma |
| A | 10 | 83 | 546259 | 4559.2 | 589 | 577 | 119.7 |
| A | 3 | 137 | 6462 | 49.17 | 589 | 577 | 119.7 |
| A | 13 | 6 | 6358 | 48.3 | 589 | 577 | 119.7 |
| B | 0 | 245 | 32064 | 284.18 | 581 | 566 | 110.8 |
| B | 5 | 255 | 30293 | 268.21 | 581 | 566 | 110.8 |
| B | 15 | 85 | 22905 | 201.55 | 581 | 566 | 110.8 |
| C | 15 | 214 | 222418 | 1652.81 | 578 | 582 | 134.2 |
| C | 0 | 207 | 132346 | 981.72 | 578 | 582 | 134.2 |
| C | 12 | 249 | 4122 | 26.38 | 578 | 582 | 134.2 |
| D | 1 | 52 | 247409 | 1762.1 | 581 | 566 | 140.1 |
| D | 2 | 16 | 178721 | 1271.77 | 581 | 566 | 140.1 |
| D | 12 | 233 | 83908 | 594.94 | 581 | 566 | 140.1 |
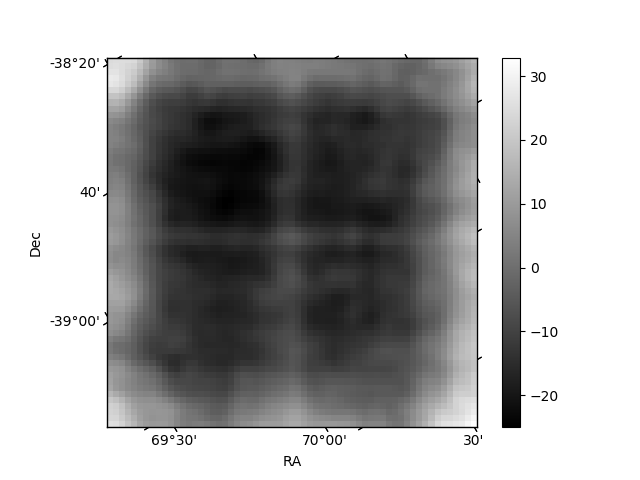
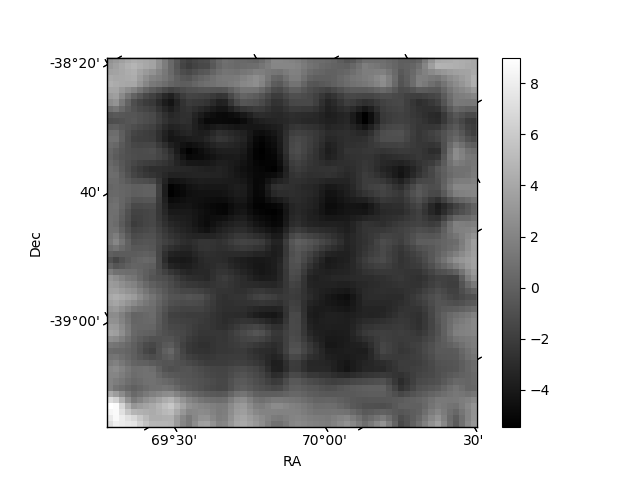
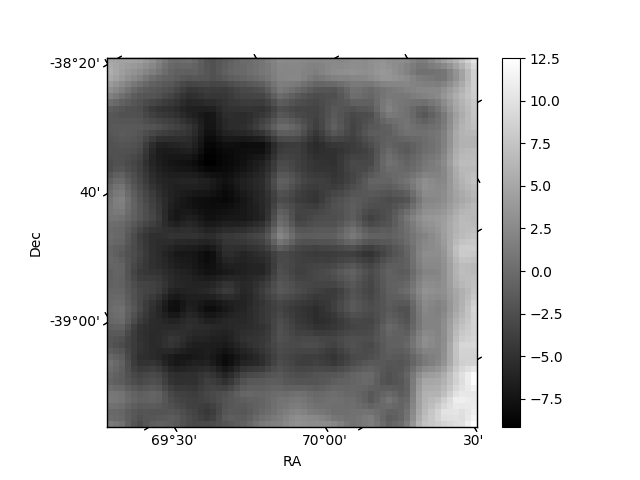
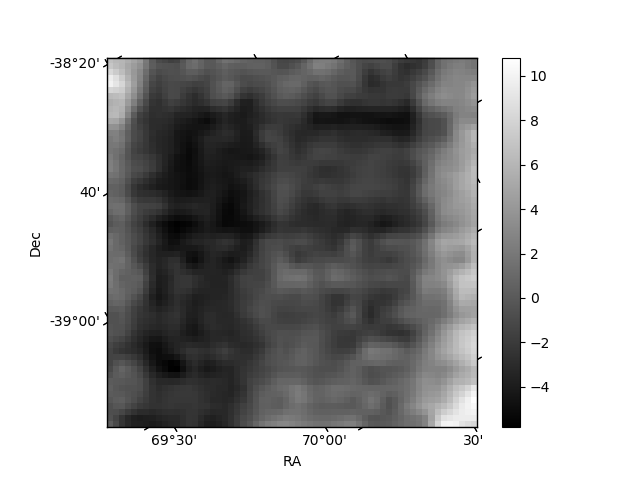
Histogram calculated using DETX and DETY for each event in the final _common_clean file
| Quadrant A | 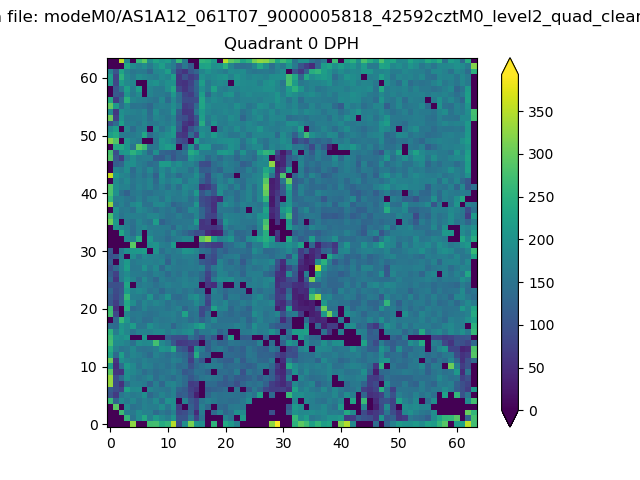 |
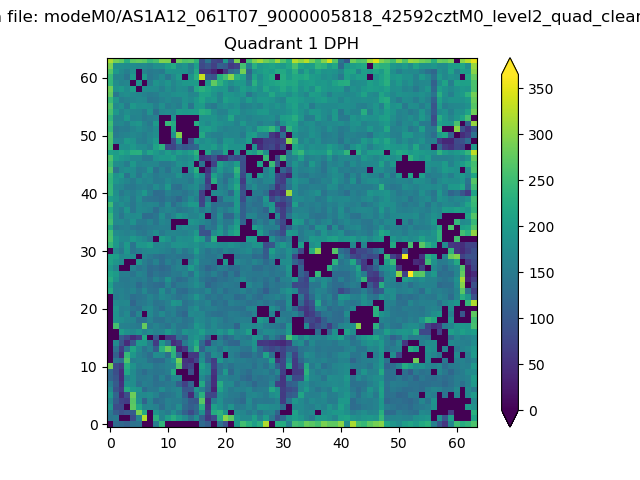 |
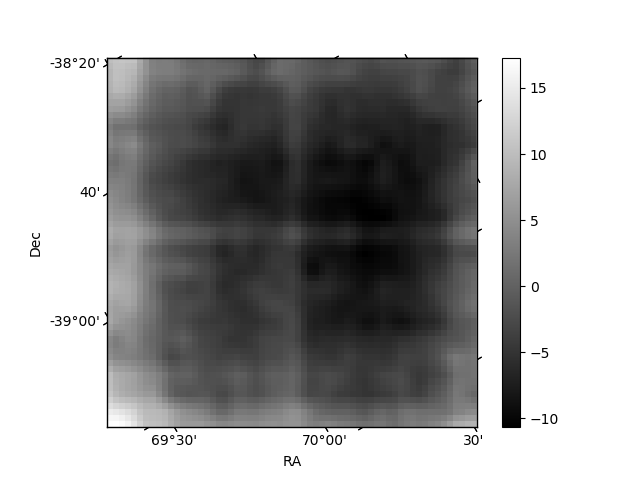
Quadrant B |
|---|---|---|---|
| Quadrant D | 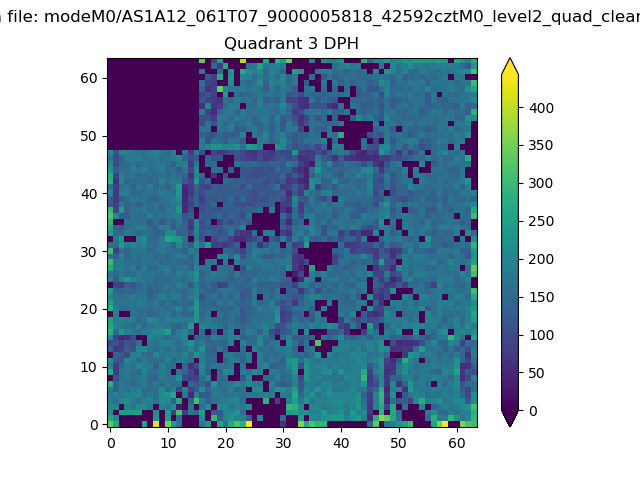 |
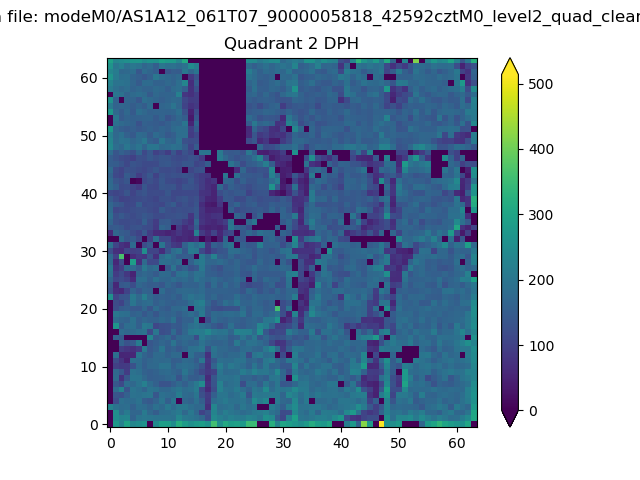 |
Quadrant C |
| Plot type | Count rate plots | Images |
|---|---|---|
| Comparison with Poisson distribution Blue bars denote a histogram of data divided into 1 sec bins. Red curve is a Poisson curve with rate = median count rate of data. |
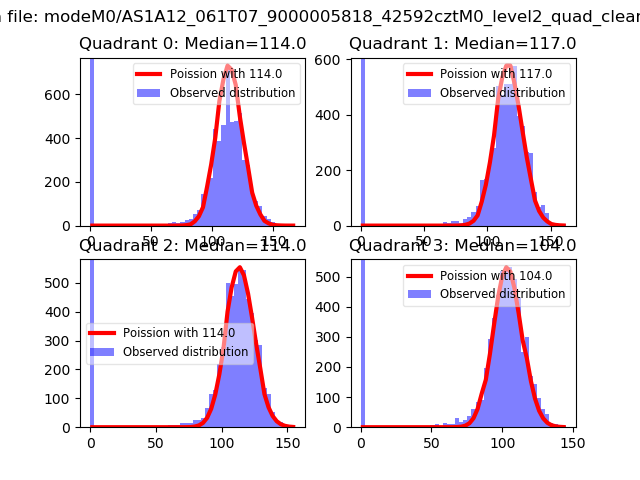 |
 |
| Quadrant-wise count rates Data is divided into 100 sec bins |
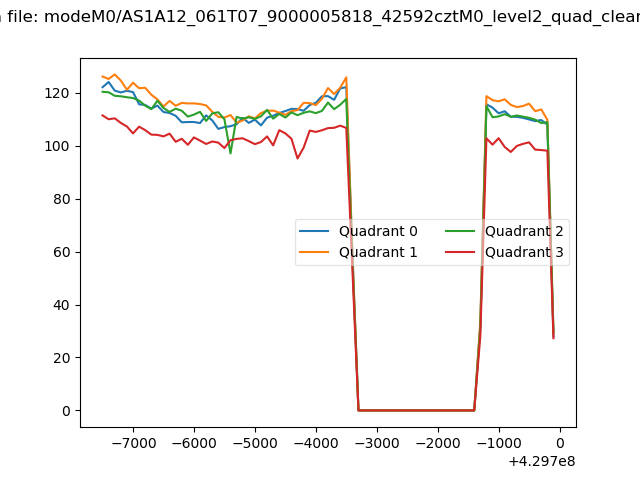 |
|
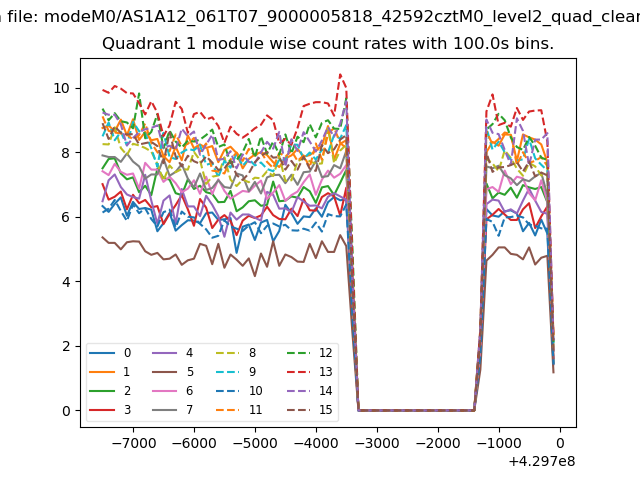
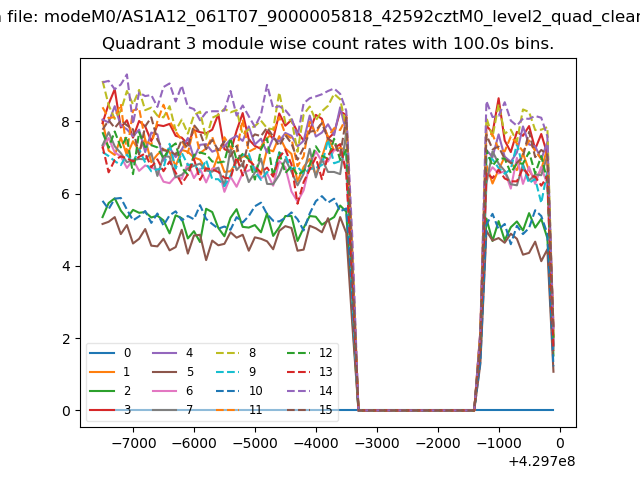
| Module-wise count rates for Quadrant A Data is divided into 100 sec bins |
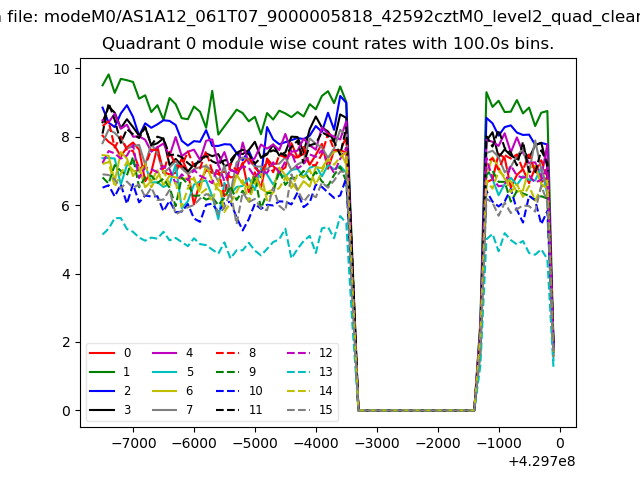 |
 |
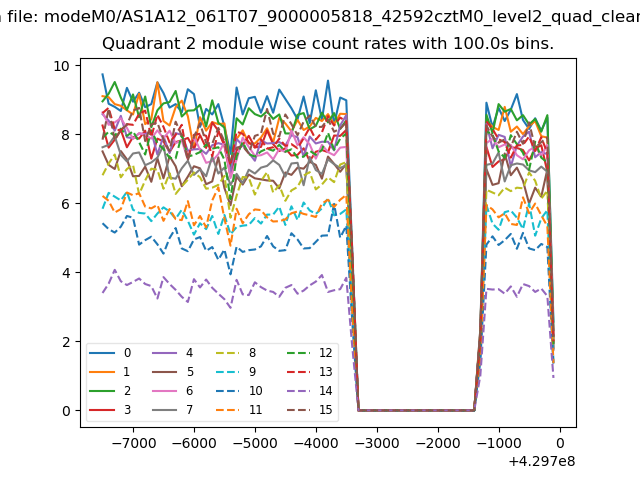
| Module-wise count rates for Quadrant B Data is divided into 100 sec bins |
 |
 |
| Module-wise count rates for Quadrant C Data is divided into 100 sec bins |
 |
 |
| Module-wise count rates for Quadrant D Data is divided into 100 sec bins |
 |
 |
| Parameter | Plot |
|---|---|
| CZT HV Monitor | 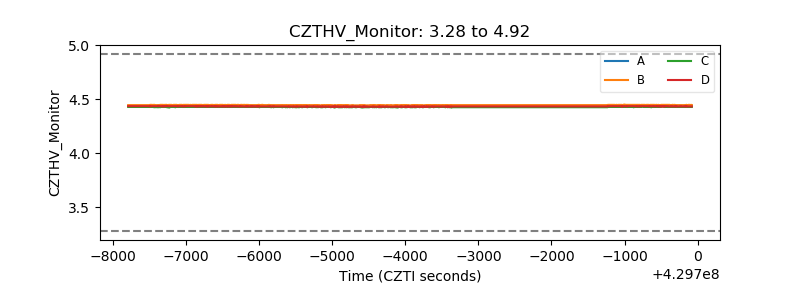 |
| D_VDD | 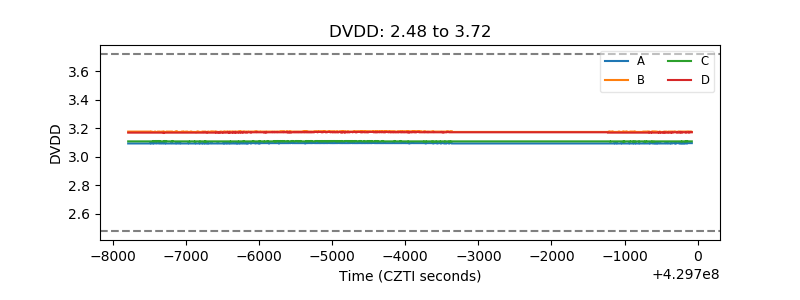 |
| Temperature 1 | 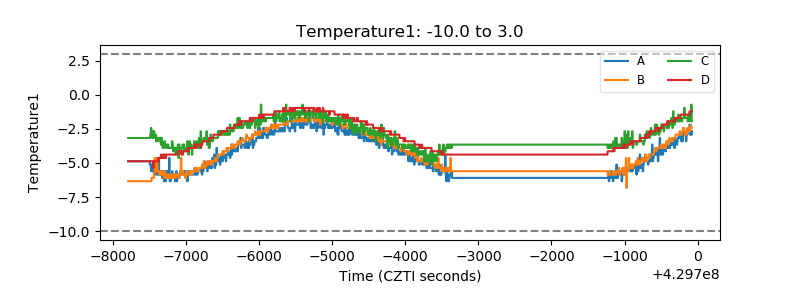 |
| Veto HV Monitor | 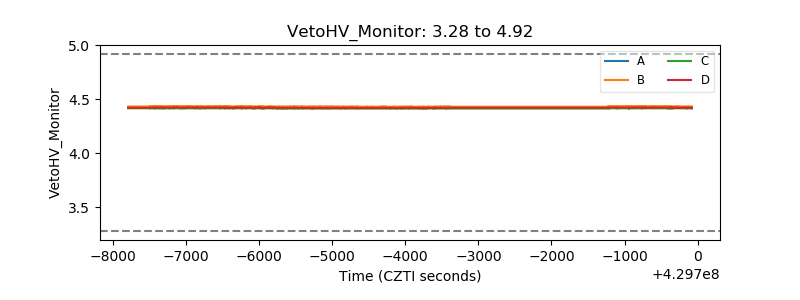 |
| Veto LLD | 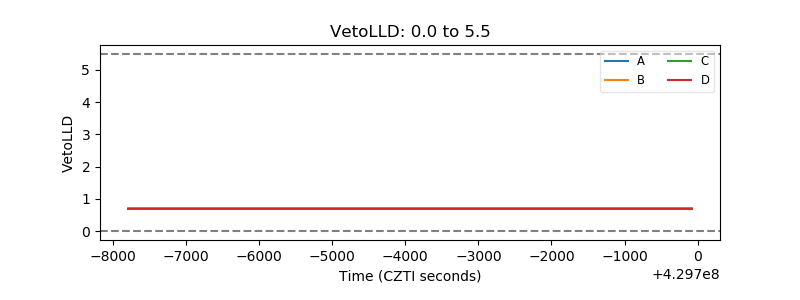 |
| Alpha Counter | 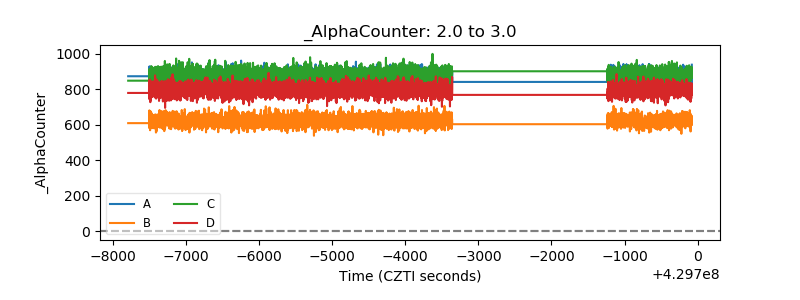 |
| _CPM_Rate | 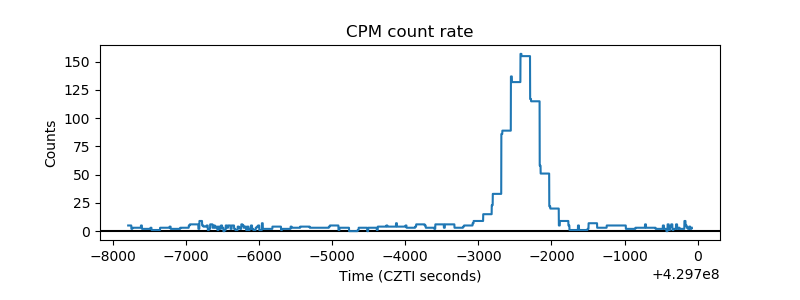 |
| CZT Counter | 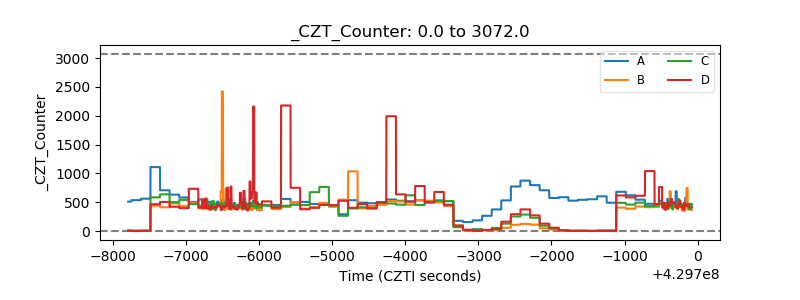 |
| +2.5 Volts monitor | 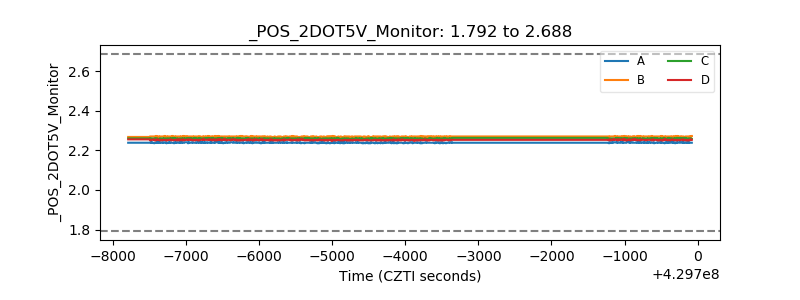 |
| +5 Volts monitor | 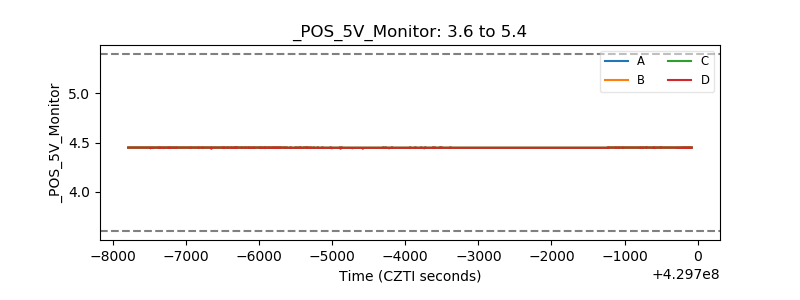 |
| _ROLL_ROT | 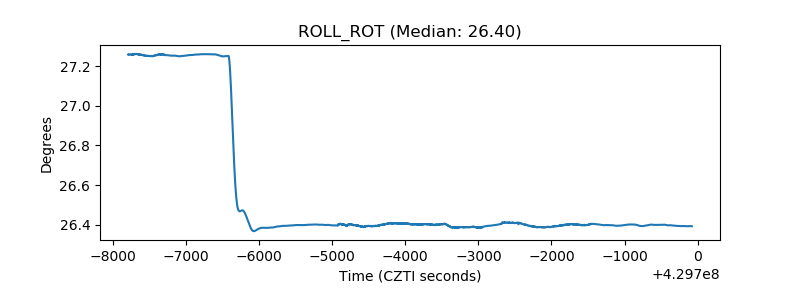 |
| _Roll_DEC | 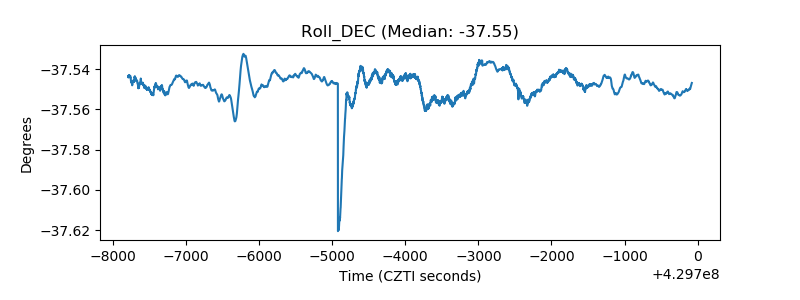 |
| _Roll_RA | 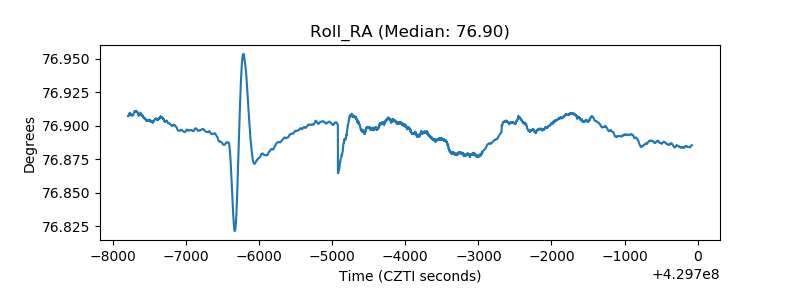 |
| Veto Counter | 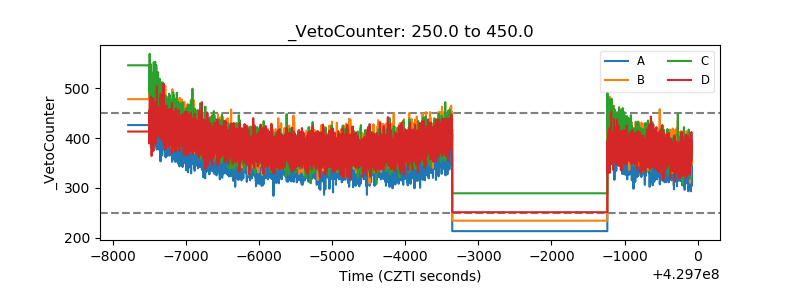 |