| Param | Original file | Final file |
|---|---|---|
| Filename | modeM0/AS1A12_061T07_9000005818_42593cztM0_level2.fits | modeM0/AS1A12_061T07_9000005818_42593cztM0_level2_quad_clean.evt |
| Size (bytes) | 300,746,880 | 88,176,960 |
| Size | 286.8 MB | 84.1 MB |
| Events in quadrant A | 2,829,076 | 585,407 |
| Events in quadrant B | 2,410,143 | 600,626 |
| Events in quadrant C | 2,456,536 | 582,104 |
| Events in quadrant D | 3,019,914 | 527,302 |
| Mode M0 | |||
|---|---|---|---|
| Quadrant | BADHDUFLAG | Total packets | Discarded packets |
| A | 0 | 11467 | 1 |
| B | 0 | 10992 | 1 |
| C | 0 | 10726 | 1 |
| D | 0 | 12754 | 1 |
| Mode SS | |||
|---|---|---|---|
| Quadrant | BADHDUFLAG | Total packets | Discarded packets |
| A | 0 | 110 | 0 |
| B | 0 | 110 | 0 |
| C | 0 | 110 | 0 |
| D | 0 | 110 | 0 |
| Mode M9 | |||
|---|---|---|---|
| Quadrant | BADHDUFLAG | Total packets | Discarded packets |
| A | 0 | 18 | 0 |
| B | 0 | 18 | 0 |
| C | 0 | 18 | 0 |
| D | 0 | 18 | 0 |
| Quadrant | Total seconds | Saturated seconds | Saturation percentage |
|---|---|---|---|
| A | 5345 | 13 | 0.243218% |
| B | 5346 | 17 | 0.317995% |
| C | 5346 | 1 | 0.018706% |
| D | 5346 | 113 | 2.113730% |
Noise dominated data is calculated using 1-second bins in cleaned event files. If a bin has >2000 counts, and if more than 50% of those come from <1% of pixels, then it is considered to be noise-dominated and hence unusable.
| Quadrant | # 1 sec bins | Bins with >0 counts | Bins with >2000 counts | High rate bins dominated by noise | Noise dominated (total time) | Noise dominated (detector-on time) | Marked lightcurve |
|---|---|---|---|---|---|---|---|
| A | 7227 | 5346 | 4 | 4 | 0.06% | 0.07% | 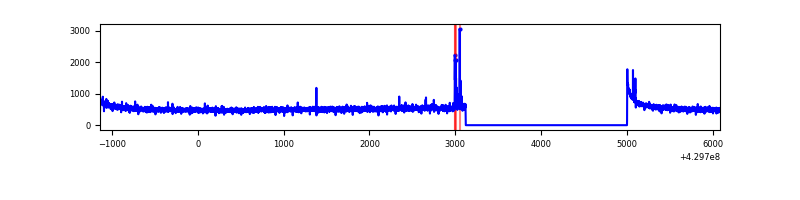 |
| B | 7228 | 5347 | 7 | 7 | 0.10% | 0.13% | 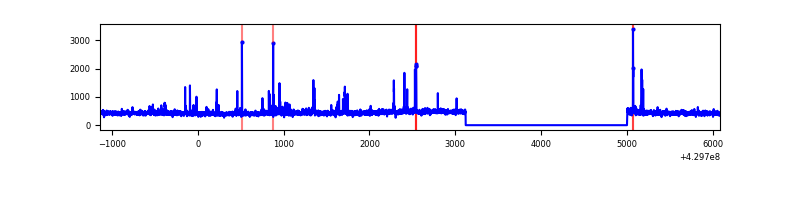 |
| C | 7228 | 5347 | 0 | 0 | 0.00% | 0.00% | 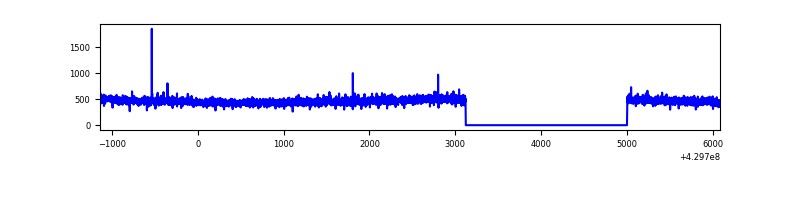 |
| D | 7228 | 5347 | 101 | 101 | 1.40% | 1.89% | 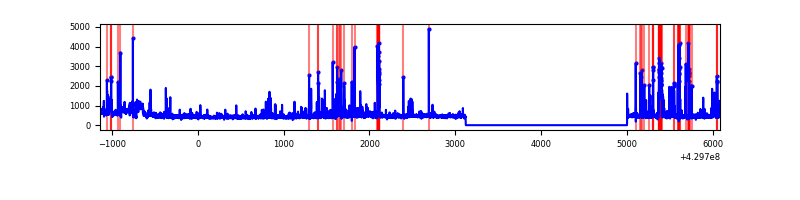 |
Top three noisy pixels from each quadrant. If the there are fewer than three noisy pixels in the level2.evt file, extra rows are filled as -1
| Pixel properties | Quadrant properties | ||||||
|---|---|---|---|---|---|---|---|
| Quadrant | DetID | PixID | Counts | Sigma | Mean | Median | Sigma |
| A | 10 | 83 | 512677 | 4234.5 | 585 | 570 | 120.9 |
| A | 13 | 248 | 48519 | 396.48 | 585 | 570 | 120.9 |
| A | 3 | 137 | 6509 | 49.11 | 585 | 570 | 120.9 |
| B | 5 | 172 | 51441 | 445.84 | 578 | 562 | 114.1 |
| B | 0 | 245 | 37951 | 327.63 | 578 | 562 | 114.1 |
| B | 15 | 32 | 19275 | 163.98 | 578 | 562 | 114.1 |
| C | 15 | 214 | 223370 | 1678.57 | 569 | 572 | 132.7 |
| C | 0 | 207 | 5905 | 40.18 | 569 | 572 | 132.7 |
| C | 13 | 61 | 3682 | 23.43 | 569 | 572 | 132.7 |
| D | 1 | 52 | 393327 | 2811.38 | 572 | 558 | 139.7 |
| D | 2 | 16 | 148006 | 1055.41 | 572 | 558 | 139.7 |
| D | 12 | 233 | 85795 | 610.11 | 572 | 558 | 139.7 |
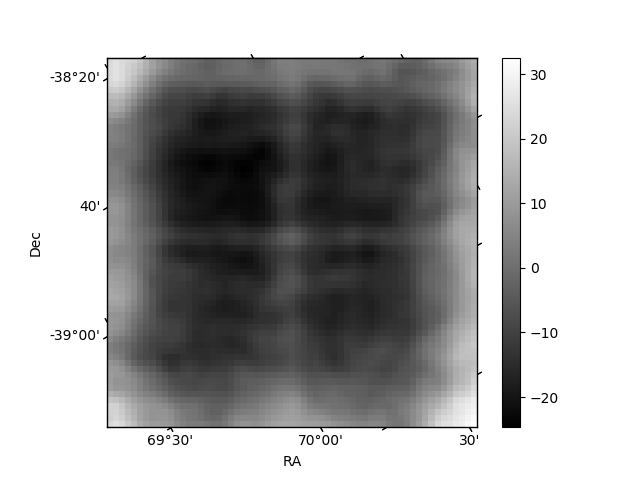
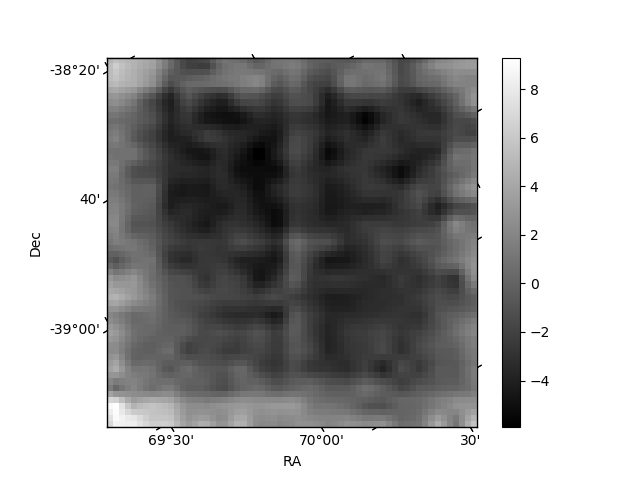
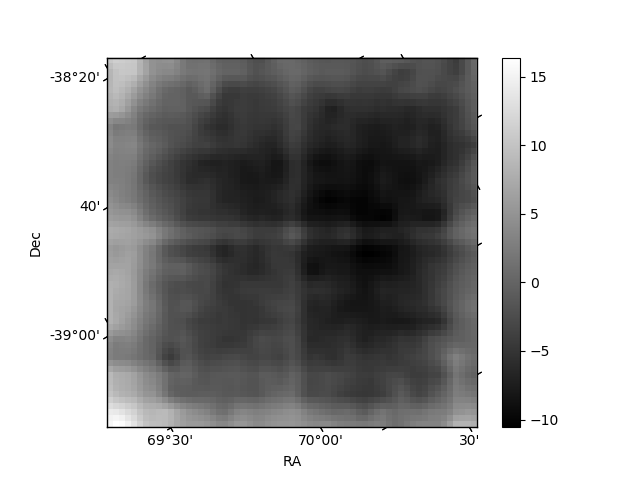
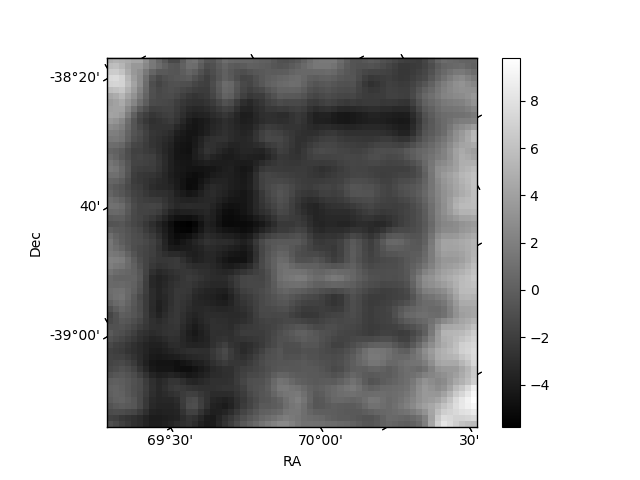
Histogram calculated using DETX and DETY for each event in the final _common_clean file
| Quadrant A | 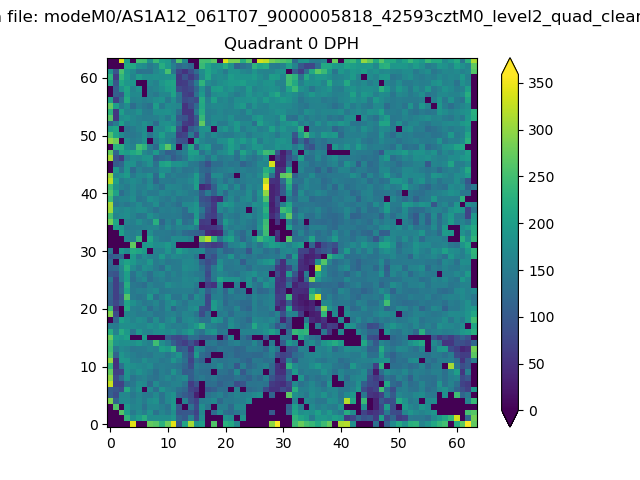 |
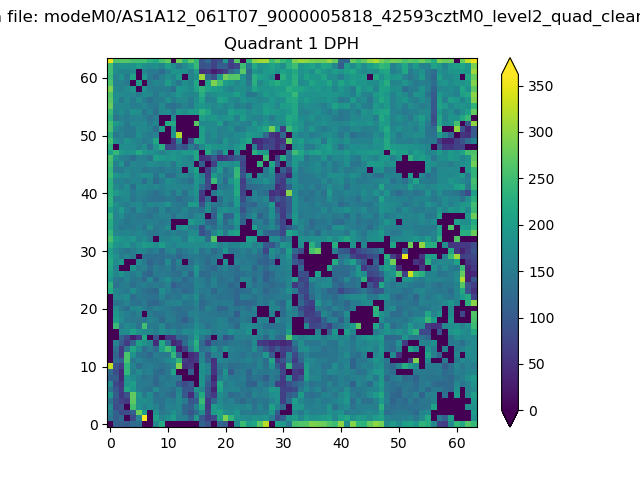 |
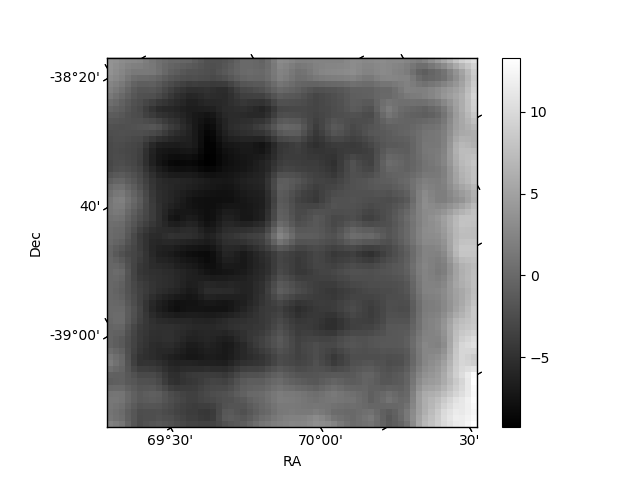
Quadrant B |
|---|---|---|---|
| Quadrant D | 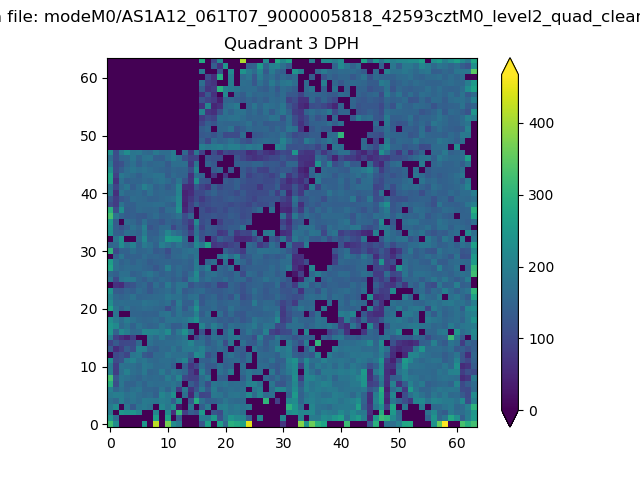 |
 |
Quadrant C |
| Plot type | Count rate plots | Images |
|---|---|---|
| Comparison with Poisson distribution Blue bars denote a histogram of data divided into 1 sec bins. Red curve is a Poisson curve with rate = median count rate of data. |
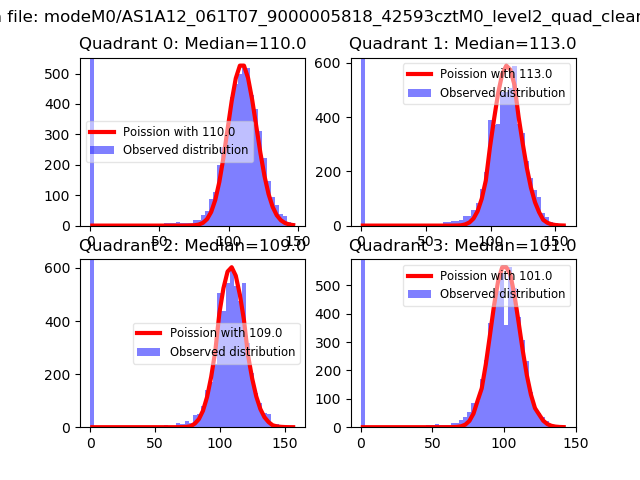 |
 |
| Quadrant-wise count rates Data is divided into 100 sec bins |
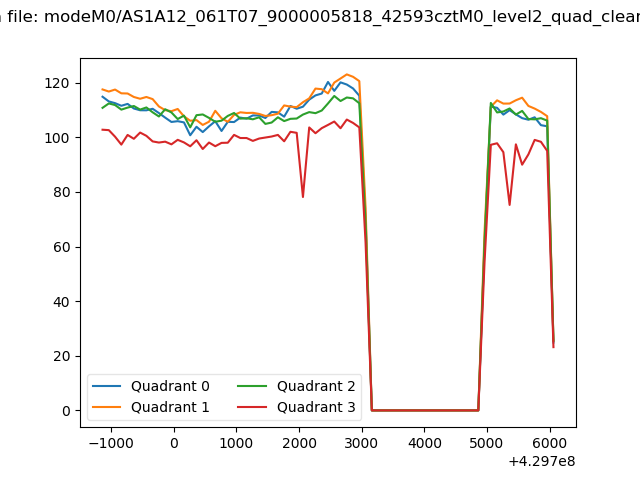 |
|
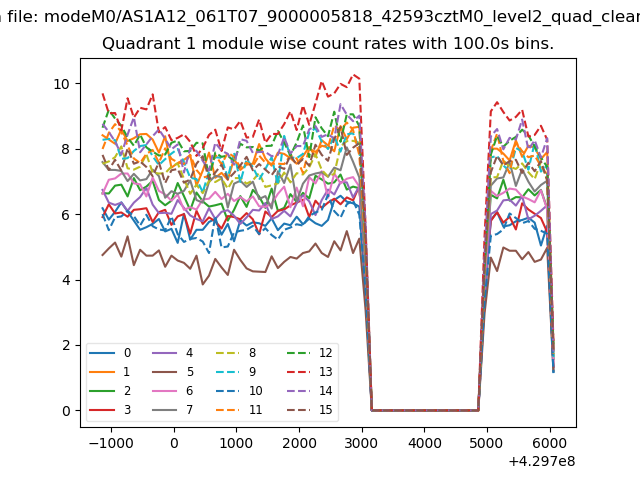
| Module-wise count rates for Quadrant A Data is divided into 100 sec bins |
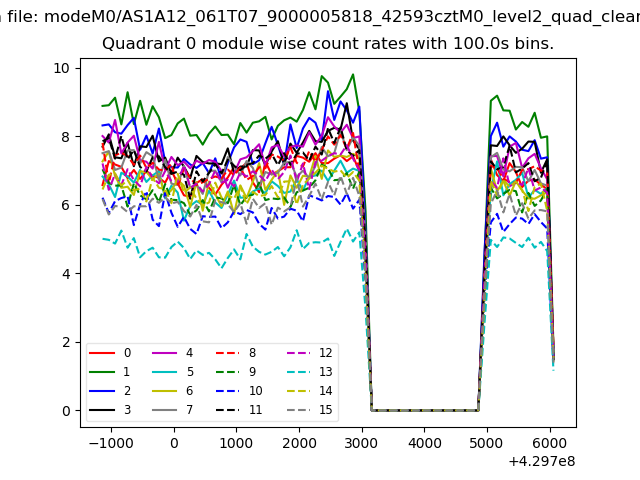 |
 |
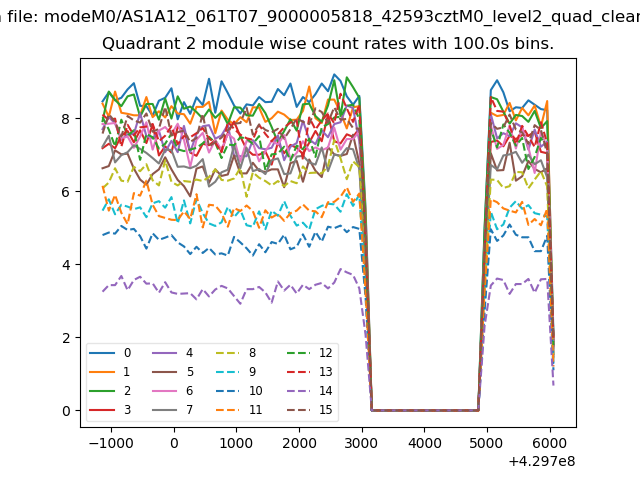
| Module-wise count rates for Quadrant B Data is divided into 100 sec bins |
 |
 |
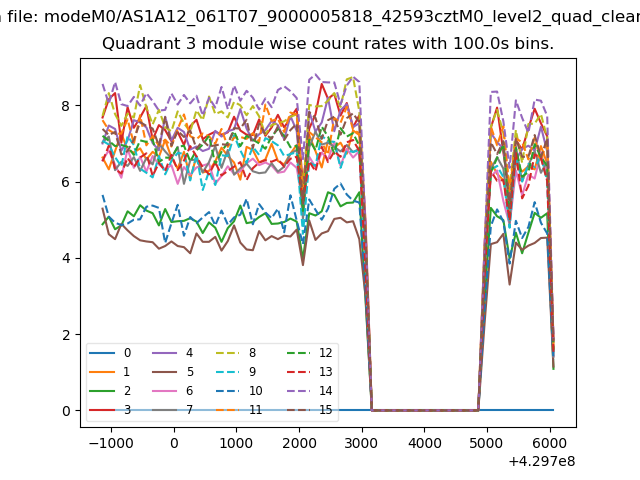
| Module-wise count rates for Quadrant C Data is divided into 100 sec bins |
 |
 |
| Module-wise count rates for Quadrant D Data is divided into 100 sec bins |
 |
 |
| Parameter | Plot |
|---|---|
| CZT HV Monitor | 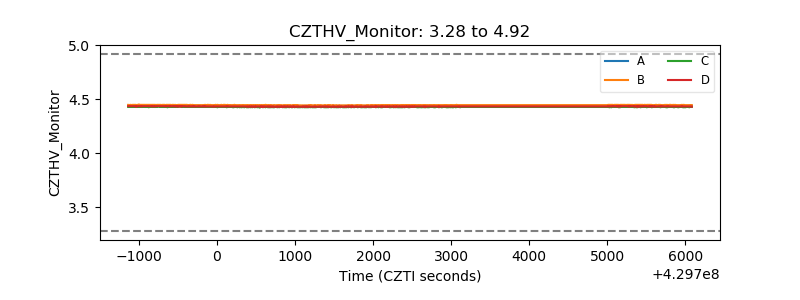 |
| D_VDD | 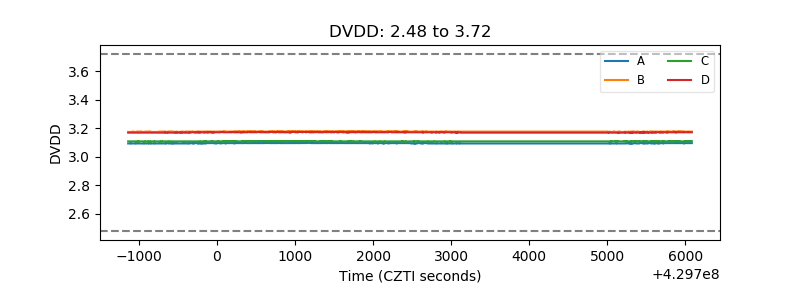 |
| Temperature 1 | 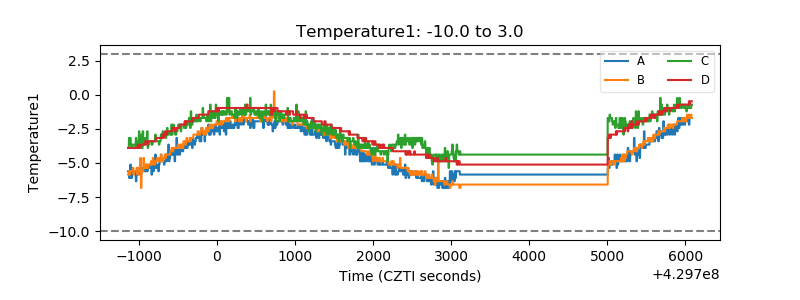 |
| Veto HV Monitor | 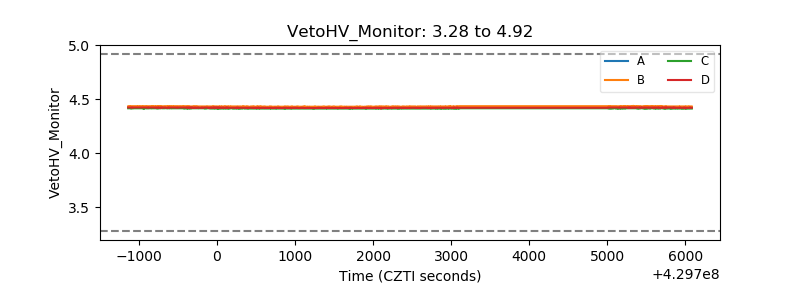 |
| Veto LLD | 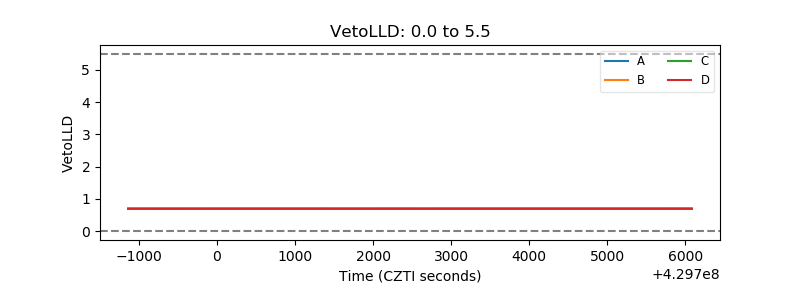 |
| Alpha Counter |  |
| _CPM_Rate | 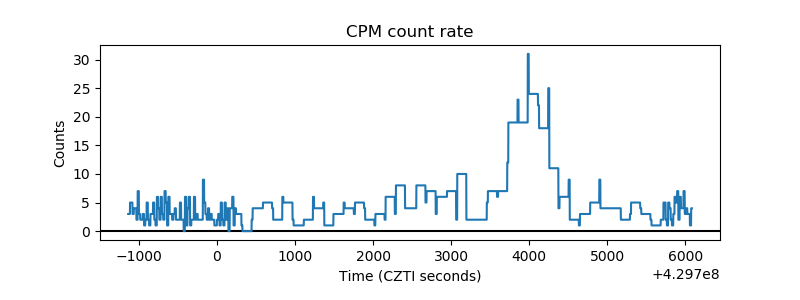 |
| CZT Counter |  |
| +2.5 Volts monitor | 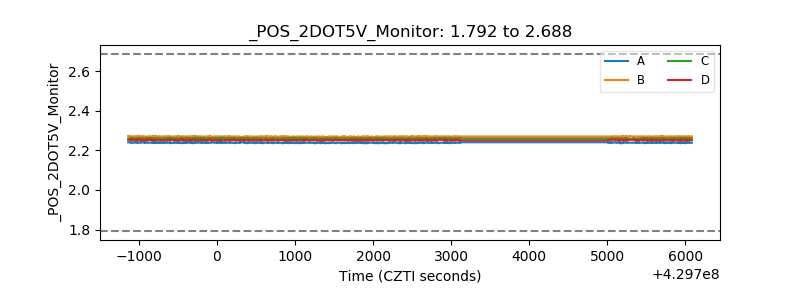 |
| +5 Volts monitor | 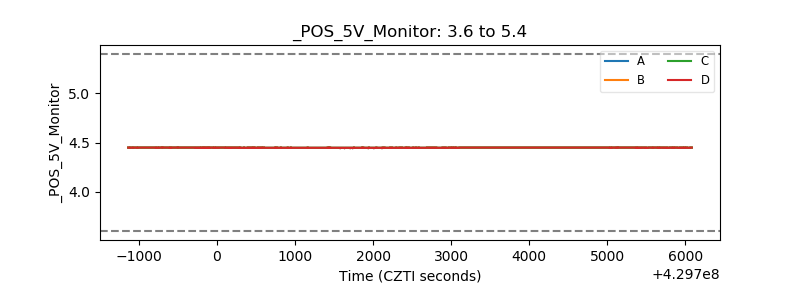 |
| _ROLL_ROT | 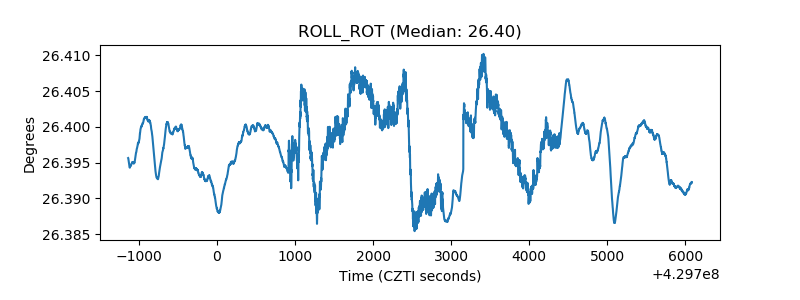 |
| _Roll_DEC | 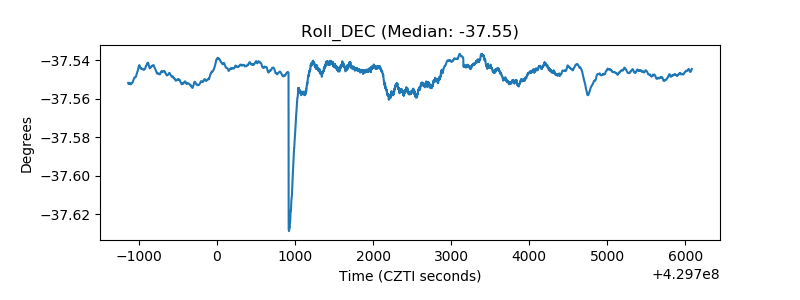 |
| _Roll_RA | 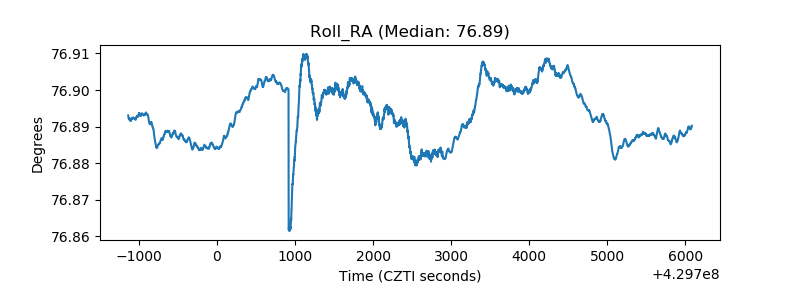 |
| Veto Counter | 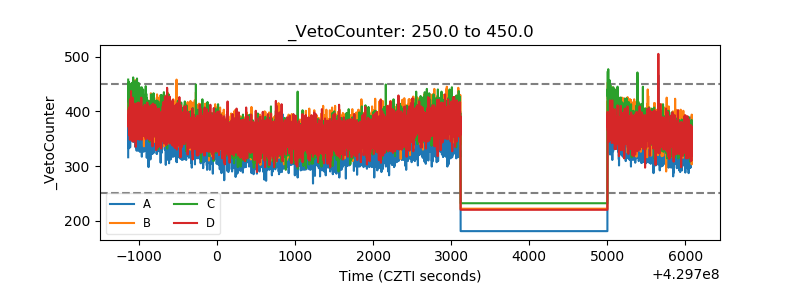 |