| Param | Original file | Final file |
|---|---|---|
| Filename | modeM0/AS1A12_061T07_9000005818_42596cztM0_level2.fits | modeM0/AS1A12_061T07_9000005818_42596cztM0_level2_quad_clean.evt |
| Size (bytes) | 413,412,480 | 92,969,280 |
| Size | 394.3 MB | 88.7 MB |
| Events in quadrant A | 3,189,224 | 637,332 |
| Events in quadrant B | 2,774,977 | 645,708 |
| Events in quadrant C | 2,868,460 | 626,255 |
| Events in quadrant D | 6,006,519 | 489,398 |
| Mode M0 | |||
|---|---|---|---|
| Quadrant | BADHDUFLAG | Total packets | Discarded packets |
| A | 0 | 12942 | 2 |
| B | 0 | 12441 | 2 |
| C | 0 | 12313 | 2 |
| D | 0 | 21996 | 4 |
| Mode SS | |||
|---|---|---|---|
| Quadrant | BADHDUFLAG | Total packets | Discarded packets |
| A | 0 | 120 | 0 |
| B | 0 | 120 | 0 |
| C | 0 | 120 | 0 |
| D | 0 | 120 | 0 |
| Mode M9 | |||
|---|---|---|---|
| Quadrant | BADHDUFLAG | Total packets | Discarded packets |
| A | 0 | 21 | 0 |
| B | 0 | 22 | 0 |
| C | 0 | 22 | 0 |
| D | 0 | 22 | 0 |
| Quadrant | Total seconds | Saturated seconds | Saturation percentage |
|---|---|---|---|
| A | 5962 | 15 | 0.251593% |
| B | 5962 | 30 | 0.503187% |
| C | 5962 | 11 | 0.184502% |
| D | 5961 | 1013 | 16.993793% |
Noise dominated data is calculated using 1-second bins in cleaned event files. If a bin has >2000 counts, and if more than 50% of those come from <1% of pixels, then it is considered to be noise-dominated and hence unusable.
| Quadrant | # 1 sec bins | Bins with >0 counts | Bins with >2000 counts | High rate bins dominated by noise | Noise dominated (total time) | Noise dominated (detector-on time) | Marked lightcurve |
|---|---|---|---|---|---|---|---|
| A | 7275 | 5963 | 4 | 4 | 0.05% | 0.07% | 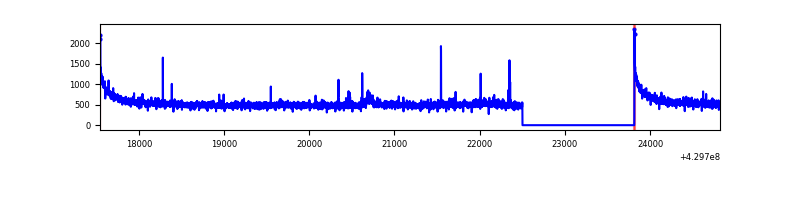 |
| B | 7275 | 5963 | 18 | 18 | 0.25% | 0.30% | 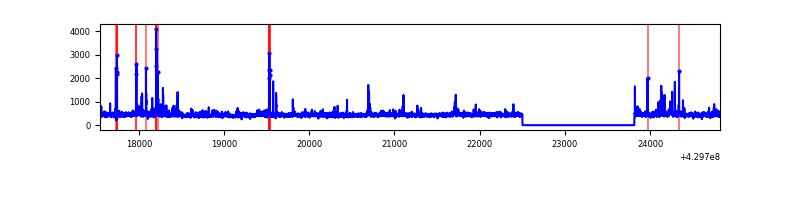 |
| C | 7275 | 5963 | 6 | 6 | 0.08% | 0.10% | 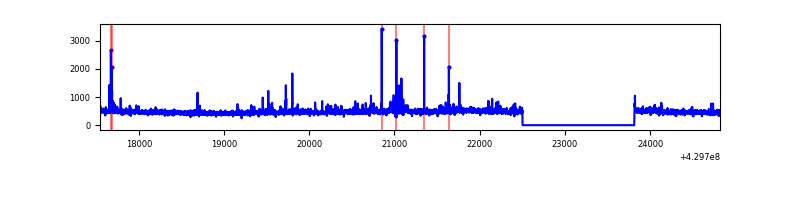 |
| D | 7273 | 5961 | 904 | 904 | 12.43% | 15.17% | 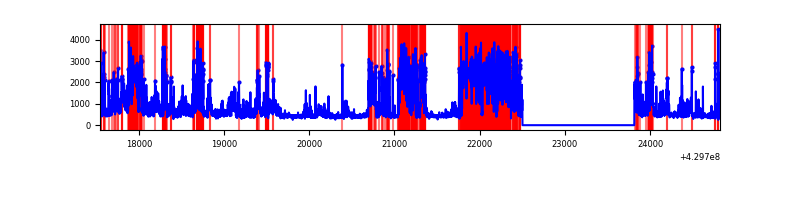 |
Top three noisy pixels from each quadrant. If the there are fewer than three noisy pixels in the level2.evt file, extra rows are filled as -1
| Pixel properties | Quadrant properties | ||||||
|---|---|---|---|---|---|---|---|
| Quadrant | DetID | PixID | Counts | Sigma | Mean | Median | Sigma |
| A | 10 | 83 | 637227 | 4774.43 | 645 | 631 | 133.3 |
| A | 13 | 248 | 39254 | 289.67 | 645 | 631 | 133.3 |
| A | 3 | 137 | 7356 | 50.44 | 645 | 631 | 133.3 |
| B | 0 | 245 | 104132 | 819.06 | 641 | 623 | 126.4 |
| B | 15 | 85 | 38085 | 296.43 | 641 | 623 | 126.4 |
| B | 5 | 255 | 32731 | 254.07 | 641 | 623 | 126.4 |
| C | 15 | 214 | 251662 | 1698.53 | 631 | 633 | 147.8 |
| C | 4 | 254 | 116156 | 781.66 | 631 | 633 | 147.8 |
| C | 8 | 95 | 20714 | 135.87 | 631 | 633 | 147.8 |
| D | 2 | 249 | 3082659 | 21429.46 | 583 | 566 | 143.8 |
| D | 12 | 233 | 319700 | 2218.9 | 583 | 566 | 143.8 |
| D | 1 | 52 | 130275 | 901.85 | 583 | 566 | 143.8 |
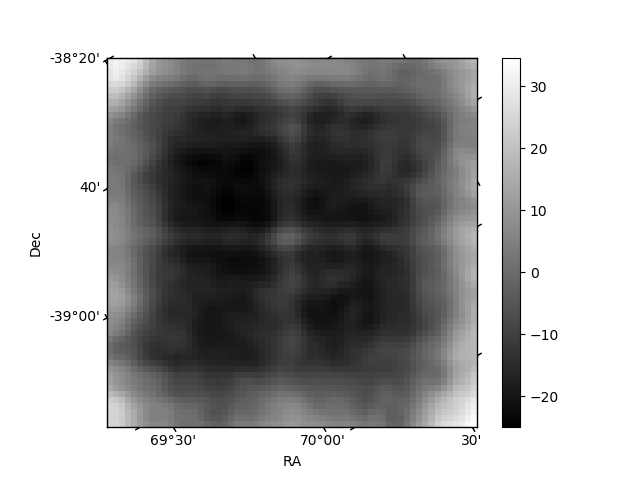
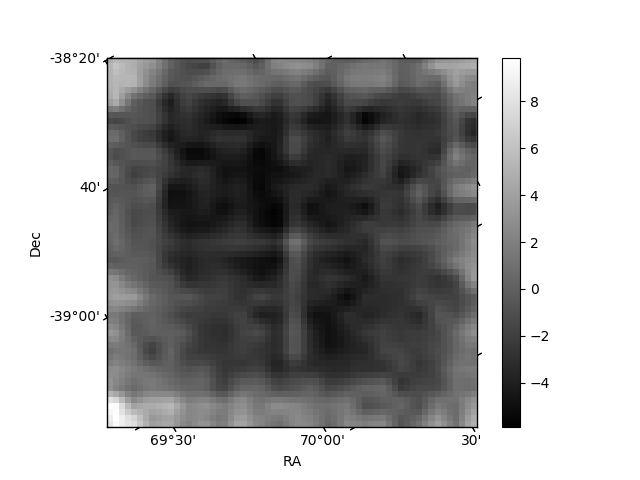
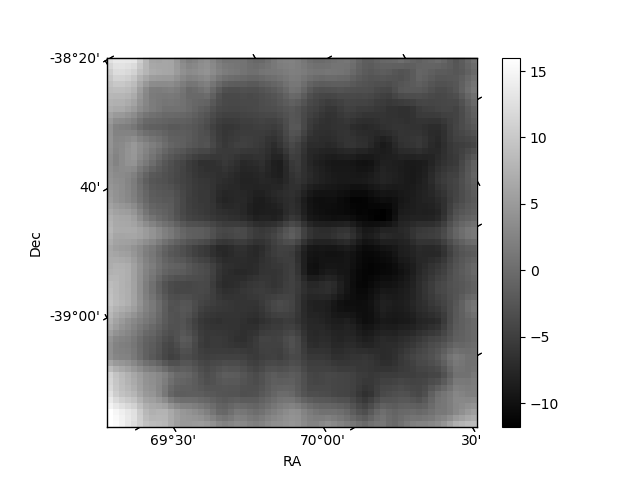
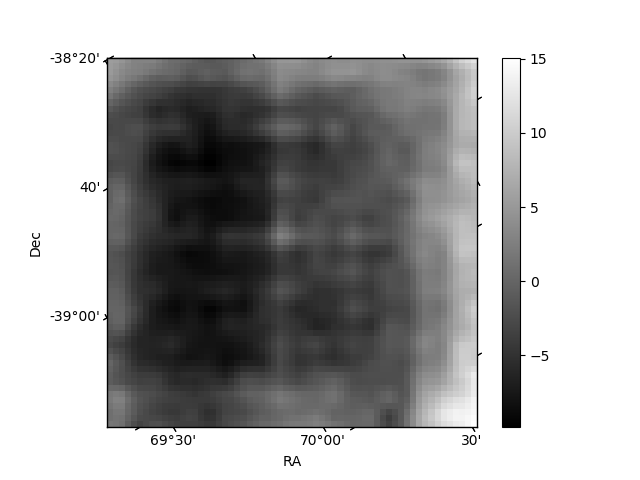
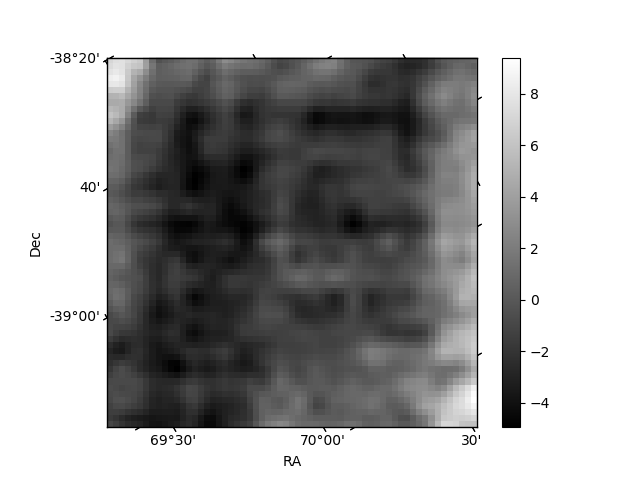
Histogram calculated using DETX and DETY for each event in the final _common_clean file
| Quadrant A | 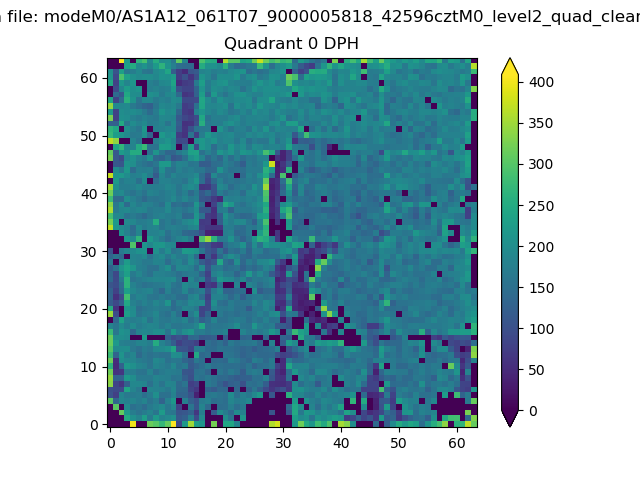 |
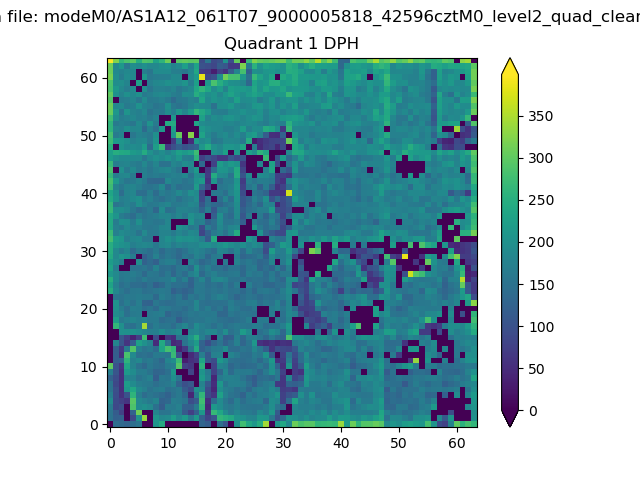 |
Quadrant B |
|---|---|---|---|
| Quadrant D | 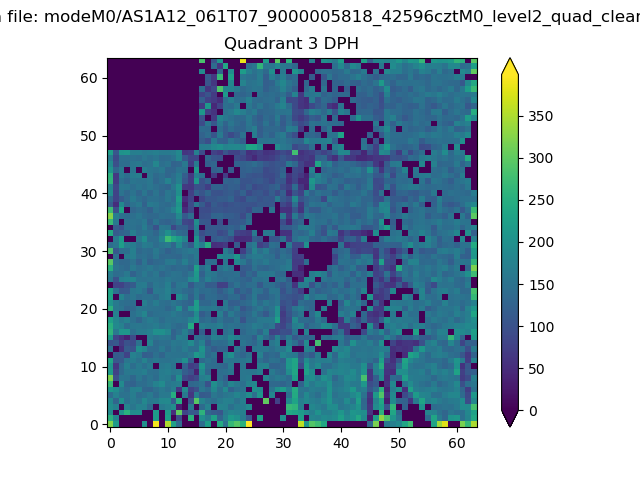 |
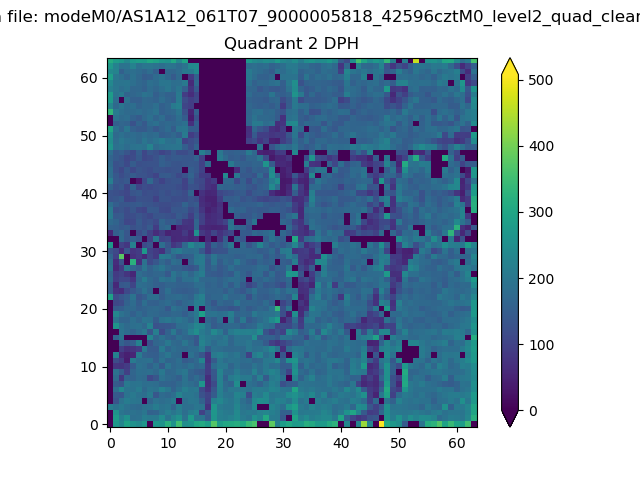 |
Quadrant C |
| Plot type | Count rate plots | Images |
|---|---|---|
| Comparison with Poisson distribution Blue bars denote a histogram of data divided into 1 sec bins. Red curve is a Poisson curve with rate = median count rate of data. |
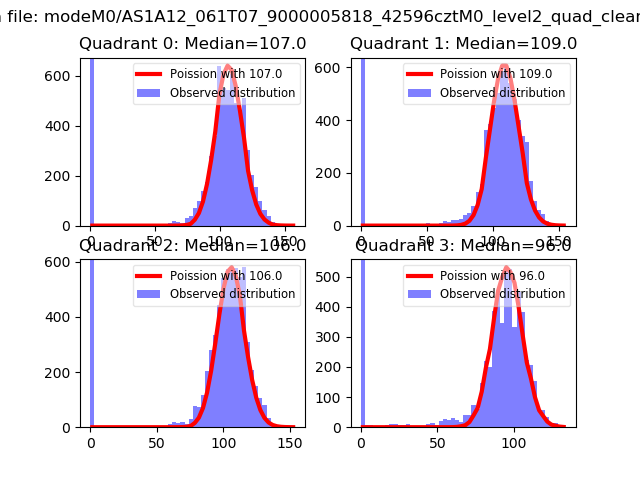 |
 |
| Quadrant-wise count rates Data is divided into 100 sec bins |
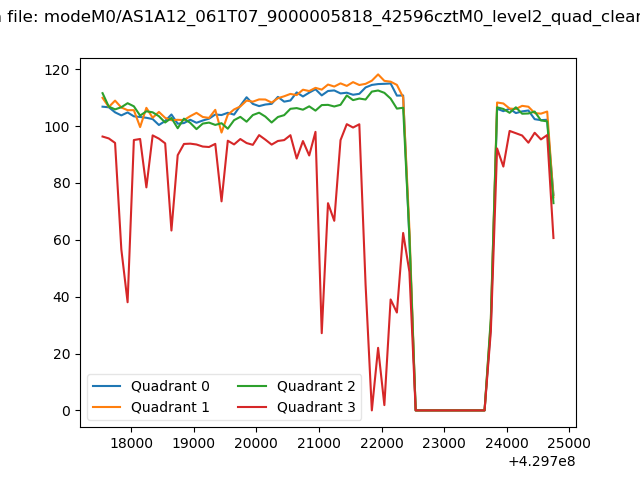 |
|
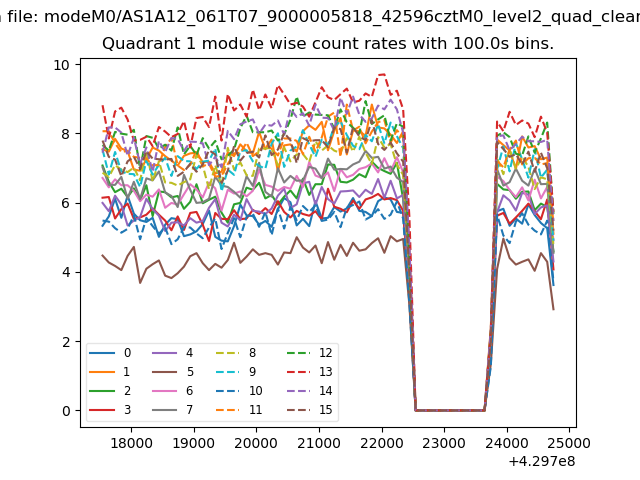
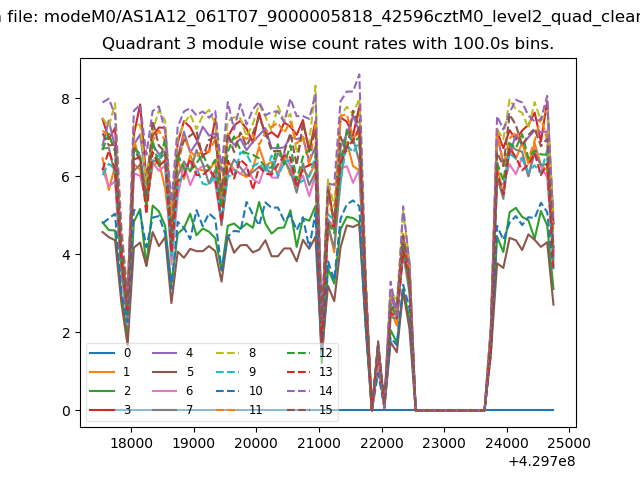
| Module-wise count rates for Quadrant A Data is divided into 100 sec bins |
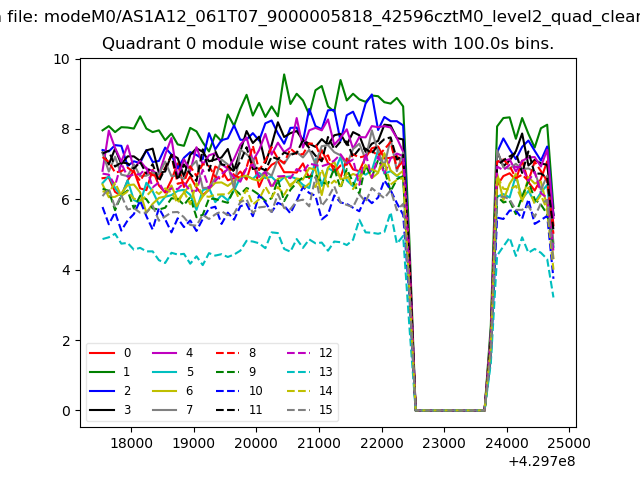 |
 |
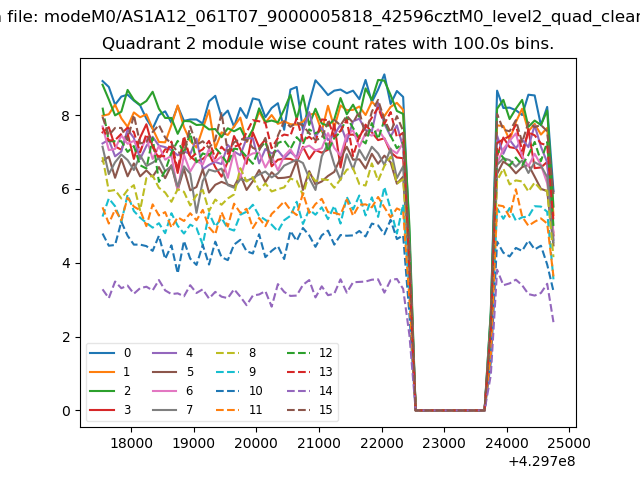
| Module-wise count rates for Quadrant B Data is divided into 100 sec bins |
 |
 |
| Module-wise count rates for Quadrant C Data is divided into 100 sec bins |
 |
 |
| Module-wise count rates for Quadrant D Data is divided into 100 sec bins |
 |
 |
| Parameter | Plot |
|---|---|
| CZT HV Monitor |  |
| D_VDD | 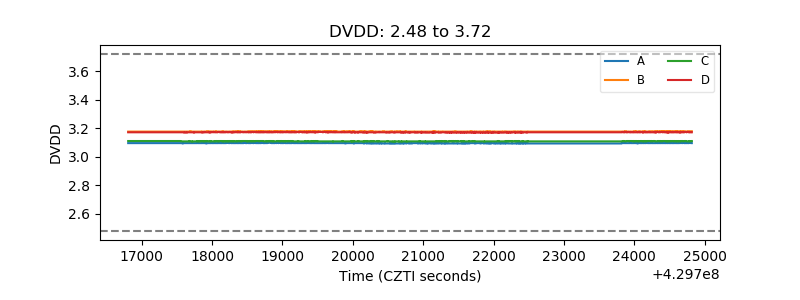 |
| Temperature 1 | 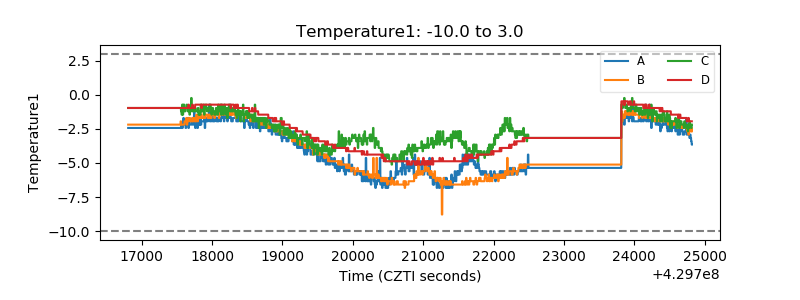 |
| Veto HV Monitor | 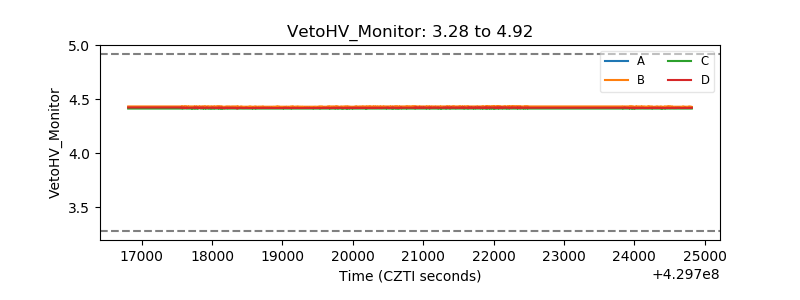 |
| Veto LLD | 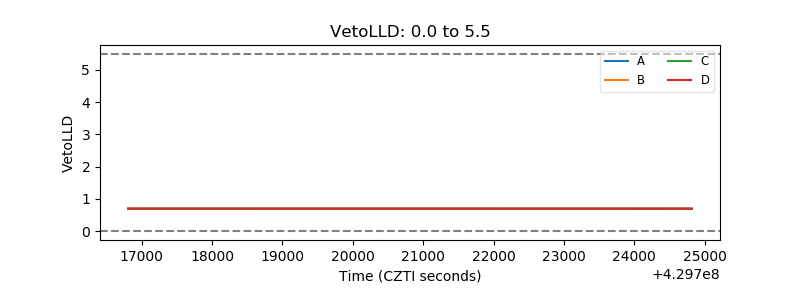 |
| Alpha Counter |  |
| _CPM_Rate |  |
| CZT Counter | 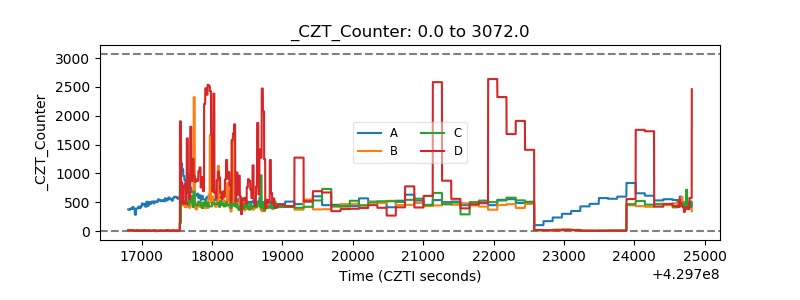 |
| +2.5 Volts monitor | 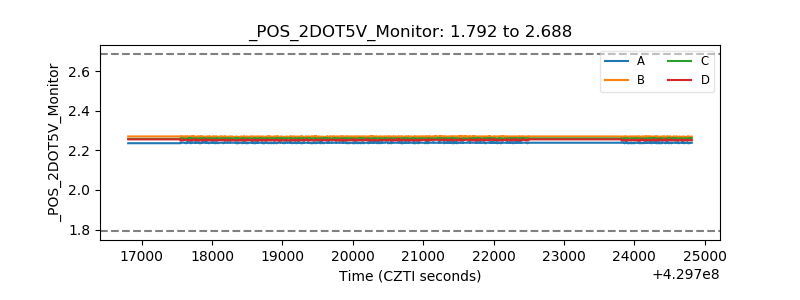 |
| +5 Volts monitor | 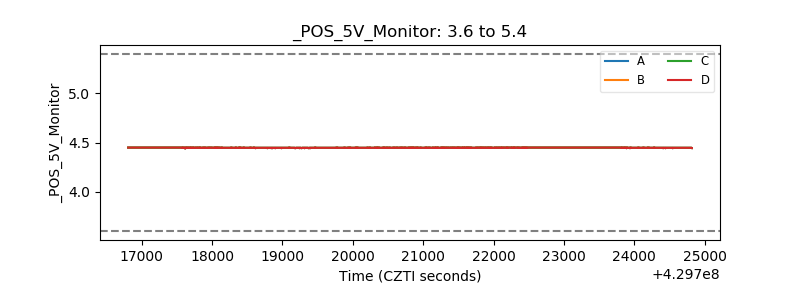 |
| _ROLL_ROT | 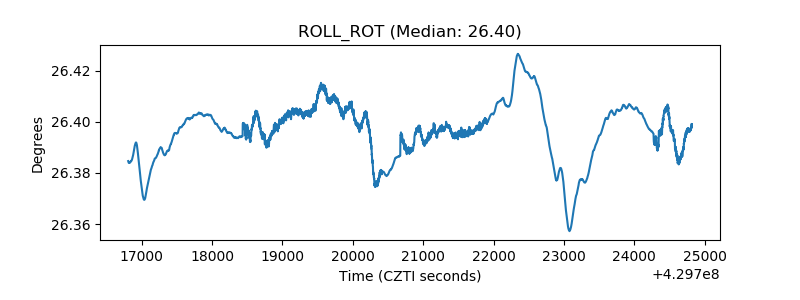 |
| _Roll_DEC | 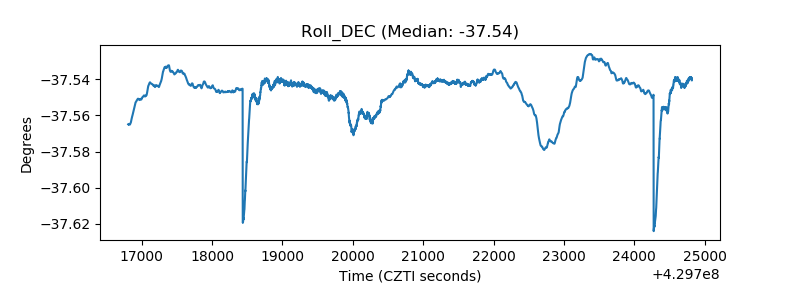 |
| _Roll_RA | 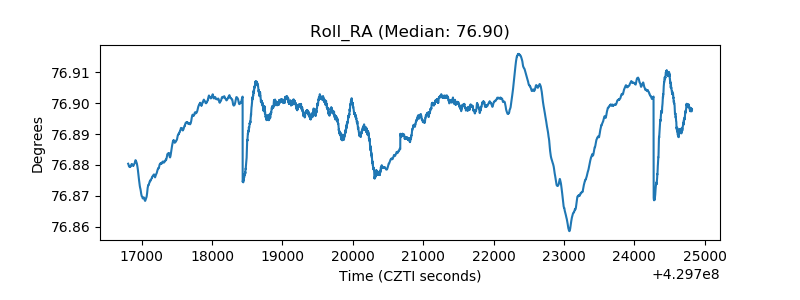 |
| Veto Counter | 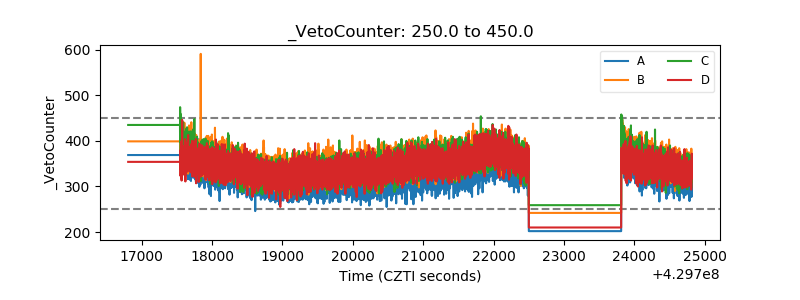 |