| Param | Original file | Final file |
|---|---|---|
| Filename | modeM0/AS1A12_061T07_9000005818_42598cztM0_level2.fits | modeM0/AS1A12_061T07_9000005818_42598cztM0_level2_quad_clean.evt |
| Size (bytes) | 648,852,480 | 171,092,160 |
| Size | 618.8 MB | 163.2 MB |
| Events in quadrant A | 5,607,549 | 1,149,394 |
| Events in quadrant B | 4,806,426 | 1,173,570 |
| Events in quadrant C | 5,492,620 | 1,120,187 |
| Events in quadrant D | 7,281,729 | 996,395 |
| Mode M0 | |||
|---|---|---|---|
| Quadrant | BADHDUFLAG | Total packets | Discarded packets |
| A | 0 | 22982 | 4 |
| B | 0 | 21857 | 3 |
| C | 0 | 23002 | 3 |
| D | 0 | 29204 | 3 |
| Mode SS | |||
|---|---|---|---|
| Quadrant | BADHDUFLAG | Total packets | Discarded packets |
| A | 0 | 216 | 0 |
| B | 0 | 216 | 0 |
| C | 0 | 216 | 0 |
| D | 0 | 216 | 0 |
| Mode M9 | |||
|---|---|---|---|
| Quadrant | BADHDUFLAG | Total packets | Discarded packets |
| A | 0 | 36 | 0 |
| B | 0 | 37 | 0 |
| C | 0 | 37 | 0 |
| D | 0 | 37 | 0 |
| Quadrant | Total seconds | Saturated seconds | Saturation percentage |
|---|---|---|---|
| A | 10700 | 22 | 0.205607% |
| B | 10700 | 15 | 0.140187% |
| C | 10700 | 48 | 0.448598% |
| D | 10700 | 530 | 4.953271% |
Noise dominated data is calculated using 1-second bins in cleaned event files. If a bin has >2000 counts, and if more than 50% of those come from <1% of pixels, then it is considered to be noise-dominated and hence unusable.
| Quadrant | # 1 sec bins | Bins with >0 counts | Bins with >2000 counts | High rate bins dominated by noise | Noise dominated (total time) | Noise dominated (detector-on time) | Marked lightcurve |
|---|---|---|---|---|---|---|---|
| A | 13475 | 10702 | 6 | 6 | 0.04% | 0.06% | 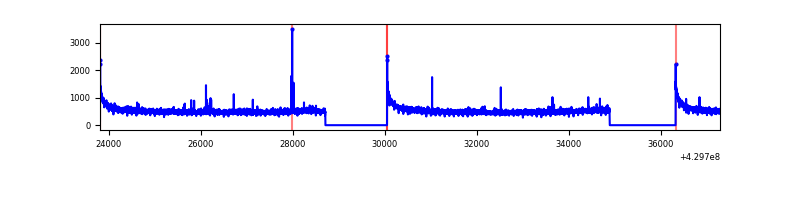 |
| B | 13475 | 10702 | 8 | 8 | 0.06% | 0.07% | 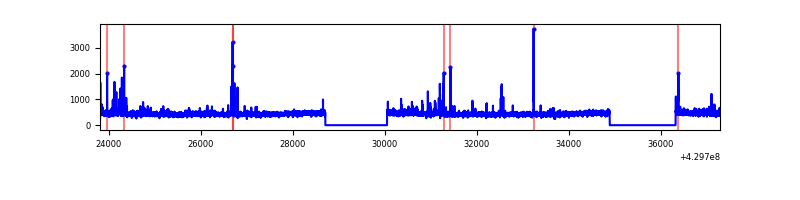 |
| C | 13475 | 10702 | 34 | 34 | 0.25% | 0.32% | 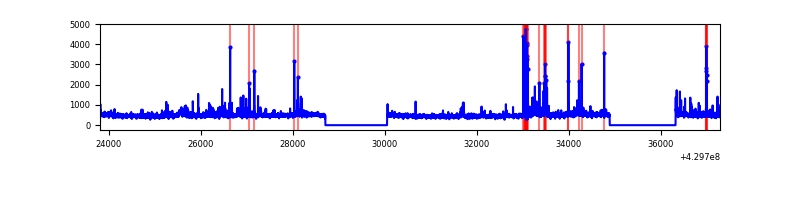 |
| D | 13475 | 10702 | 503 | 503 | 3.73% | 4.70% | 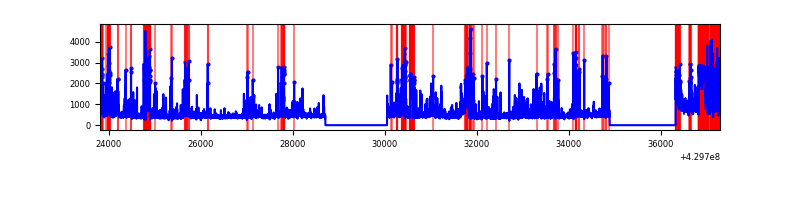 |
Top three noisy pixels from each quadrant. If the there are fewer than three noisy pixels in the level2.evt file, extra rows are filled as -1
| Pixel properties | Quadrant properties | ||||||
|---|---|---|---|---|---|---|---|
| Quadrant | DetID | PixID | Counts | Sigma | Mean | Median | Sigma |
| A | 10 | 83 | 1062629 | 4485.48 | 1161 | 1134 | 236.7 |
| A | 2 | 79 | 20072 | 80.02 | 1161 | 1134 | 236.7 |
| A | 13 | 248 | 18122 | 71.78 | 1161 | 1134 | 236.7 |
| B | 0 | 245 | 132856 | 596.27 | 1155 | 1124 | 220.9 |
| B | 0 | 229 | 32257 | 140.92 | 1155 | 1124 | 220.9 |
| B | 0 | 156 | 32037 | 139.93 | 1155 | 1124 | 220.9 |
| C | 15 | 214 | 472173 | 1788.38 | 1132 | 1137 | 263.4 |
| C | 4 | 254 | 283453 | 1071.87 | 1132 | 1137 | 263.4 |
| C | 5 | 250 | 135450 | 509.95 | 1132 | 1137 | 263.4 |
| D | 1 | 52 | 1098975 | 4027.38 | 1110 | 1079 | 272.6 |
| D | 2 | 249 | 506499 | 1854.02 | 1110 | 1079 | 272.6 |
| D | 2 | 16 | 366779 | 1341.49 | 1110 | 1079 | 272.6 |
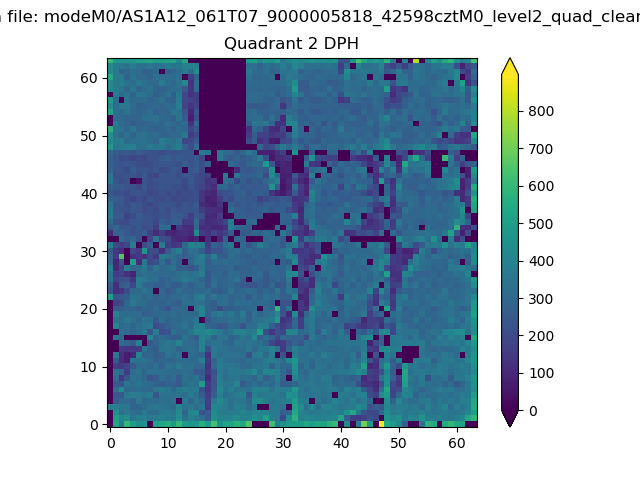
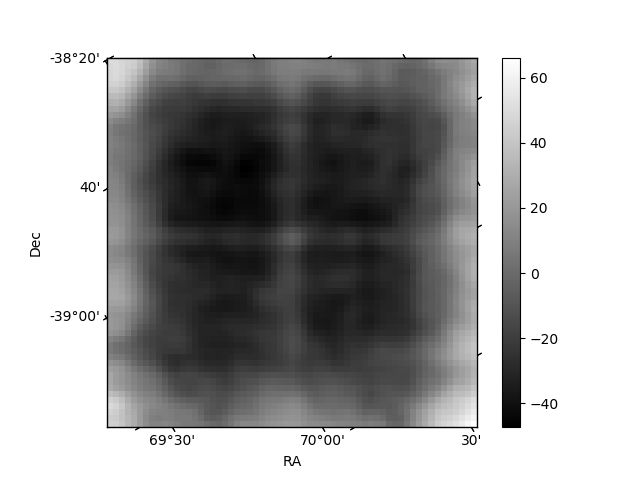
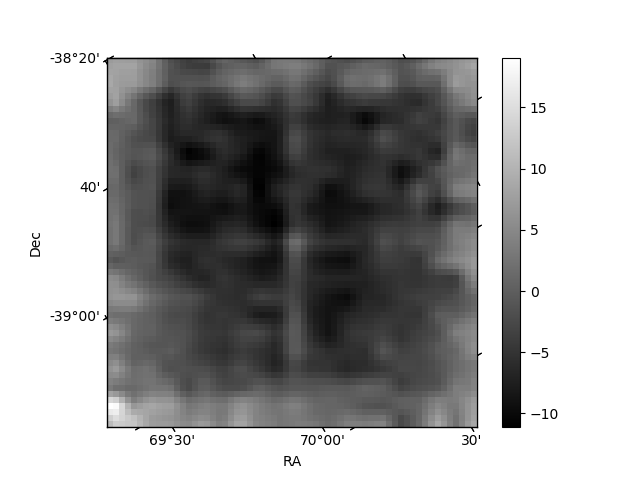
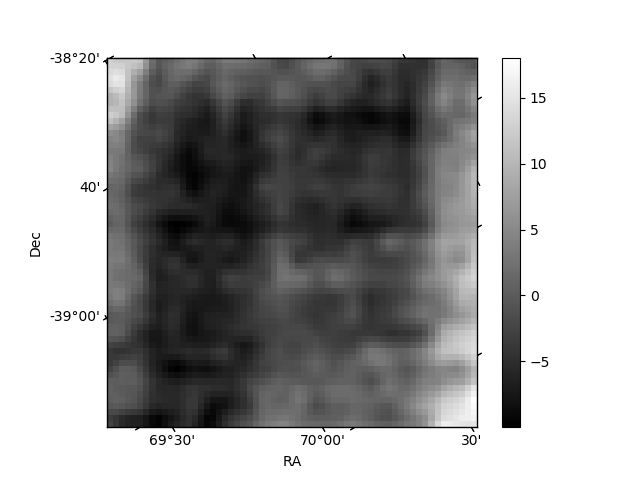
Histogram calculated using DETX and DETY for each event in the final _common_clean file
| Quadrant A | 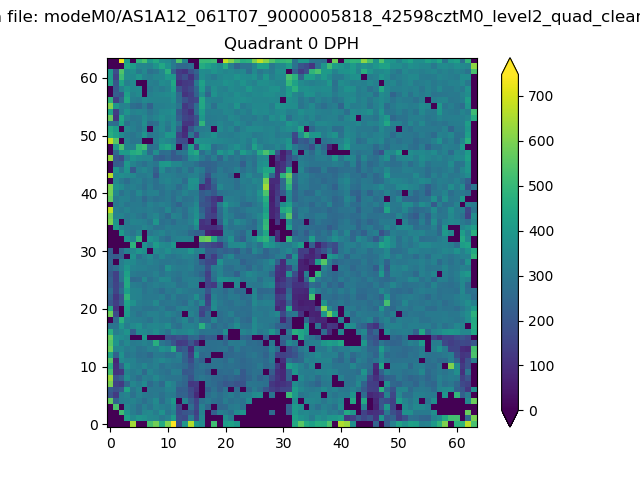 |
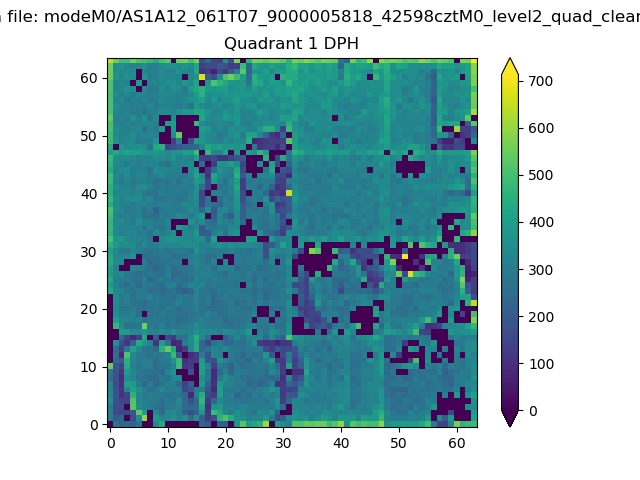 |
Quadrant B |
|---|---|---|---|
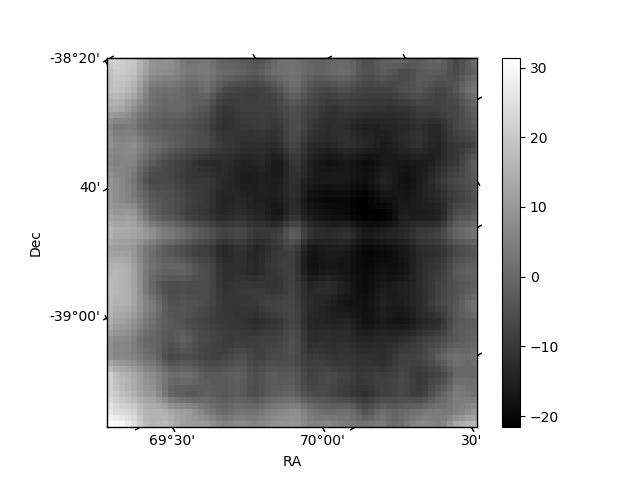
| Quadrant D | 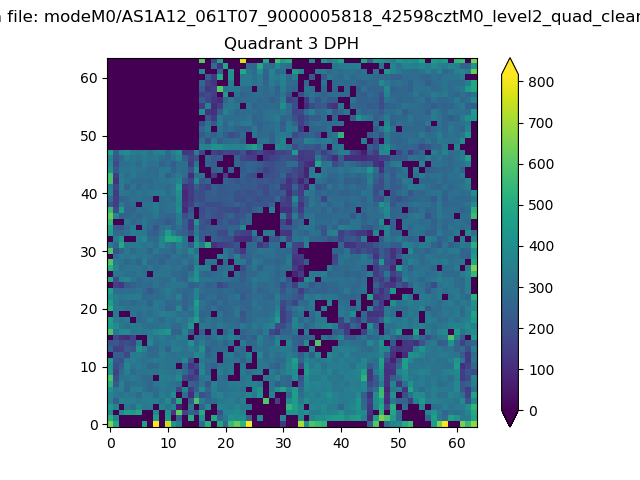 |
 |
Quadrant C |
| Plot type | Count rate plots | Images |
|---|---|---|
| Comparison with Poisson distribution Blue bars denote a histogram of data divided into 1 sec bins. Red curve is a Poisson curve with rate = median count rate of data. |
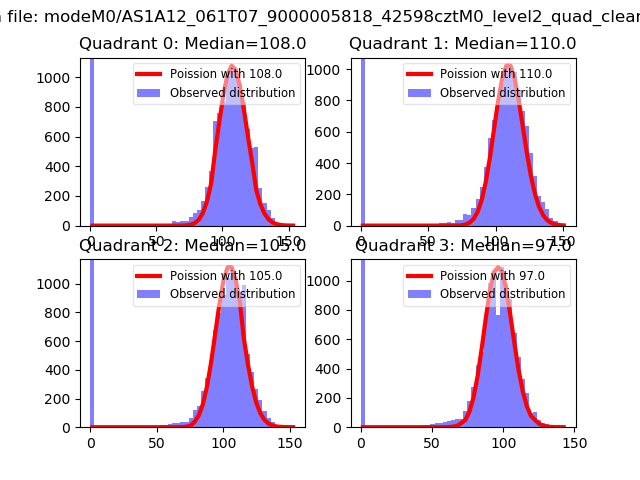 |
 |
| Quadrant-wise count rates Data is divided into 100 sec bins |
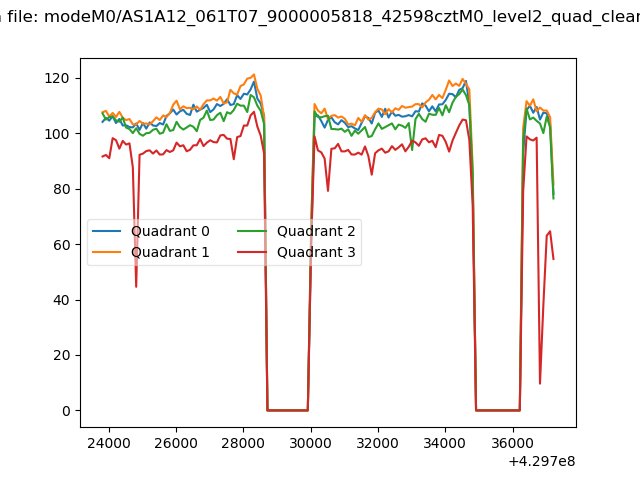 |
|
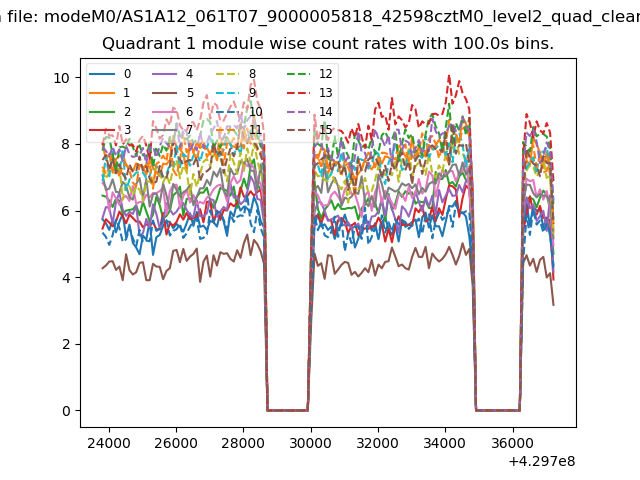
| Module-wise count rates for Quadrant A Data is divided into 100 sec bins |
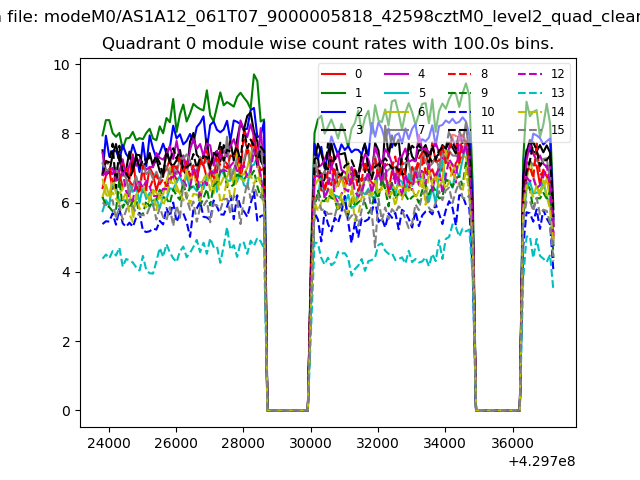 |
 |
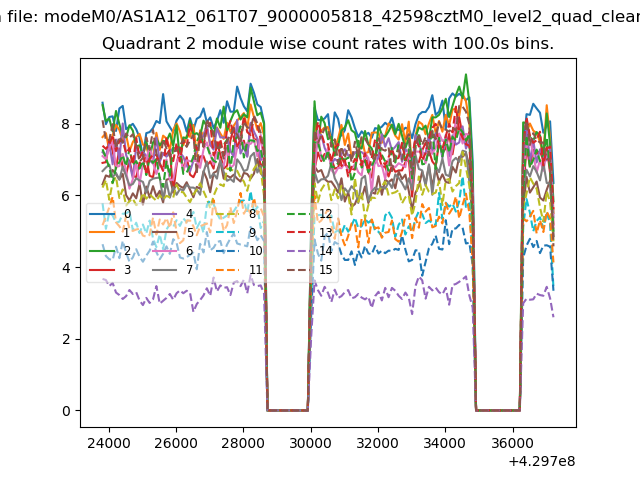
| Module-wise count rates for Quadrant B Data is divided into 100 sec bins |
 |
 |
| Module-wise count rates for Quadrant C Data is divided into 100 sec bins |
 |
 |
| Module-wise count rates for Quadrant D Data is divided into 100 sec bins |
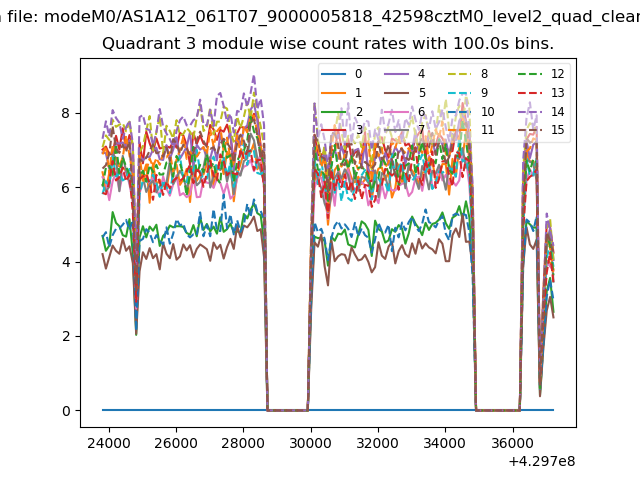 |
 |
| Parameter | Plot |
|---|---|
| CZT HV Monitor | 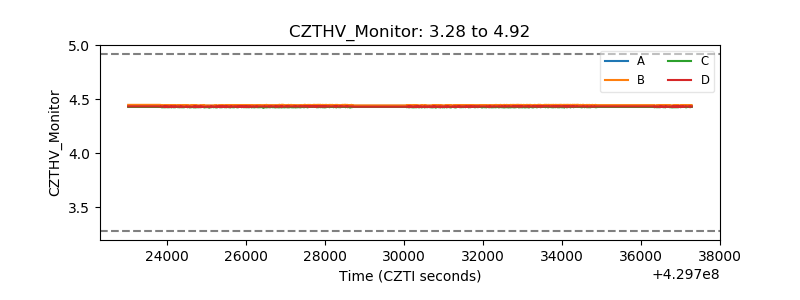 |
| D_VDD | 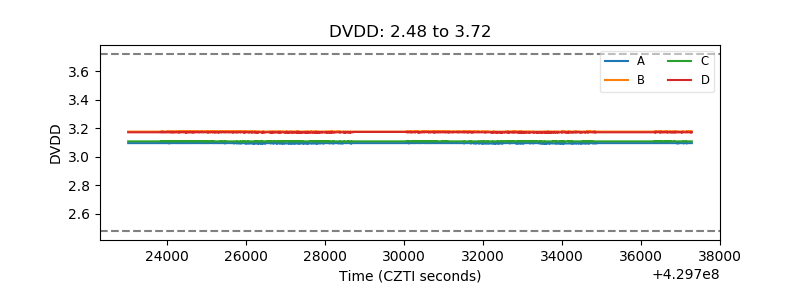 |
| Temperature 1 | 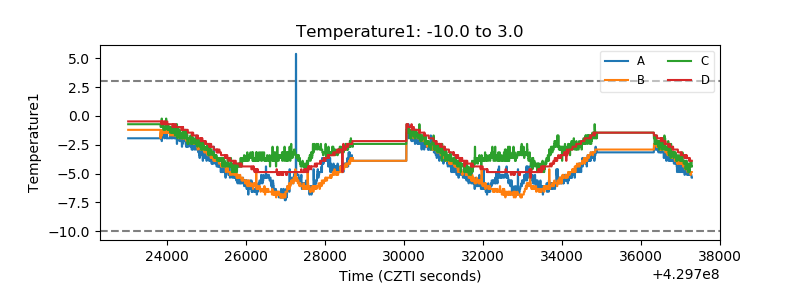 |
| Veto HV Monitor | 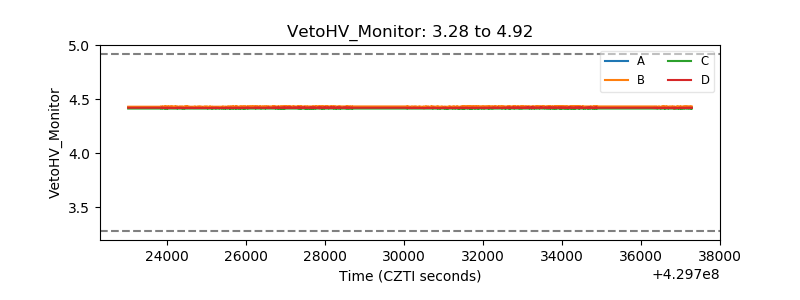 |
| Veto LLD | 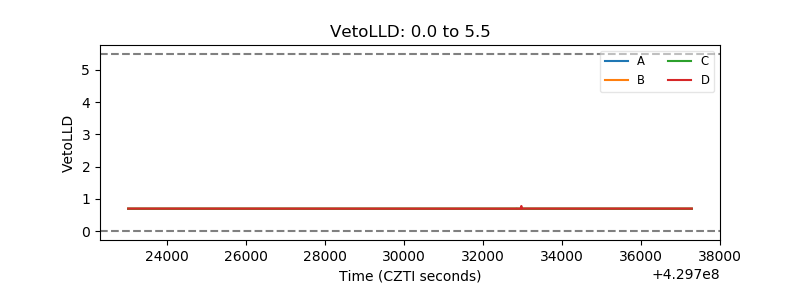 |
| Alpha Counter | 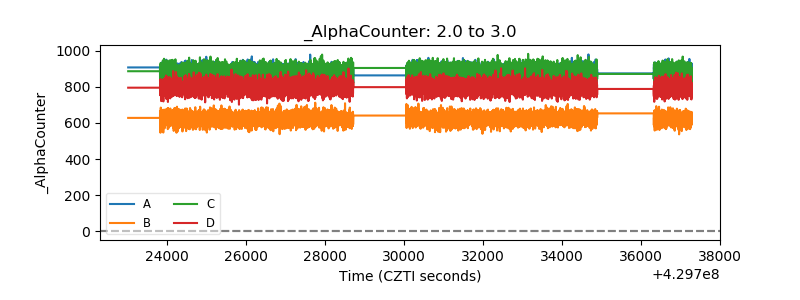 |
| _CPM_Rate | 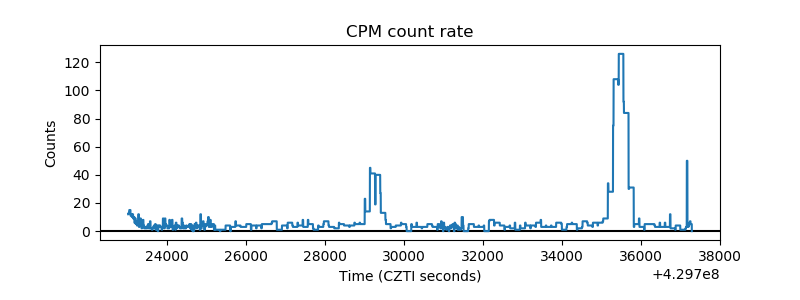 |
| CZT Counter | 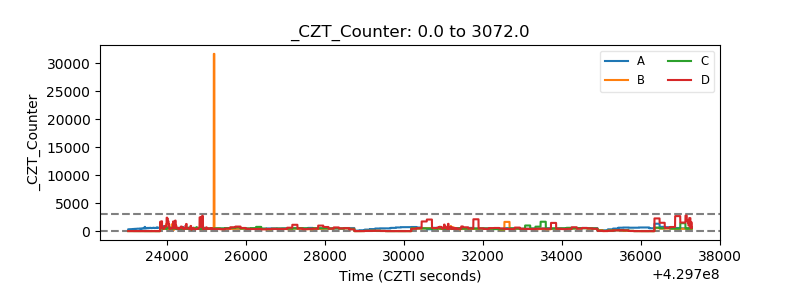 |
| +2.5 Volts monitor | 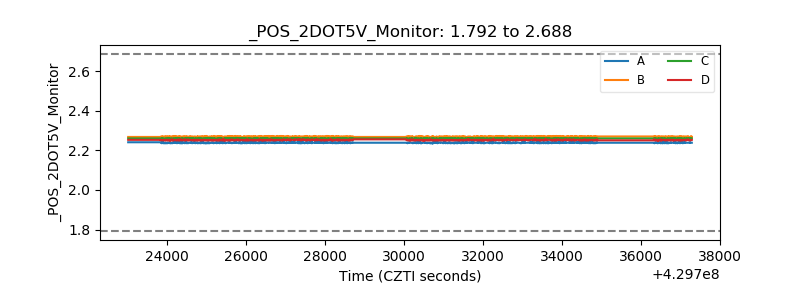 |
| +5 Volts monitor | 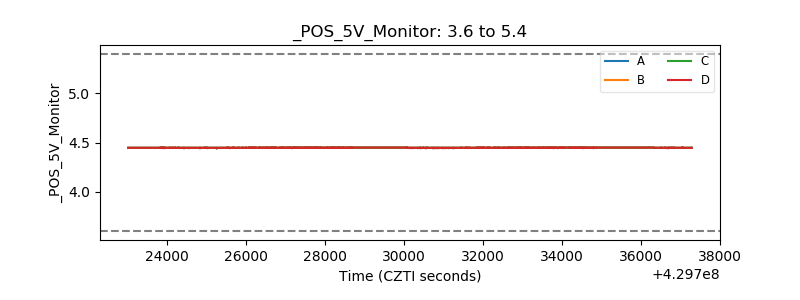 |
| _ROLL_ROT | 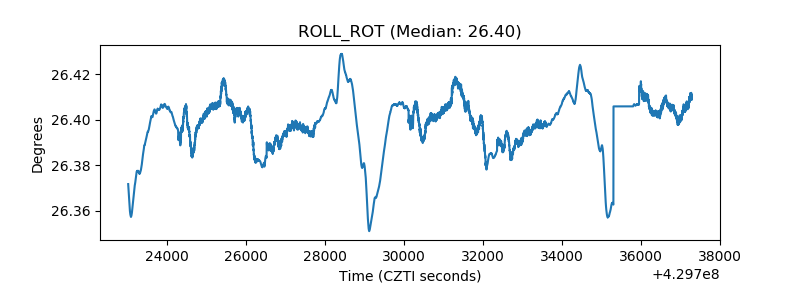 |
| _Roll_DEC | 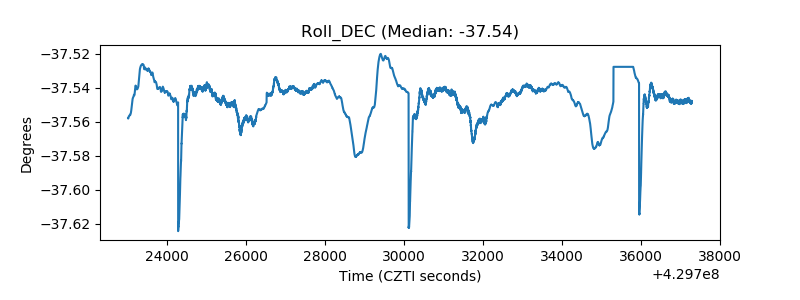 |
| _Roll_RA | 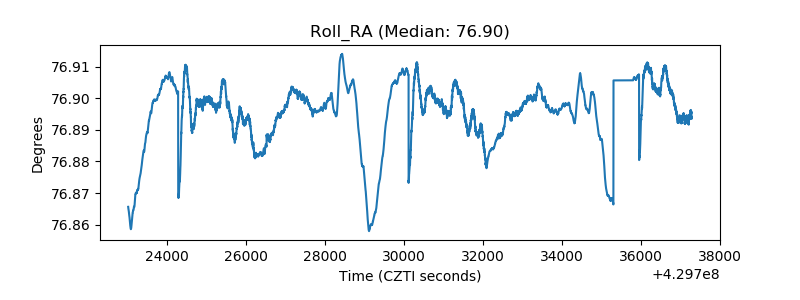 |
| Veto Counter | 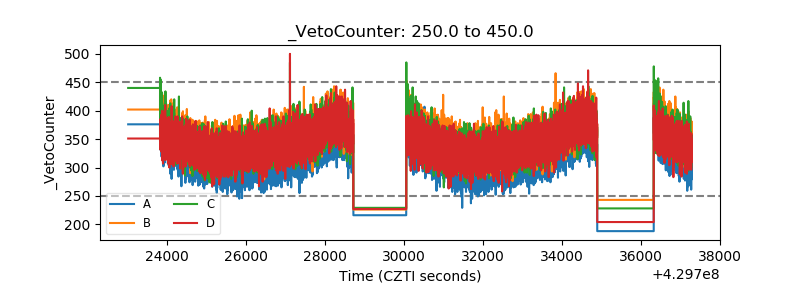 |