| Param | Original file | Final file |
|---|---|---|
| Filename | modeM0/AS1A12_061T07_9000005818_42599cztM0_level2.fits | modeM0/AS1A12_061T07_9000005818_42599cztM0_level2_quad_clean.evt |
| Size (bytes) | 373,040,640 | 90,815,040 |
| Size | 355.8 MB | 86.6 MB |
| Events in quadrant A | 3,032,479 | 620,121 |
| Events in quadrant B | 2,589,870 | 630,338 |
| Events in quadrant C | 3,611,793 | 578,151 |
| Events in quadrant D | 4,130,611 | 522,440 |
| Mode M0 | |||
|---|---|---|---|
| Quadrant | BADHDUFLAG | Total packets | Discarded packets |
| A | 0 | 12464 | 2 |
| B | 0 | 11738 | 3 |
| C | 0 | 14312 | 2 |
| D | 0 | 16206 | 2 |
| Mode SS | |||
|---|---|---|---|
| Quadrant | BADHDUFLAG | Total packets | Discarded packets |
| A | 0 | 116 | 0 |
| B | 0 | 116 | 0 |
| C | 0 | 116 | 0 |
| D | 0 | 116 | 0 |
| Mode M9 | |||
|---|---|---|---|
| Quadrant | BADHDUFLAG | Total packets | Discarded packets |
| A | 0 | 27 | 0 |
| B | 0 | 28 | 0 |
| C | 0 | 28 | 0 |
| D | 0 | 28 | 0 |
| Quadrant | Total seconds | Saturated seconds | Saturation percentage |
|---|---|---|---|
| A | 5702 | 14 | 0.245528% |
| B | 5701 | 28 | 0.491142% |
| C | 5701 | 264 | 4.630767% |
| D | 5701 | 398 | 6.981231% |
Noise dominated data is calculated using 1-second bins in cleaned event files. If a bin has >2000 counts, and if more than 50% of those come from <1% of pixels, then it is considered to be noise-dominated and hence unusable.
| Quadrant | # 1 sec bins | Bins with >0 counts | Bins with >2000 counts | High rate bins dominated by noise | Noise dominated (total time) | Noise dominated (detector-on time) | Marked lightcurve |
|---|---|---|---|---|---|---|---|
| A | 7254 | 5703 | 7 | 7 | 0.10% | 0.12% | 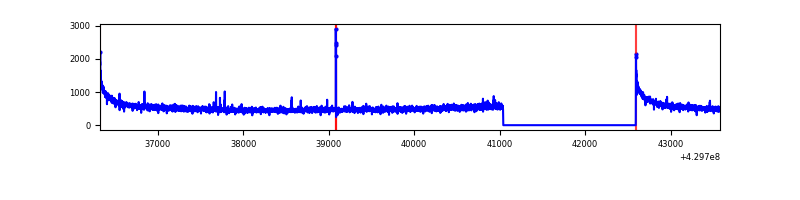 |
| B | 7253 | 5702 | 13 | 13 | 0.18% | 0.23% | 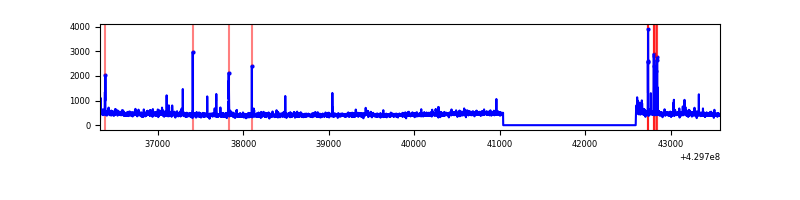 |
| C | 7253 | 5702 | 244 | 244 | 3.36% | 4.28% | 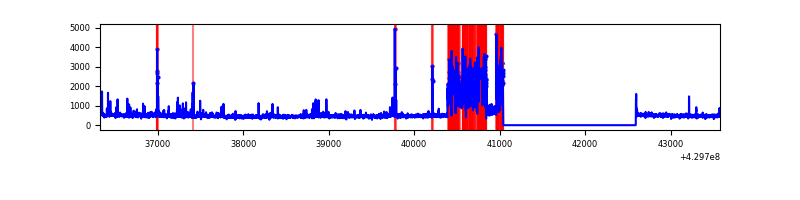 |
| D | 7253 | 5702 | 371 | 371 | 5.12% | 6.51% | 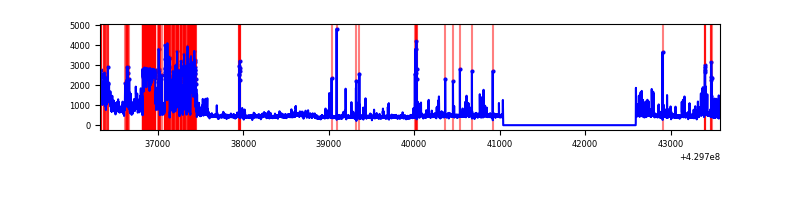 |
Top three noisy pixels from each quadrant. If the there are fewer than three noisy pixels in the level2.evt file, extra rows are filled as -1
| Pixel properties | Quadrant properties | ||||||
|---|---|---|---|---|---|---|---|
| Quadrant | DetID | PixID | Counts | Sigma | Mean | Median | Sigma |
| A | 10 | 83 | 591082 | 4634.73 | 622 | 608 | 127.4 |
| A | 13 | 6 | 11698 | 87.05 | 622 | 608 | 127.4 |
| A | 15 | 237 | 10877 | 80.6 | 622 | 608 | 127.4 |
| B | 0 | 245 | 68306 | 558.82 | 619 | 601 | 121.2 |
| B | 5 | 255 | 50334 | 410.48 | 619 | 601 | 121.2 |
| B | 4 | 141 | 19306 | 154.39 | 619 | 601 | 121.2 |
| C | 5 | 250 | 673573 | 4805.64 | 597 | 600 | 140.0 |
| C | 15 | 214 | 252351 | 1797.73 | 597 | 600 | 140.0 |
| C | 5 | 233 | 160358 | 1140.82 | 597 | 600 | 140.0 |
| D | 1 | 52 | 1101948 | 7631.48 | 583 | 566 | 144.3 |
| D | 2 | 16 | 478001 | 3308.15 | 583 | 566 | 144.3 |
| D | 13 | 249 | 87446 | 601.99 | 583 | 566 | 144.3 |
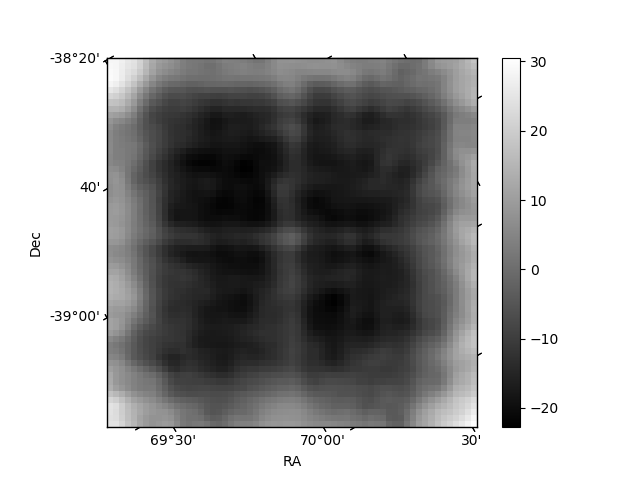
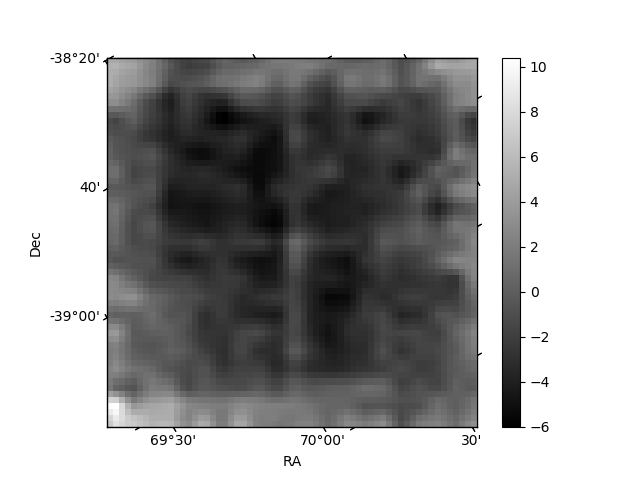
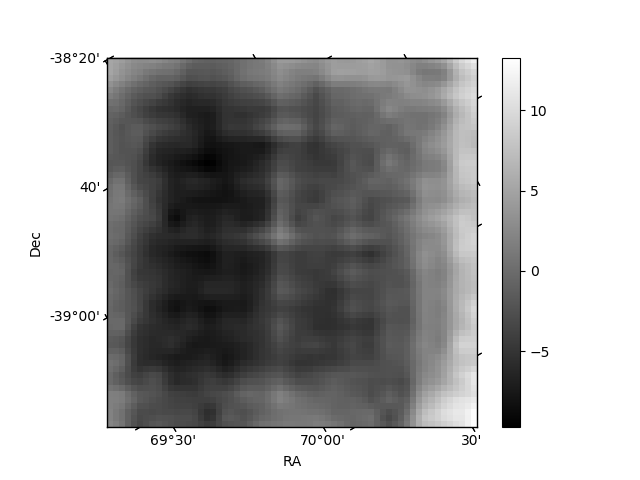
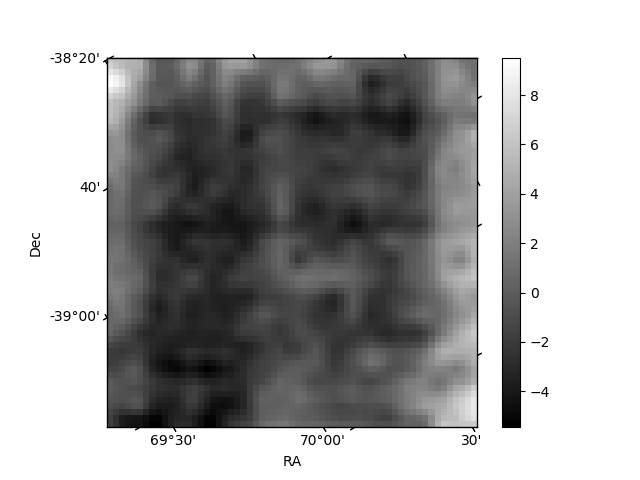
Histogram calculated using DETX and DETY for each event in the final _common_clean file
| Quadrant A | 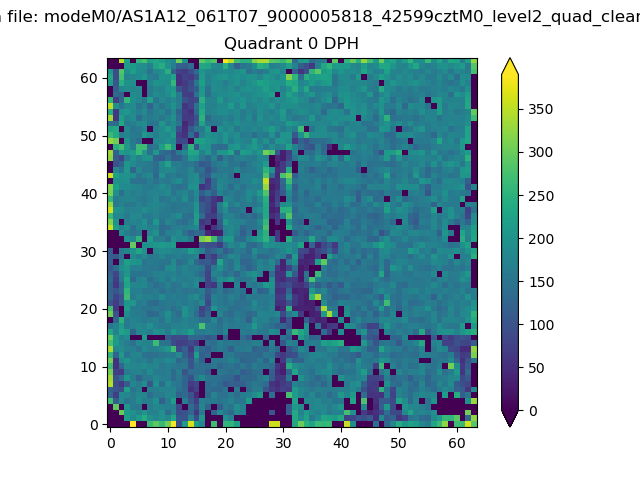 |
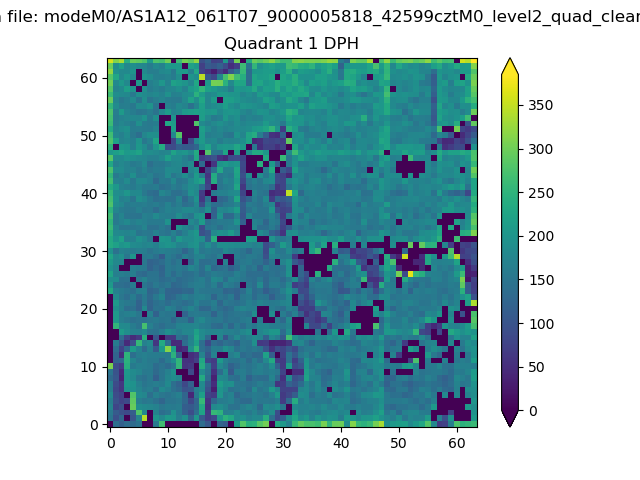 |
Quadrant B |
|---|---|---|---|
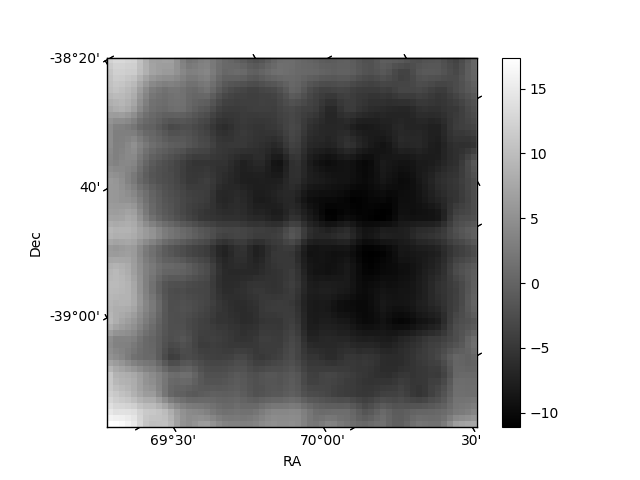
| Quadrant D | 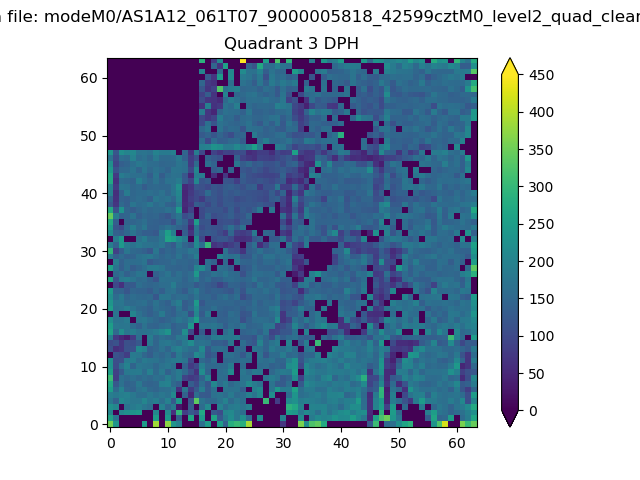 |
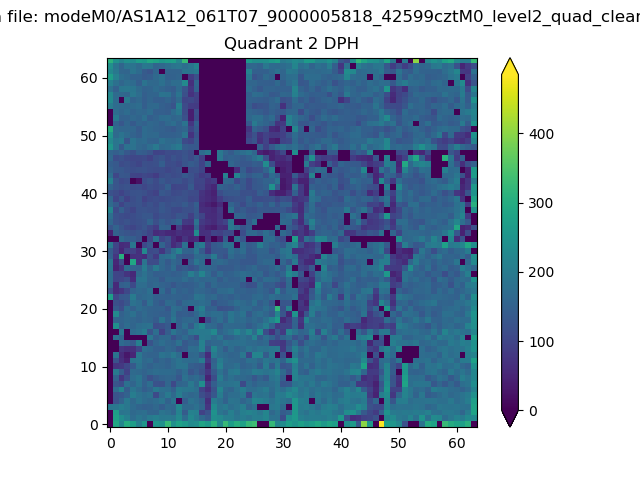 |
Quadrant C |
| Plot type | Count rate plots | Images |
|---|---|---|
| Comparison with Poisson distribution Blue bars denote a histogram of data divided into 1 sec bins. Red curve is a Poisson curve with rate = median count rate of data. |
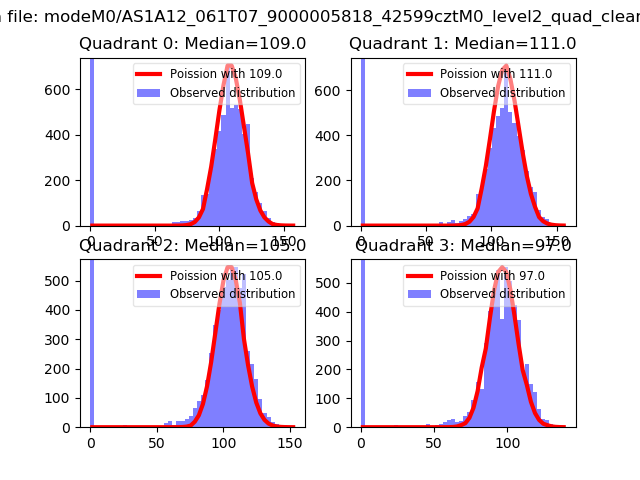 |
 |
| Quadrant-wise count rates Data is divided into 100 sec bins |
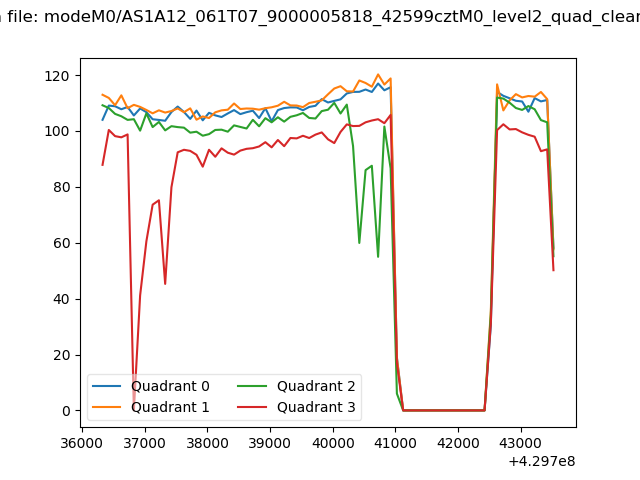 |
|
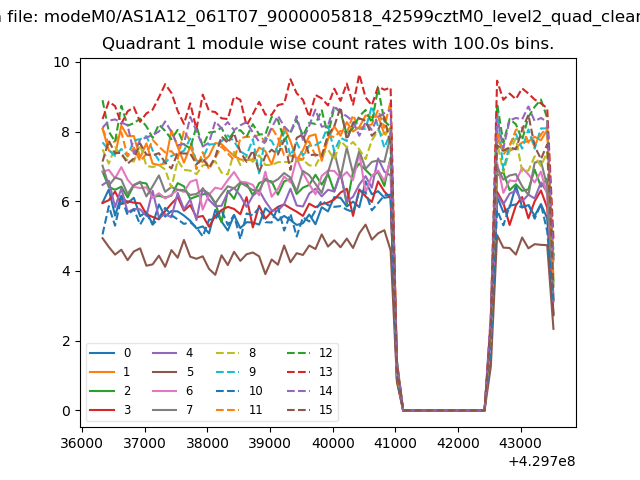
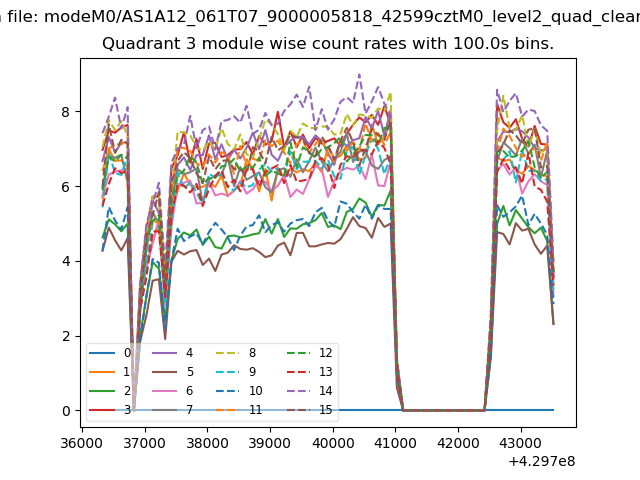
| Module-wise count rates for Quadrant A Data is divided into 100 sec bins |
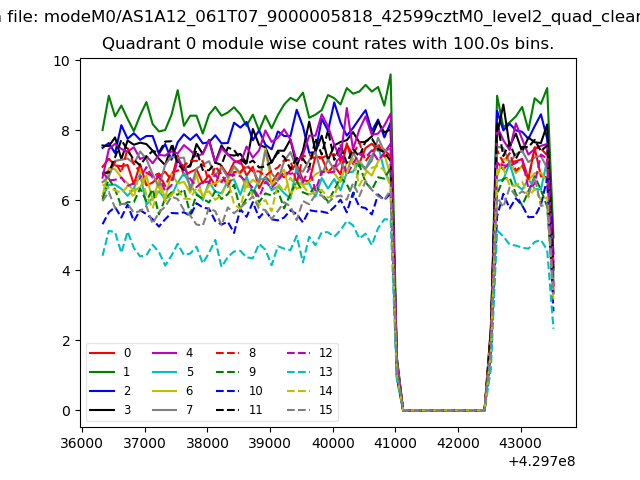 |
 |
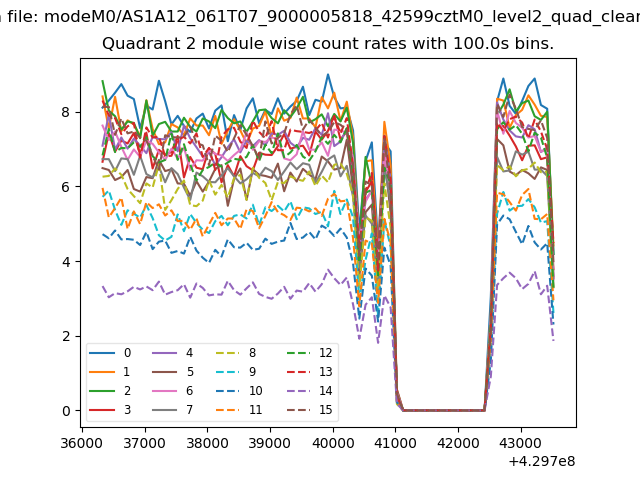
| Module-wise count rates for Quadrant B Data is divided into 100 sec bins |
 |
 |
| Module-wise count rates for Quadrant C Data is divided into 100 sec bins |
 |
 |
| Module-wise count rates for Quadrant D Data is divided into 100 sec bins |
 |
 |
| Parameter | Plot |
|---|---|
| CZT HV Monitor | 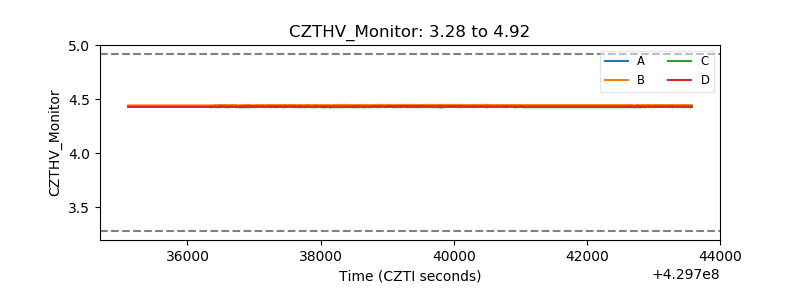 |
| D_VDD | 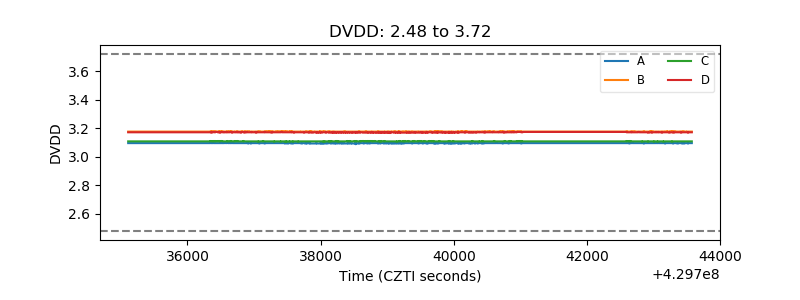 |
| Temperature 1 | 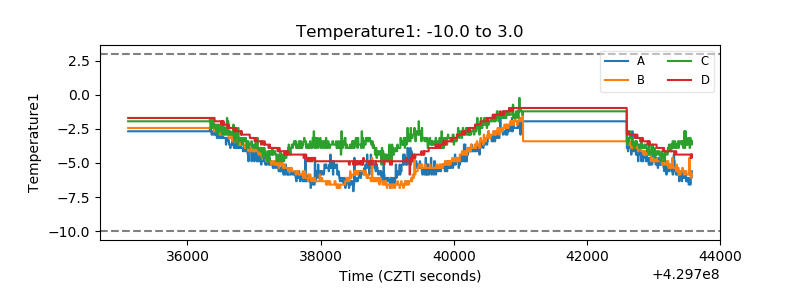 |
| Veto HV Monitor | 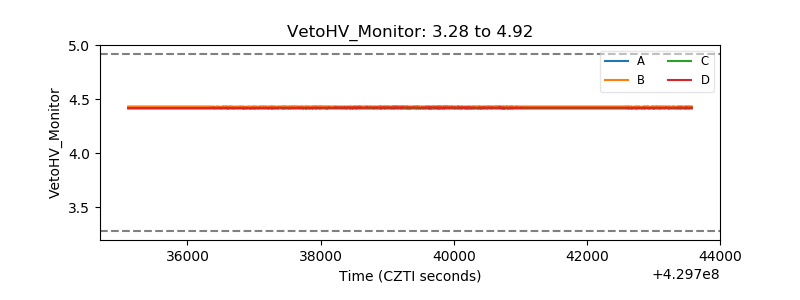 |
| Veto LLD | 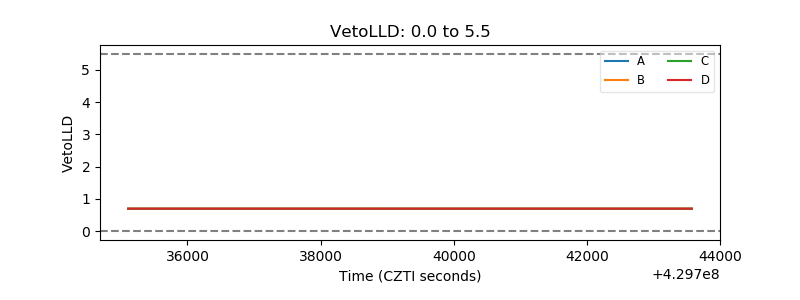 |
| Alpha Counter | 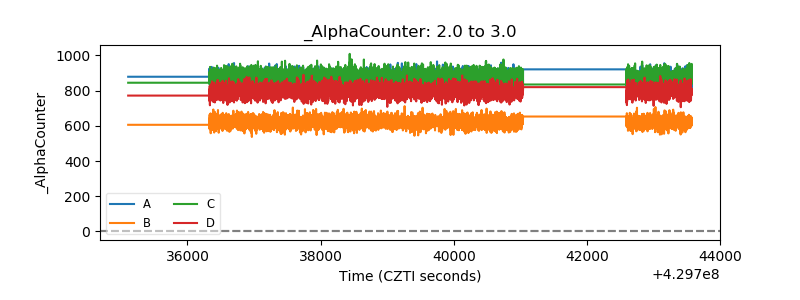 |
| _CPM_Rate | 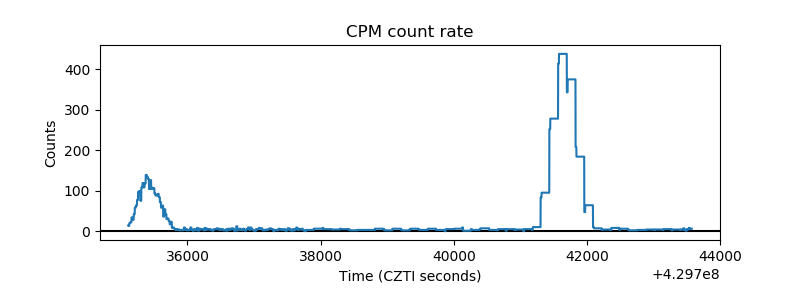 |
| CZT Counter |  |
| +2.5 Volts monitor | 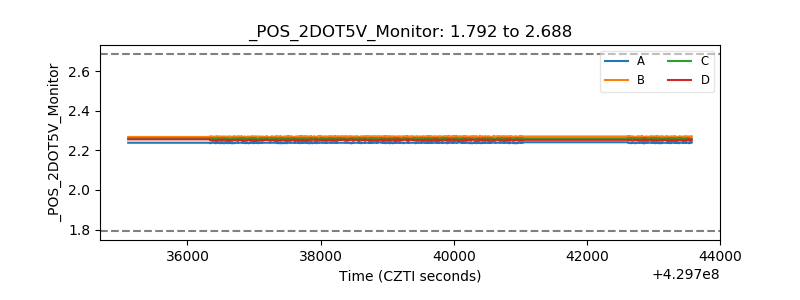 |
| +5 Volts monitor | 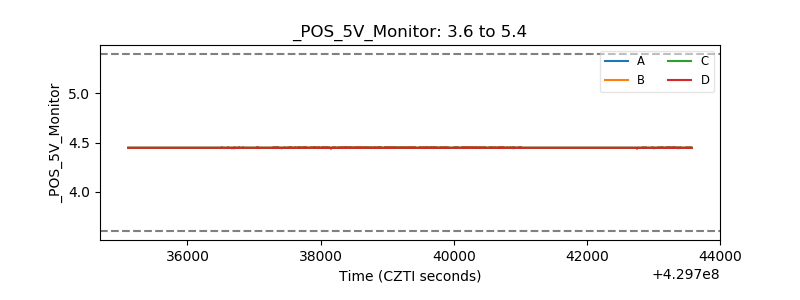 |
| _ROLL_ROT | 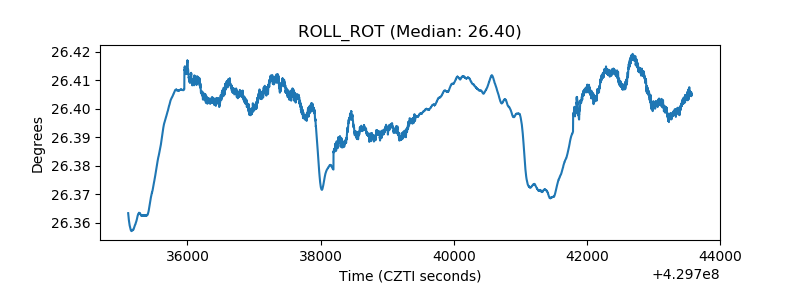 |
| _Roll_DEC | 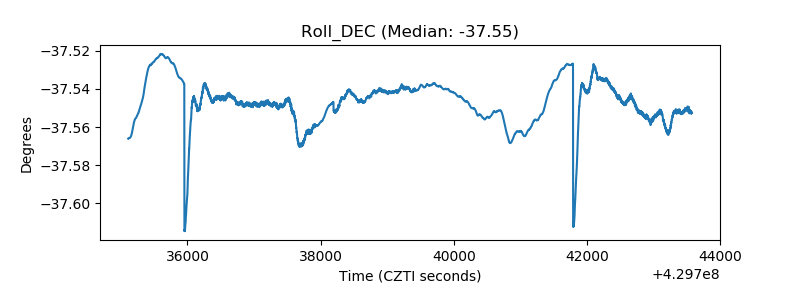 |
| _Roll_RA | 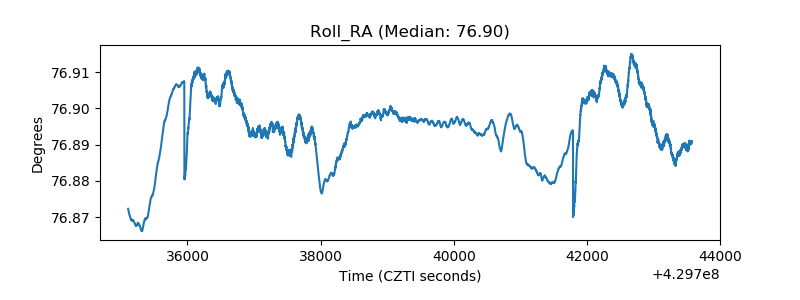 |
| Veto Counter | 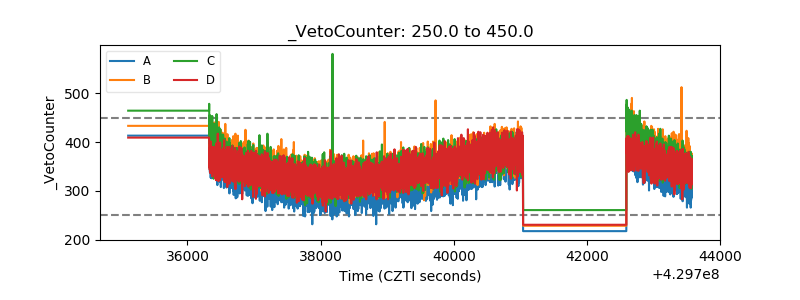 |