| Param | Original file | Final file |
|---|---|---|
| Filename | modeM0/AS1A12_061T07_9000005818_42600cztM0_level2.fits | modeM0/AS1A12_061T07_9000005818_42600cztM0_level2_quad_clean.evt |
| Size (bytes) | 309,127,680 | 90,002,880 |
| Size | 294.8 MB | 85.8 MB |
| Events in quadrant A | 2,887,689 | 602,692 |
| Events in quadrant B | 2,493,055 | 616,018 |
| Events in quadrant C | 2,836,040 | 585,840 |
| Events in quadrant D | 2,801,695 | 539,382 |
| Mode M0 | |||
|---|---|---|---|
| Quadrant | BADHDUFLAG | Total packets | Discarded packets |
| A | 0 | 11921 | 2 |
| B | 0 | 11257 | 2 |
| C | 0 | 11743 | 2 |
| D | 0 | 12253 | 2 |
| Mode SS | |||
|---|---|---|---|
| Quadrant | BADHDUFLAG | Total packets | Discarded packets |
| A | 0 | 112 | 0 |
| B | 0 | 112 | 0 |
| C | 0 | 112 | 0 |
| D | 0 | 112 | 0 |
| Mode M9 | |||
|---|---|---|---|
| Quadrant | BADHDUFLAG | Total packets | Discarded packets |
| A | 0 | 23 | 0 |
| B | 0 | 24 | 0 |
| C | 0 | 24 | 0 |
| D | 0 | 24 | 0 |
| Quadrant | Total seconds | Saturated seconds | Saturation percentage |
|---|---|---|---|
| A | 5445 | 15 | 0.275482% |
| B | 5445 | 38 | 0.697888% |
| C | 5445 | 13 | 0.238751% |
| D | 5445 | 40 | 0.734619% |
Noise dominated data is calculated using 1-second bins in cleaned event files. If a bin has >2000 counts, and if more than 50% of those come from <1% of pixels, then it is considered to be noise-dominated and hence unusable.
| Quadrant | # 1 sec bins | Bins with >0 counts | Bins with >2000 counts | High rate bins dominated by noise | Noise dominated (total time) | Noise dominated (detector-on time) | Marked lightcurve |
|---|---|---|---|---|---|---|---|
| A | 7148 | 5446 | 3 | 3 | 0.04% | 0.06% | 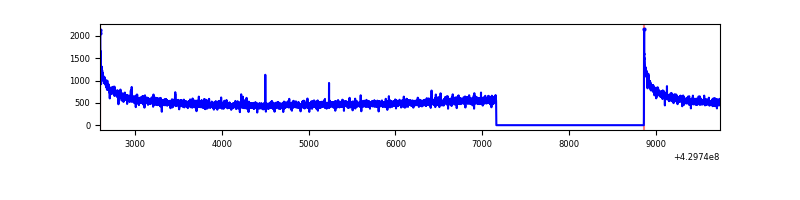 |
| B | 7148 | 5446 | 18 | 18 | 0.25% | 0.33% | 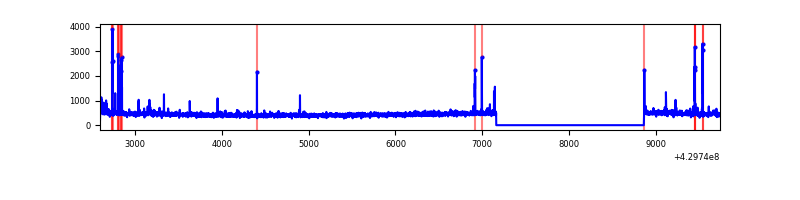 |
| C | 7148 | 5446 | 5 | 5 | 0.07% | 0.09% | 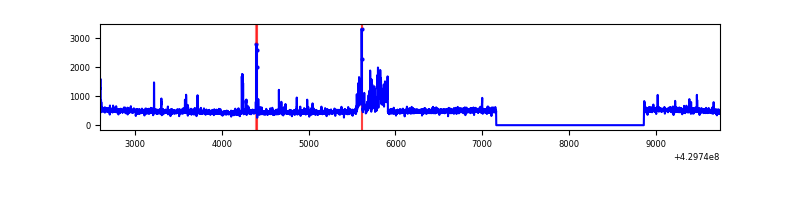 |
| D | 7148 | 5446 | 29 | 29 | 0.41% | 0.53% | 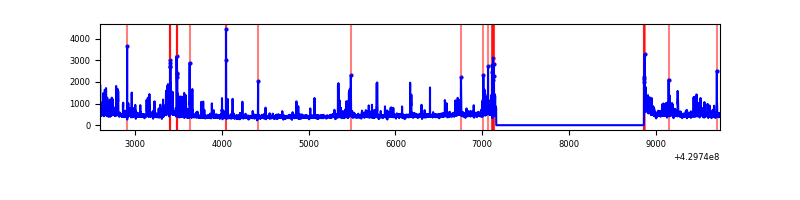 |
Top three noisy pixels from each quadrant. If the there are fewer than three noisy pixels in the level2.evt file, extra rows are filled as -1
| Pixel properties | Quadrant properties | ||||||
|---|---|---|---|---|---|---|---|
| Quadrant | DetID | PixID | Counts | Sigma | Mean | Median | Sigma |
| A | 10 | 83 | 556823 | 4484.48 | 599 | 587 | 124.0 |
| A | 13 | 6 | 8340 | 62.51 | 599 | 587 | 124.0 |
| A | 3 | 137 | 6711 | 49.37 | 599 | 587 | 124.0 |
| B | 5 | 255 | 81865 | 699.35 | 596 | 580 | 116.2 |
| B | 0 | 245 | 36554 | 309.51 | 596 | 580 | 116.2 |
| B | 4 | 141 | 15928 | 132.05 | 596 | 580 | 116.2 |
| C | 15 | 214 | 241941 | 1765.24 | 587 | 592 | 136.7 |
| C | 7 | 220 | 175142 | 1276.67 | 587 | 592 | 136.7 |
| C | 9 | 54 | 57256 | 414.44 | 587 | 592 | 136.7 |
| D | 1 | 52 | 337718 | 2324.03 | 585 | 567 | 145.1 |
| D | 13 | 249 | 76583 | 523.99 | 585 | 567 | 145.1 |
| D | 1 | 47 | 34038 | 230.72 | 585 | 567 | 145.1 |
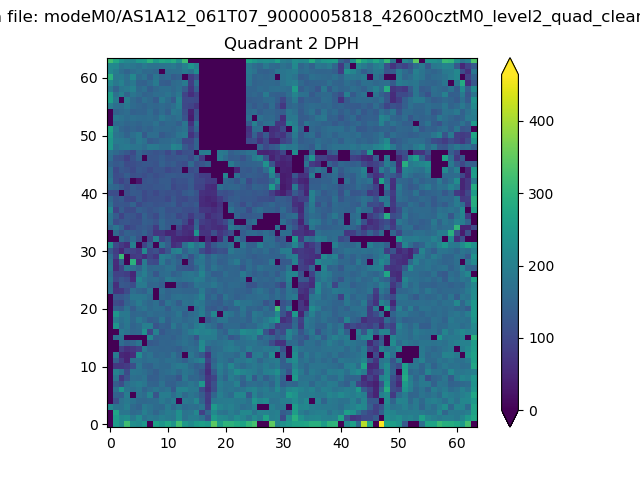
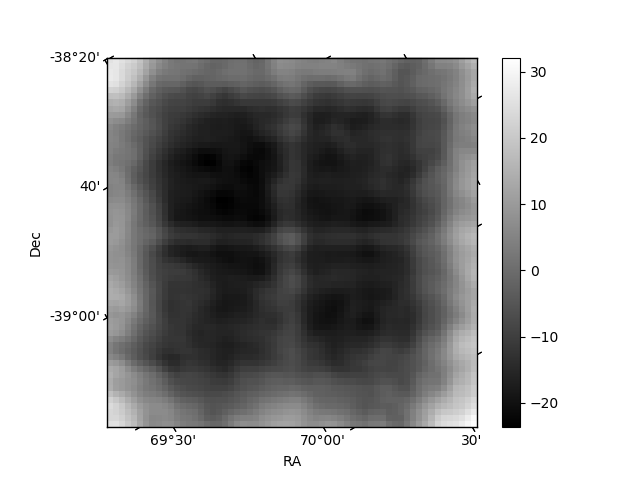
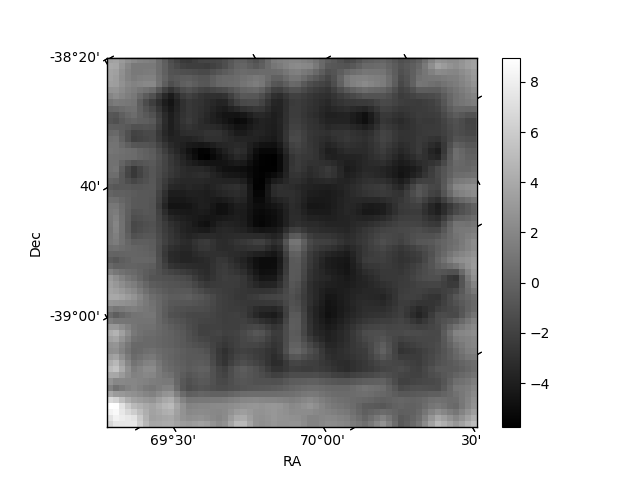
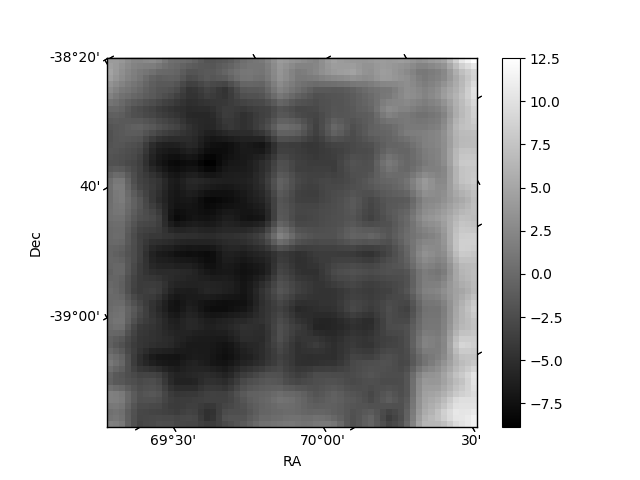
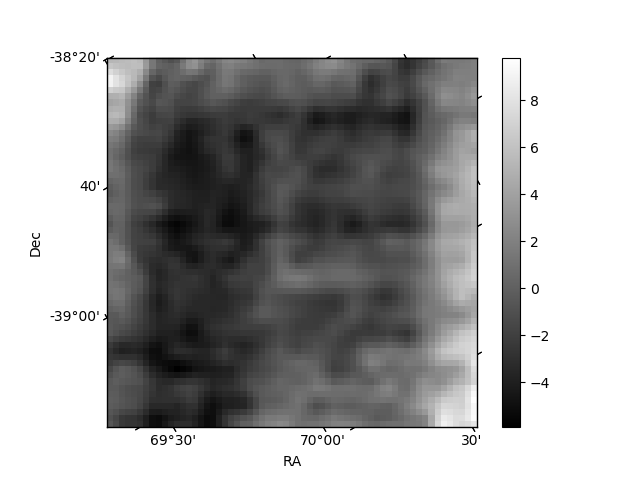
Histogram calculated using DETX and DETY for each event in the final _common_clean file
| Quadrant A | 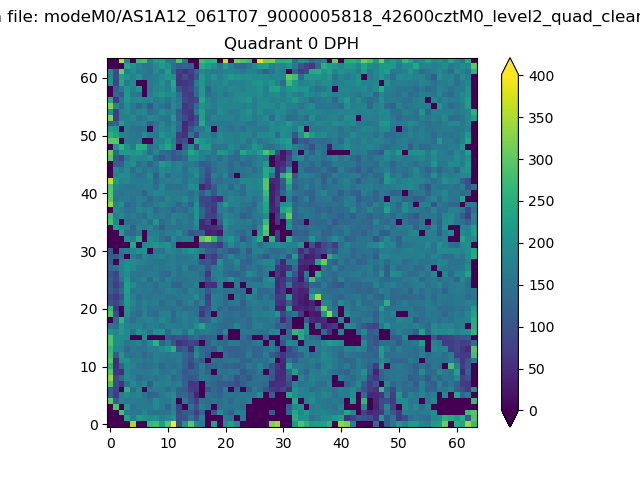 |
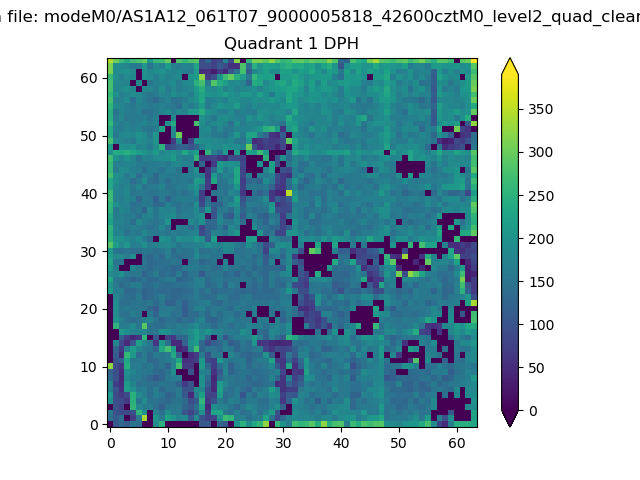 |
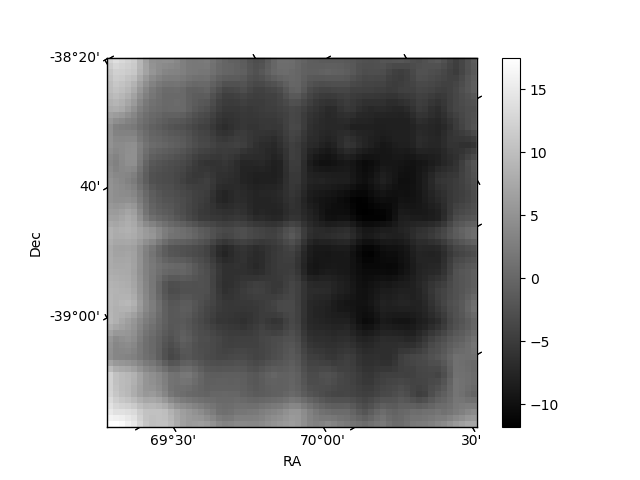
Quadrant B |
|---|---|---|---|
| Quadrant D | 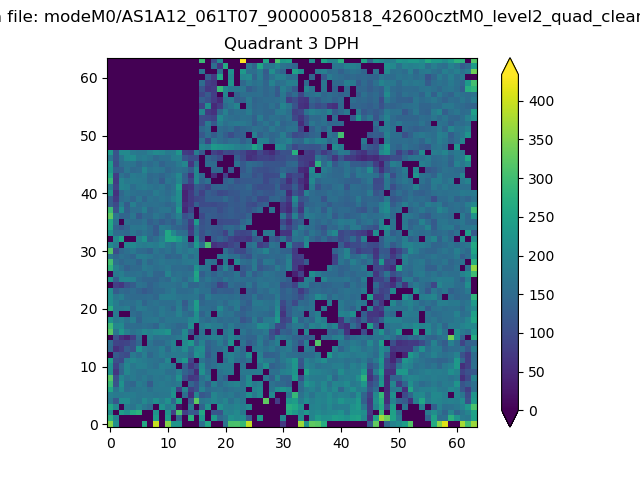 |
 |
Quadrant C |
| Plot type | Count rate plots | Images |
|---|---|---|
| Comparison with Poisson distribution Blue bars denote a histogram of data divided into 1 sec bins. Red curve is a Poisson curve with rate = median count rate of data. |
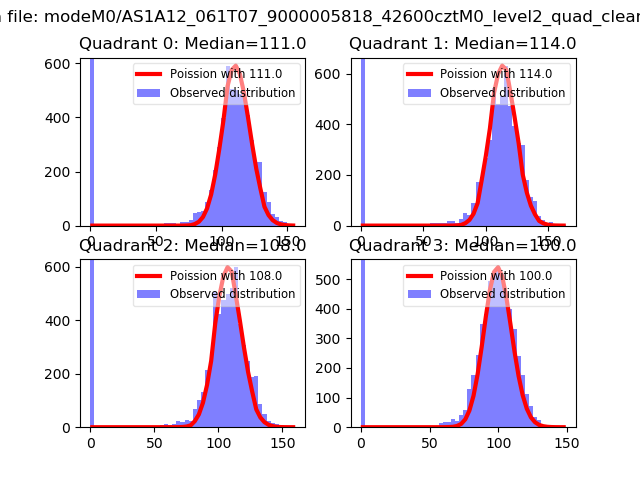 |
 |
| Quadrant-wise count rates Data is divided into 100 sec bins |
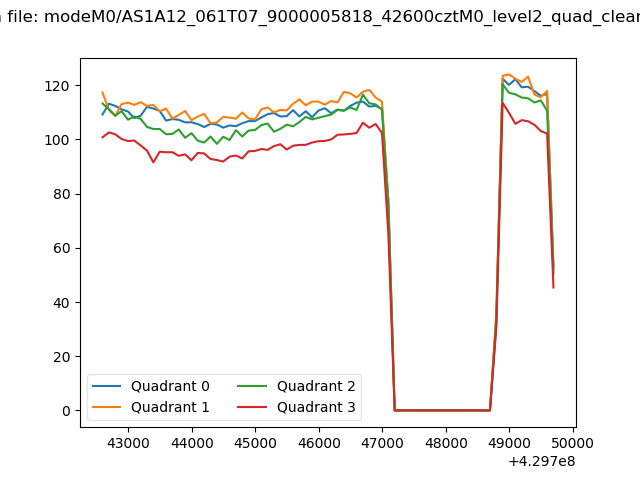 |
|
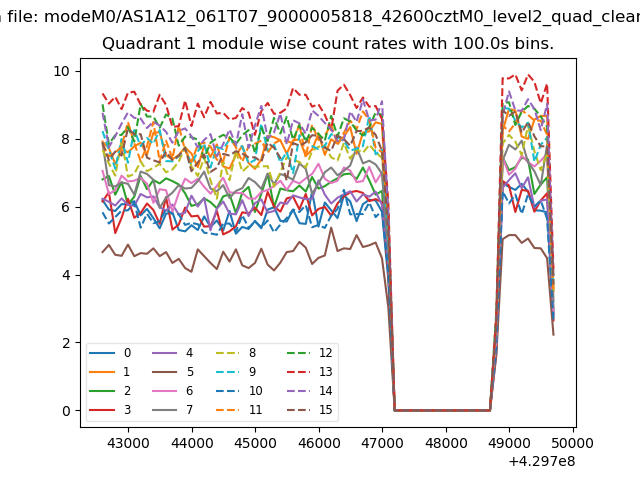
| Module-wise count rates for Quadrant A Data is divided into 100 sec bins |
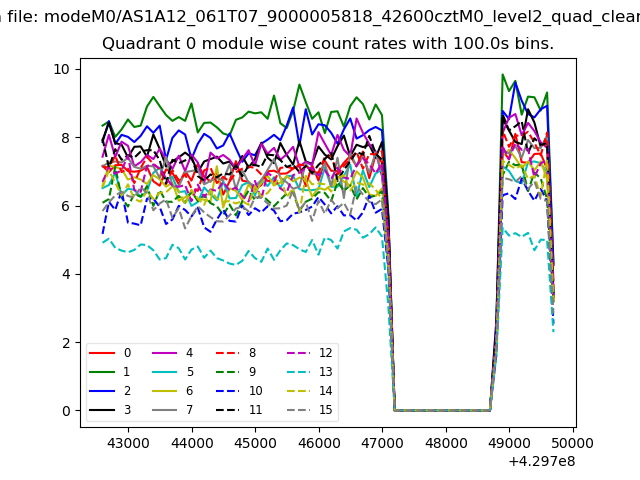 |
 |
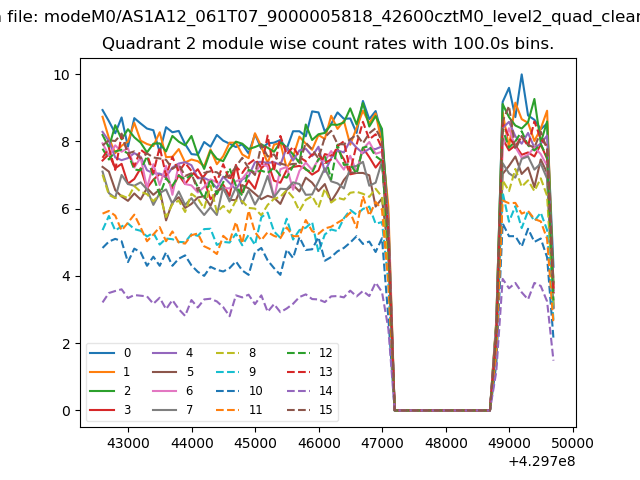
| Module-wise count rates for Quadrant B Data is divided into 100 sec bins |
 |
 |
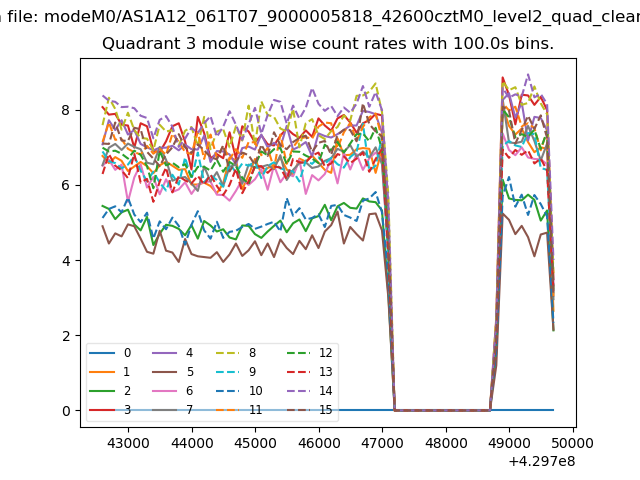
| Module-wise count rates for Quadrant C Data is divided into 100 sec bins |
 |
 |
| Module-wise count rates for Quadrant D Data is divided into 100 sec bins |
 |
 |
| Parameter | Plot |
|---|---|
| CZT HV Monitor | 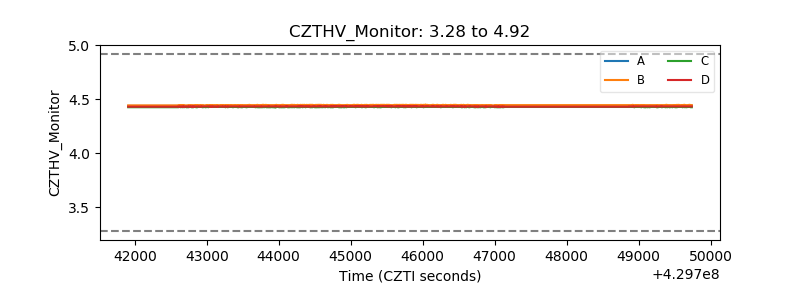 |
| D_VDD | 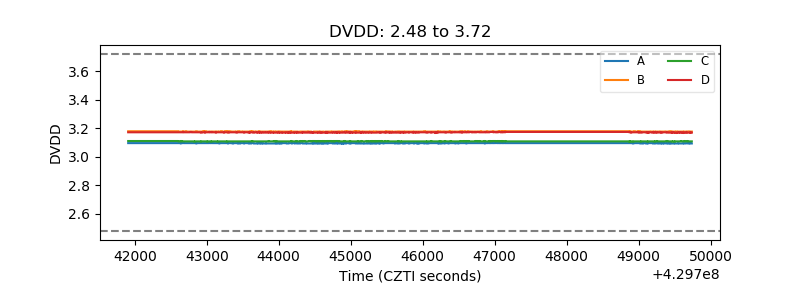 |
| Temperature 1 | 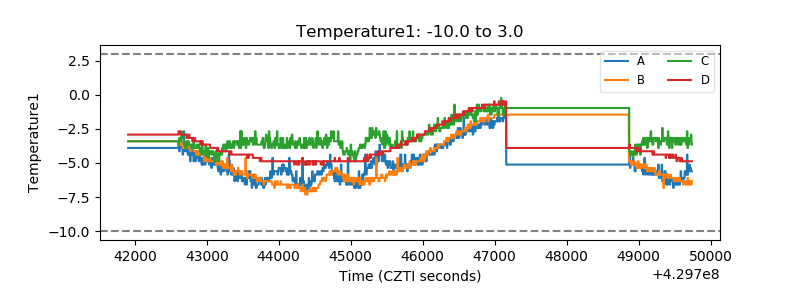 |
| Veto HV Monitor | 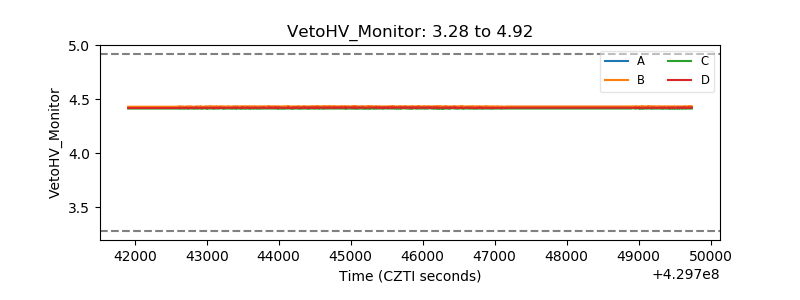 |
| Veto LLD | 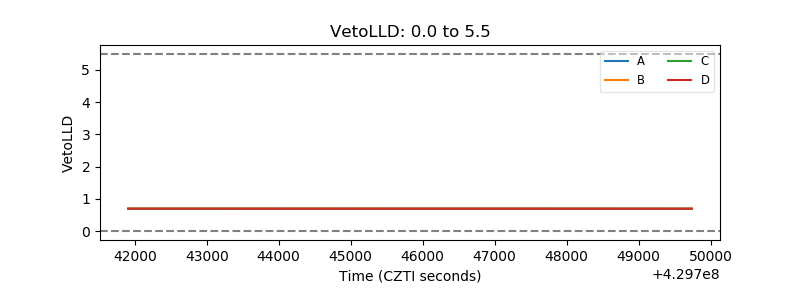 |
| Alpha Counter | 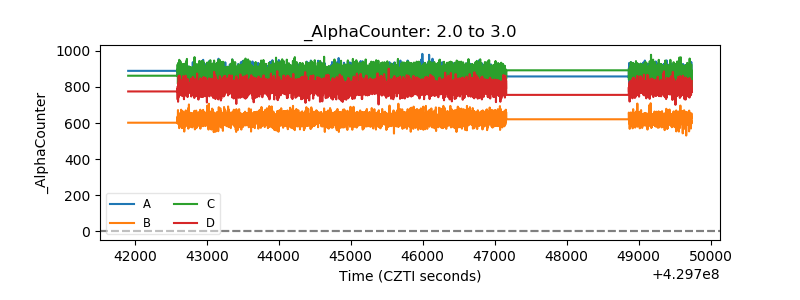 |
| _CPM_Rate | 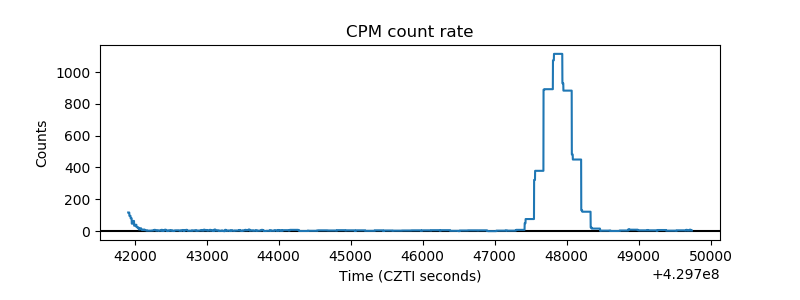 |
| CZT Counter | 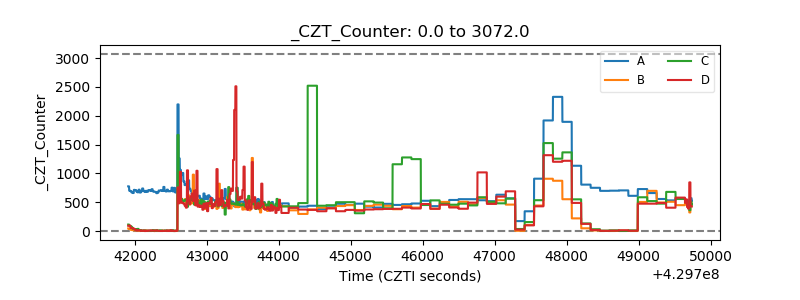 |
| +2.5 Volts monitor | 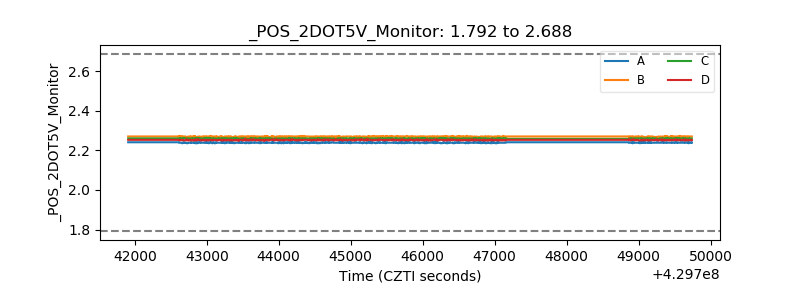 |
| +5 Volts monitor | 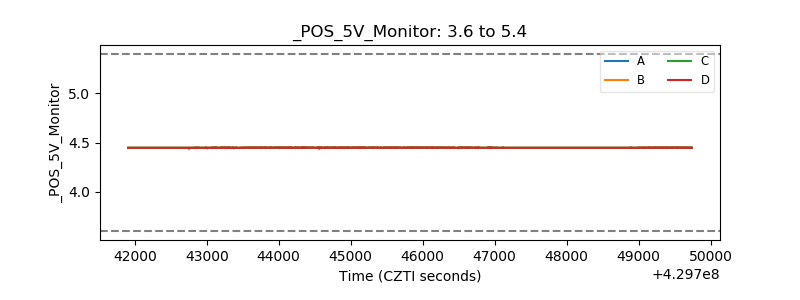 |
| _ROLL_ROT | 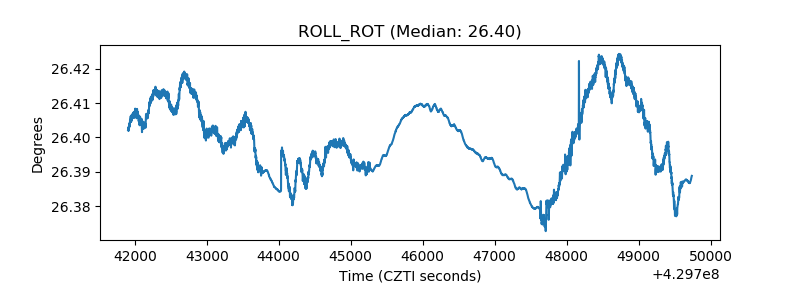 |
| _Roll_DEC | 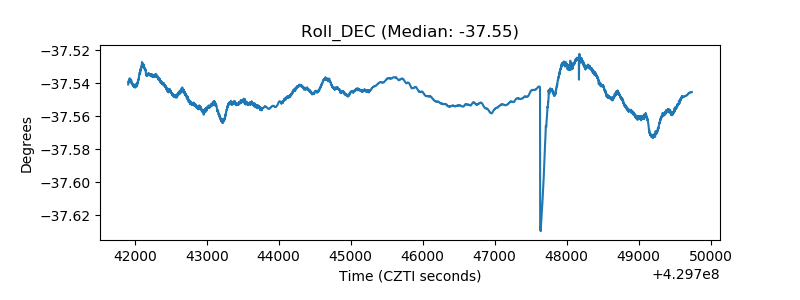 |
| _Roll_RA | 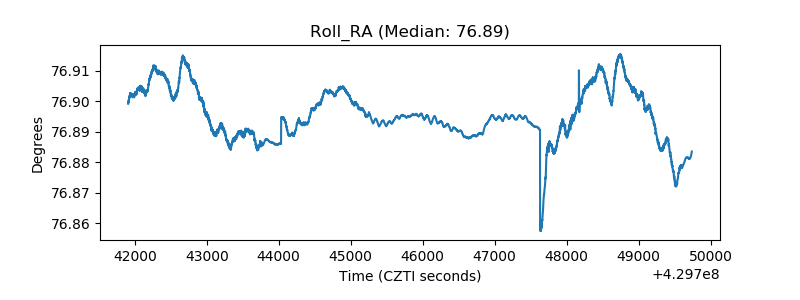 |
| Veto Counter | 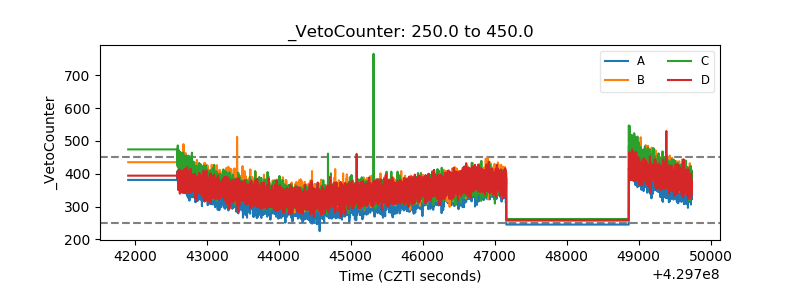 |