| Param | Original file | Final file |
|---|---|---|
| Filename | modeM0/AS1A12_061T07_9000005818_42603cztM0_level2.fits | modeM0/AS1A12_061T07_9000005818_42603cztM0_level2_quad_clean.evt |
| Size (bytes) | 313,395,840 | 91,385,280 |
| Size | 298.9 MB | 87.2 MB |
| Events in quadrant A | 2,851,713 | 612,220 |
| Events in quadrant B | 2,450,992 | 635,719 |
| Events in quadrant C | 2,714,477 | 608,498 |
| Events in quadrant D | 3,182,710 | 550,140 |
| Mode M0 | |||
|---|---|---|---|
| Quadrant | BADHDUFLAG | Total packets | Discarded packets |
| A | 0 | 11547 | 2 |
| B | 0 | 10766 | 2 |
| C | 0 | 11083 | 2 |
| D | 0 | 12986 | 2 |
| Mode SS | |||
|---|---|---|---|
| Quadrant | BADHDUFLAG | Total packets | Discarded packets |
| A | 0 | 106 | 0 |
| B | 0 | 106 | 0 |
| C | 0 | 106 | 0 |
| D | 0 | 106 | 0 |
| Mode M9 | |||
|---|---|---|---|
| Quadrant | BADHDUFLAG | Total packets | Discarded packets |
| A | 0 | 28 | 0 |
| B | 0 | 29 | 0 |
| C | 0 | 29 | 0 |
| D | 0 | 29 | 0 |
| Quadrant | Total seconds | Saturated seconds | Saturation percentage |
|---|---|---|---|
| A | 5146 | 14 | 0.272056% |
| B | 5146 | 26 | 0.505247% |
| C | 5146 | 39 | 0.757870% |
| D | 5146 | 121 | 2.351341% |
Noise dominated data is calculated using 1-second bins in cleaned event files. If a bin has >2000 counts, and if more than 50% of those come from <1% of pixels, then it is considered to be noise-dominated and hence unusable.
| Quadrant | # 1 sec bins | Bins with >0 counts | Bins with >2000 counts | High rate bins dominated by noise | Noise dominated (total time) | Noise dominated (detector-on time) | Marked lightcurve |
|---|---|---|---|---|---|---|---|
| A | 7088 | 5147 | 8 | 8 | 0.11% | 0.16% | 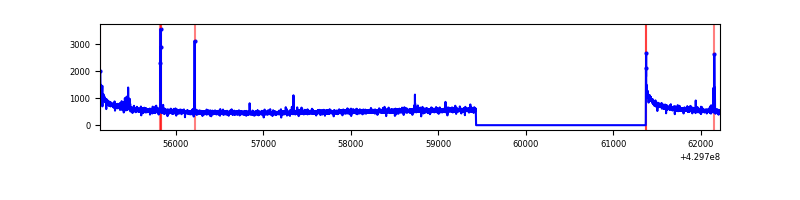 |
| B | 7088 | 5147 | 13 | 13 | 0.18% | 0.25% | 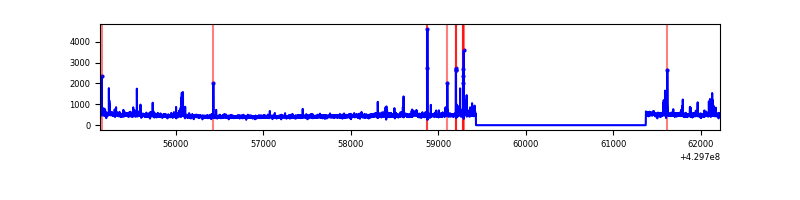 |
| C | 7088 | 5147 | 27 | 27 | 0.38% | 0.52% | 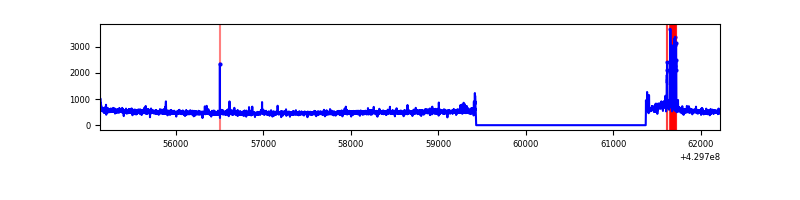 |
| D | 7088 | 5147 | 83 | 83 | 1.17% | 1.61% | 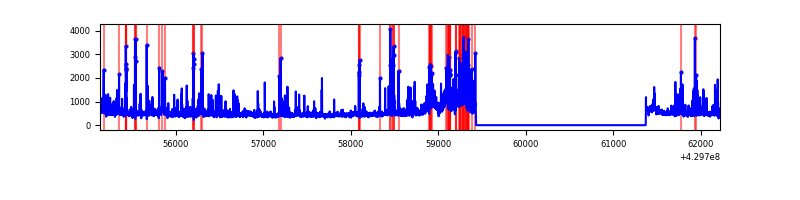 |
Top three noisy pixels from each quadrant. If the there are fewer than three noisy pixels in the level2.evt file, extra rows are filled as -1
| Pixel properties | Quadrant properties | ||||||
|---|---|---|---|---|---|---|---|
| Quadrant | DetID | PixID | Counts | Sigma | Mean | Median | Sigma |
| A | 10 | 83 | 535645 | 4458.58 | 585 | 572 | 120.0 |
| A | 15 | 237 | 30348 | 248.11 | 585 | 572 | 120.0 |
| A | 13 | 248 | 10649 | 83.97 | 585 | 572 | 120.0 |
| B | 5 | 255 | 65899 | 586.72 | 584 | 567 | 111.4 |
| B | 0 | 245 | 40041 | 354.5 | 584 | 567 | 111.4 |
| B | 15 | 85 | 17535 | 152.38 | 584 | 567 | 111.4 |
| C | 15 | 214 | 229796 | 1692.4 | 584 | 588 | 135.4 |
| C | 0 | 239 | 122535 | 900.42 | 584 | 588 | 135.4 |
| C | 14 | 254 | 30966 | 224.3 | 584 | 588 | 135.4 |
| D | 1 | 52 | 410042 | 2919.77 | 578 | 562 | 140.2 |
| D | 2 | 249 | 217901 | 1549.72 | 578 | 562 | 140.2 |
| D | 2 | 16 | 135150 | 959.67 | 578 | 562 | 140.2 |
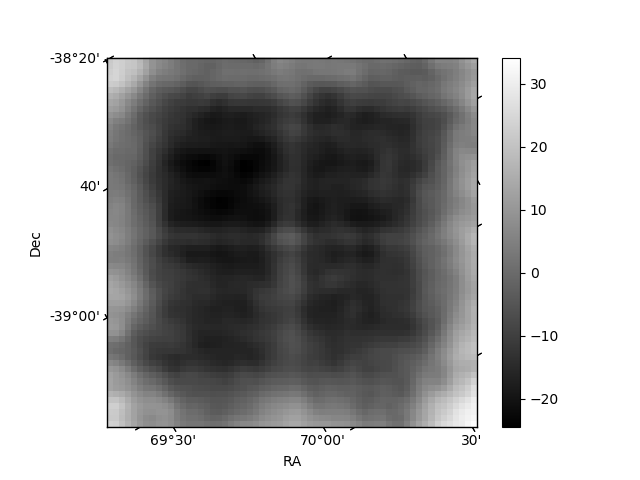
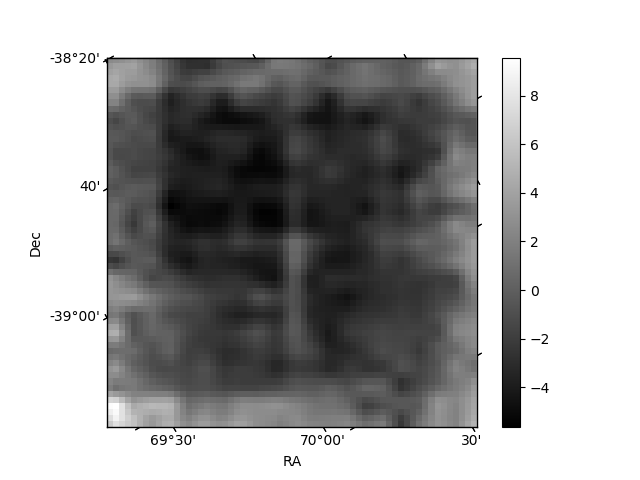
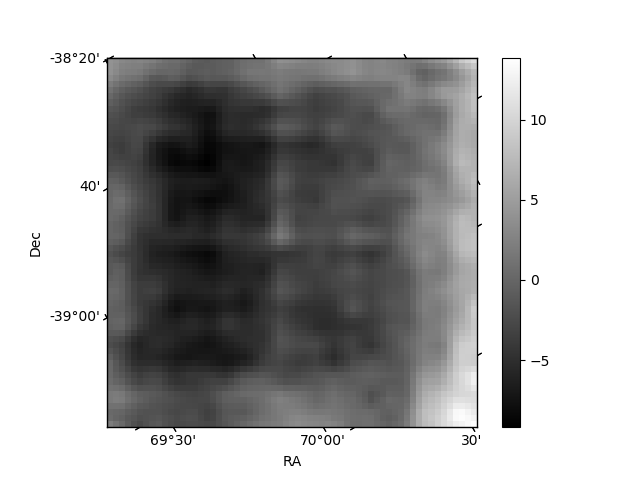
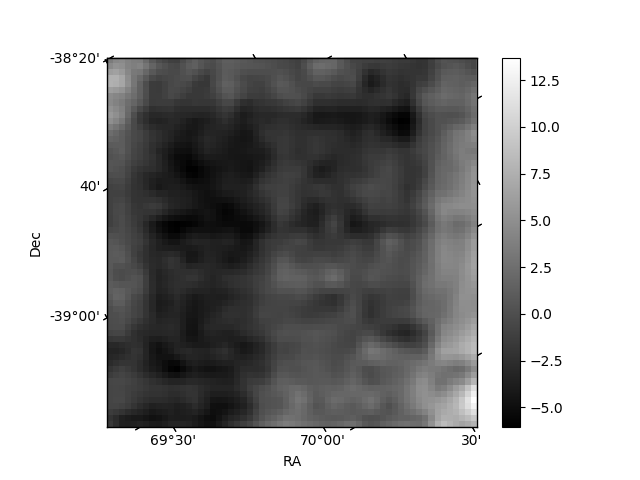
Histogram calculated using DETX and DETY for each event in the final _common_clean file
| Quadrant A | 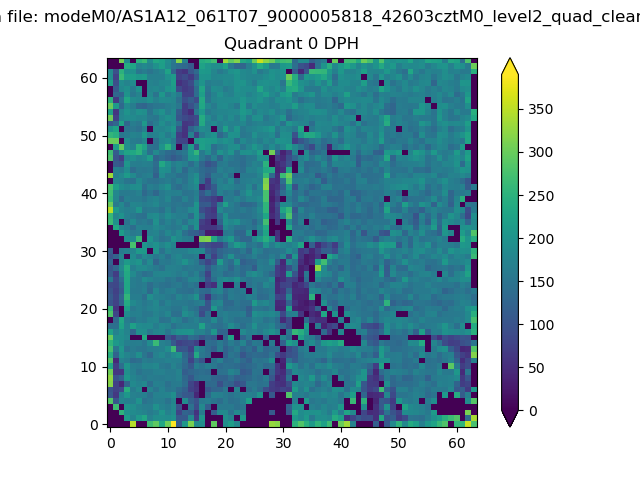 |
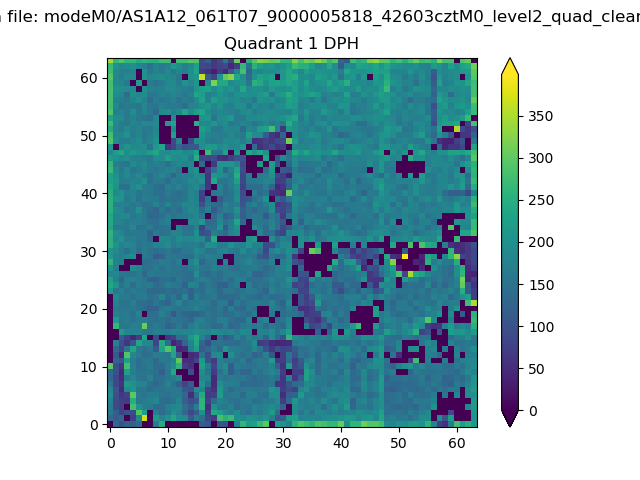 |
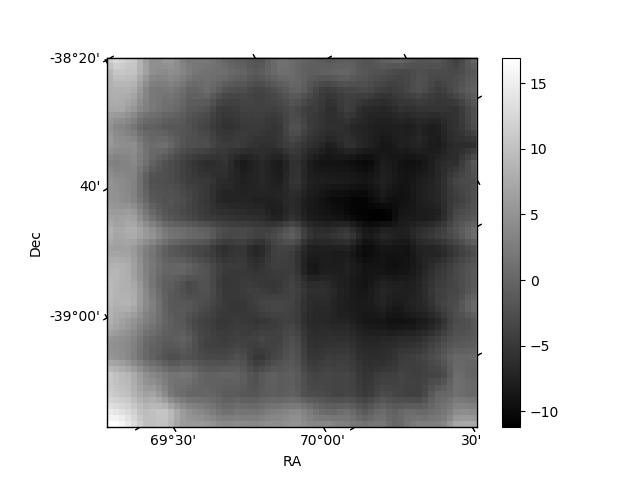
Quadrant B |
|---|---|---|---|
| Quadrant D | 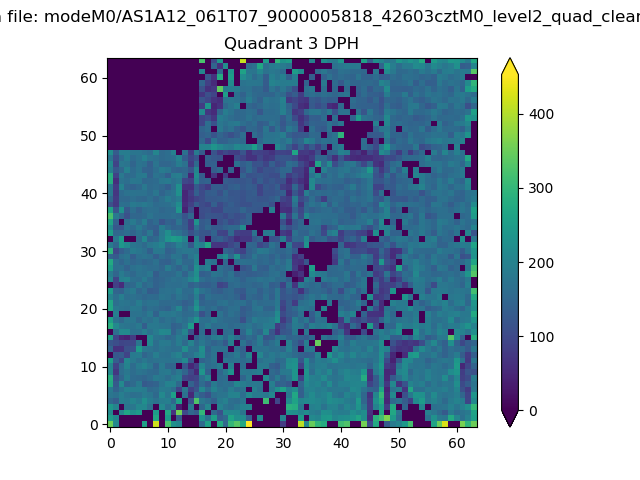 |
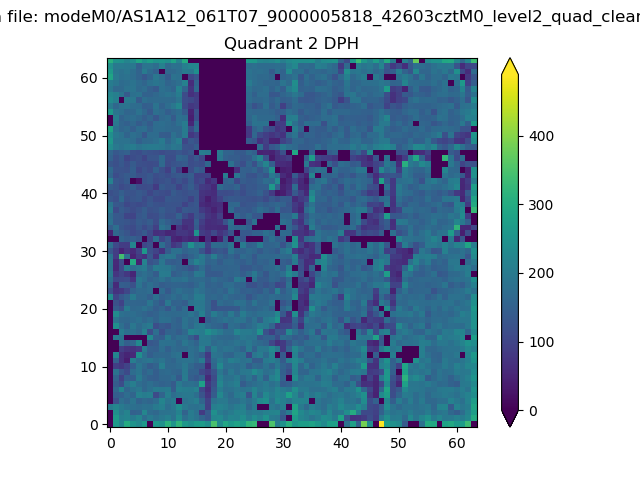 |
Quadrant C |
| Plot type | Count rate plots | Images |
|---|---|---|
| Comparison with Poisson distribution Blue bars denote a histogram of data divided into 1 sec bins. Red curve is a Poisson curve with rate = median count rate of data. |
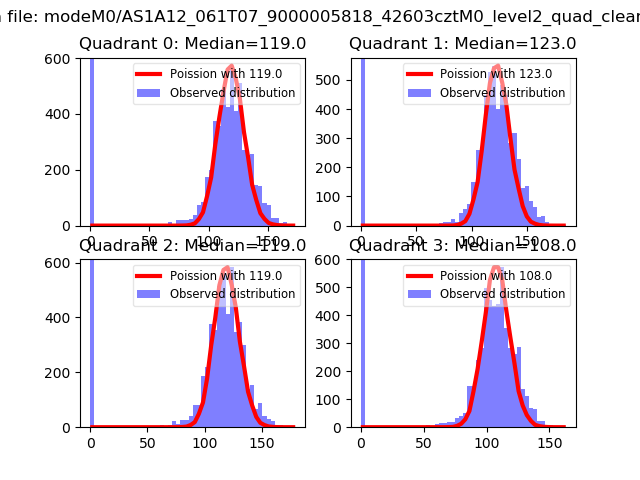 |
 |
| Quadrant-wise count rates Data is divided into 100 sec bins |
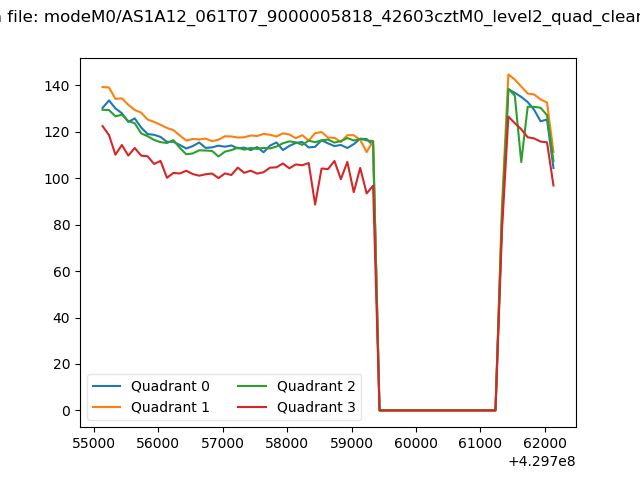 |
|
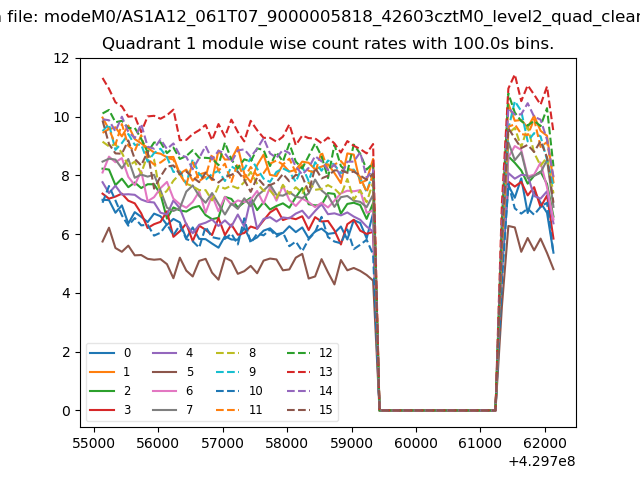
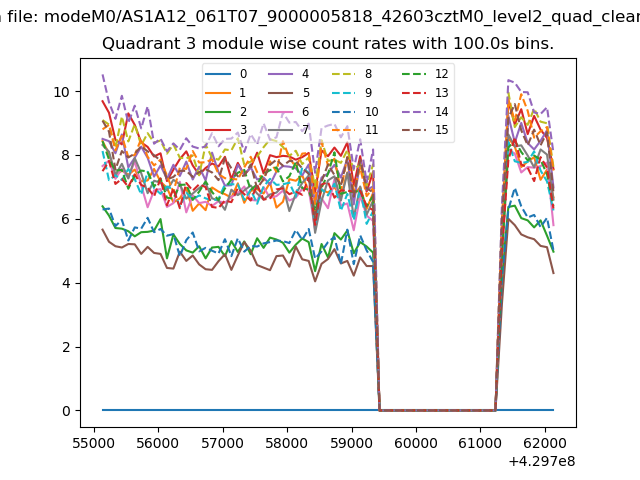
| Module-wise count rates for Quadrant A Data is divided into 100 sec bins |
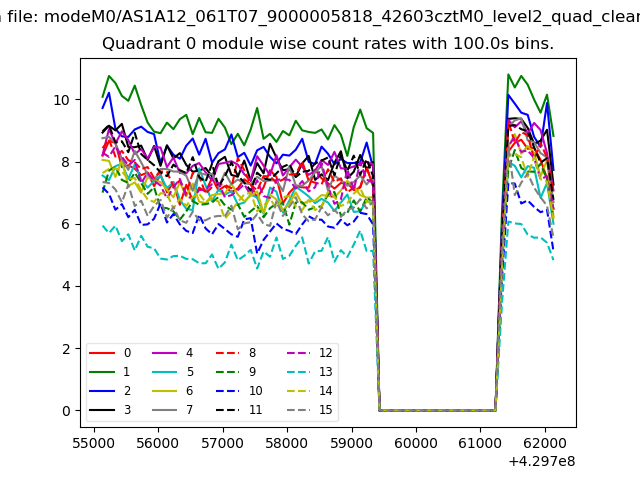 |
 |
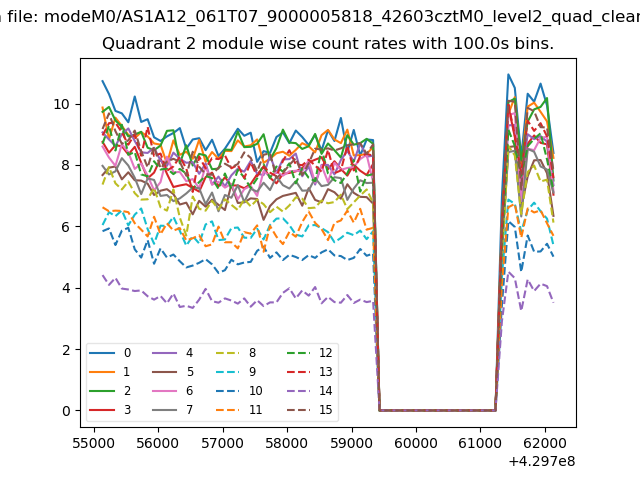
| Module-wise count rates for Quadrant B Data is divided into 100 sec bins |
 |
 |
| Module-wise count rates for Quadrant C Data is divided into 100 sec bins |
 |
 |
| Module-wise count rates for Quadrant D Data is divided into 100 sec bins |
 |
 |
| Parameter | Plot |
|---|---|
| CZT HV Monitor | 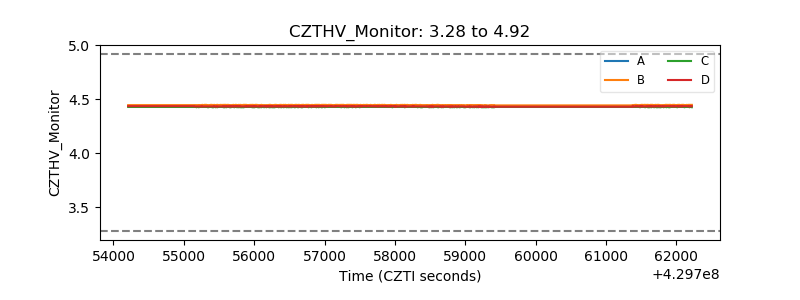 |
| D_VDD | 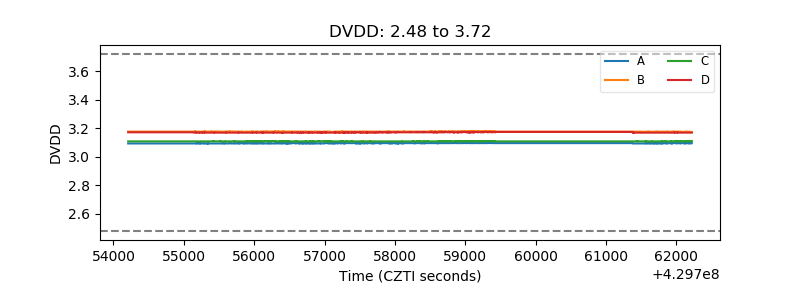 |
| Temperature 1 | 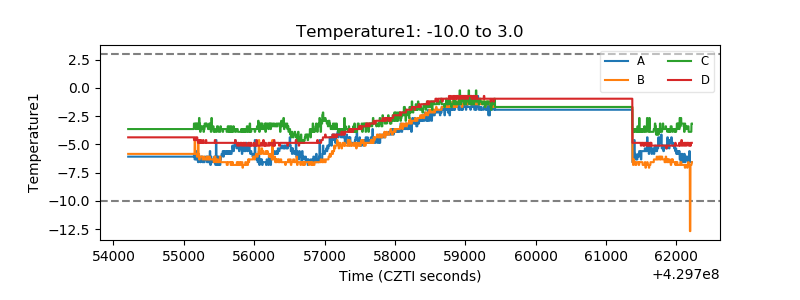 |
| Veto HV Monitor | 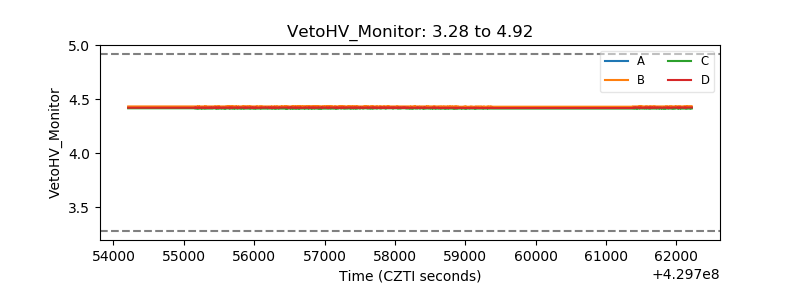 |
| Veto LLD | 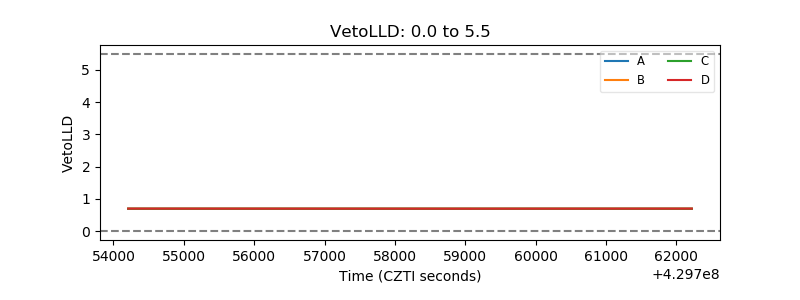 |
| Alpha Counter | 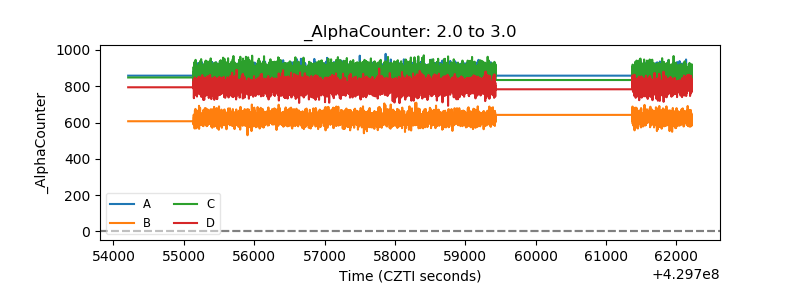 |
| _CPM_Rate | 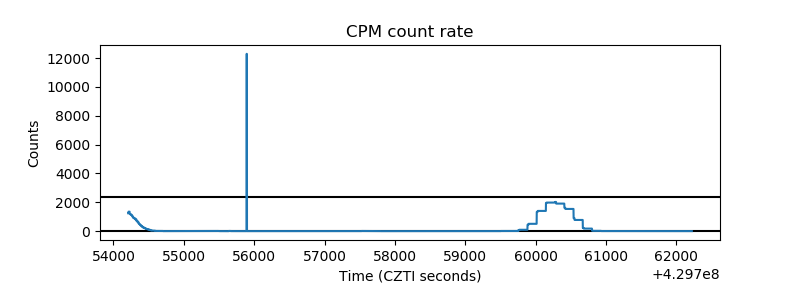 |
| CZT Counter | 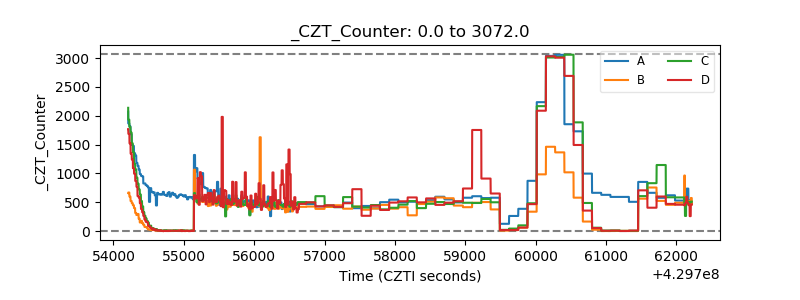 |
| +2.5 Volts monitor | 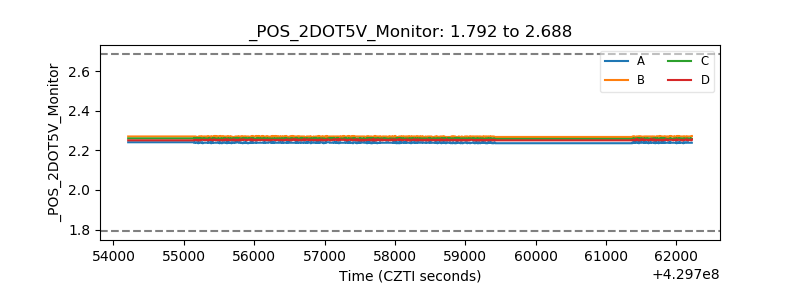 |
| +5 Volts monitor | 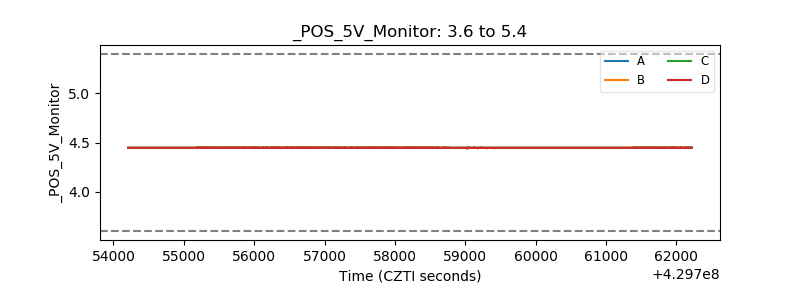 |
| _ROLL_ROT | 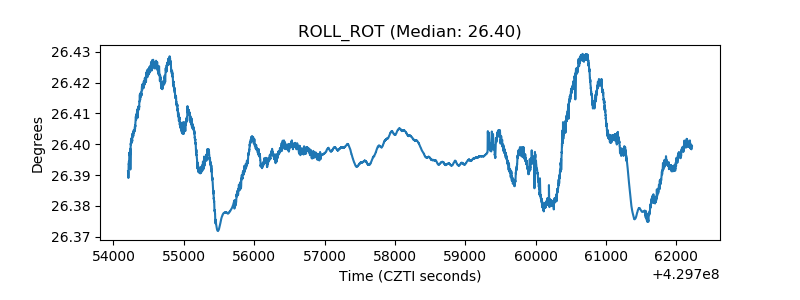 |
| _Roll_DEC | 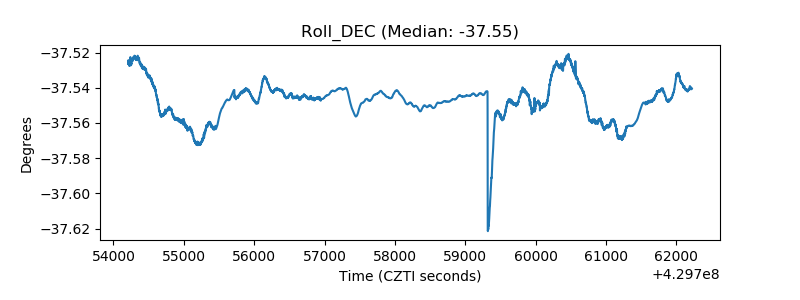 |
| _Roll_RA | 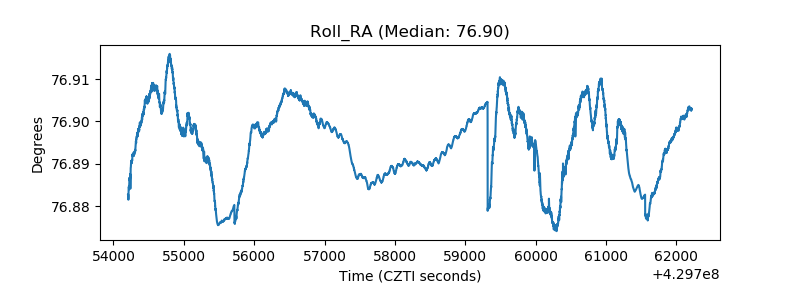 |
| Veto Counter | 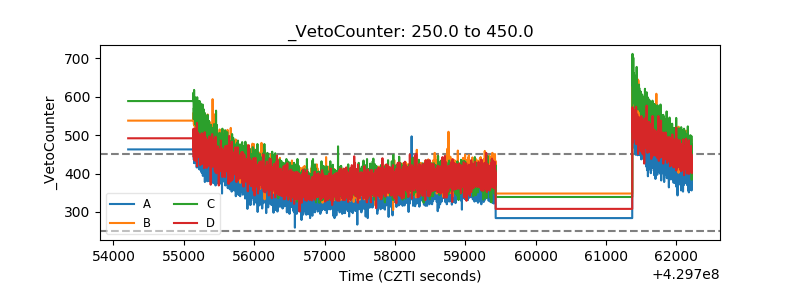 |