| Param | Original file | Final file |
|---|---|---|
| Filename | modeM0/AS1A12_061T07_9000005818_42604cztM0_level2.fits | modeM0/AS1A12_061T07_9000005818_42604cztM0_level2_quad_clean.evt |
| Size (bytes) | 316,941,120 | 92,329,920 |
| Size | 302.3 MB | 88.1 MB |
| Events in quadrant A | 2,832,577 | 618,151 |
| Events in quadrant B | 2,424,119 | 641,746 |
| Events in quadrant C | 2,711,912 | 620,576 |
| Events in quadrant D | 3,367,879 | 559,631 |
| Mode M0 | |||
|---|---|---|---|
| Quadrant | BADHDUFLAG | Total packets | Discarded packets |
| A | 0 | 11431 | 2 |
| B | 0 | 10490 | 2 |
| C | 0 | 10951 | 2 |
| D | 0 | 13430 | 2 |
| Mode SS | |||
|---|---|---|---|
| Quadrant | BADHDUFLAG | Total packets | Discarded packets |
| A | 0 | 104 | 0 |
| B | 0 | 104 | 0 |
| C | 0 | 104 | 0 |
| D | 0 | 104 | 0 |
| Mode M9 | |||
|---|---|---|---|
| Quadrant | BADHDUFLAG | Total packets | Discarded packets |
| A | 0 | 27 | 0 |
| B | 0 | 28 | 0 |
| C | 0 | 28 | 0 |
| D | 0 | 28 | 0 |
| Quadrant | Total seconds | Saturated seconds | Saturation percentage |
|---|---|---|---|
| A | 5078 | 17 | 0.334777% |
| B | 5078 | 11 | 0.216621% |
| C | 5077 | 39 | 0.768170% |
| D | 5077 | 120 | 2.363601% |
Noise dominated data is calculated using 1-second bins in cleaned event files. If a bin has >2000 counts, and if more than 50% of those come from <1% of pixels, then it is considered to be noise-dominated and hence unusable.
| Quadrant | # 1 sec bins | Bins with >0 counts | Bins with >2000 counts | High rate bins dominated by noise | Noise dominated (total time) | Noise dominated (detector-on time) | Marked lightcurve |
|---|---|---|---|---|---|---|---|
| A | 7110 | 5079 | 8 | 8 | 0.11% | 0.16% | 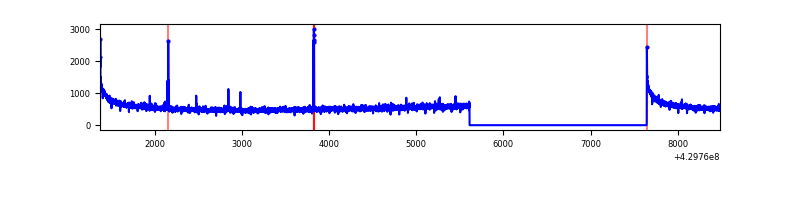 |
| B | 7110 | 5079 | 5 | 5 | 0.07% | 0.10% | 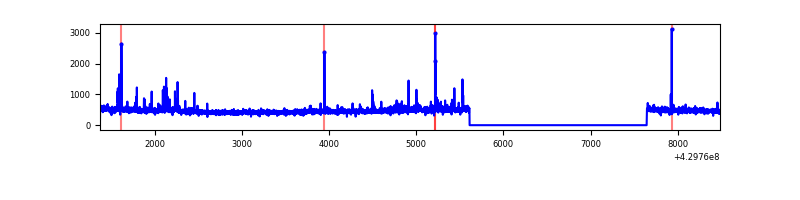 |
| C | 7109 | 5078 | 26 | 26 | 0.37% | 0.51% | 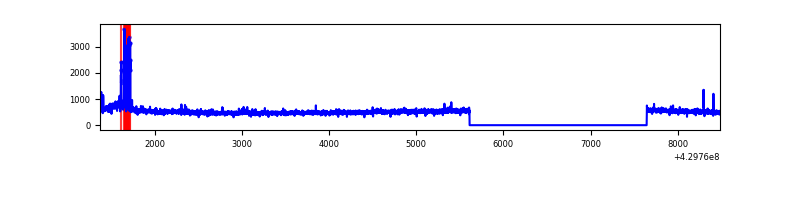 |
| D | 7109 | 5078 | 110 | 110 | 1.55% | 2.17% | 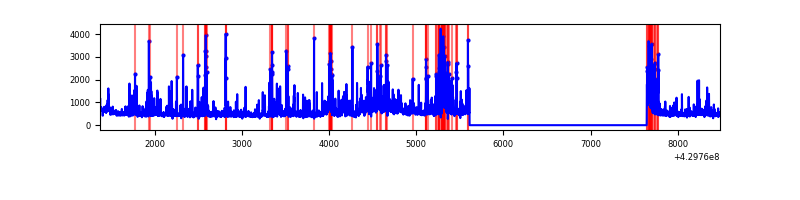 |
Top three noisy pixels from each quadrant. If the there are fewer than three noisy pixels in the level2.evt file, extra rows are filled as -1
| Pixel properties | Quadrant properties | ||||||
|---|---|---|---|---|---|---|---|
| Quadrant | DetID | PixID | Counts | Sigma | Mean | Median | Sigma |
| A | 10 | 83 | 528960 | 4419.08 | 586 | 573 | 119.6 |
| A | 15 | 237 | 31546 | 259.04 | 586 | 573 | 119.6 |
| A | 3 | 137 | 6194 | 47.01 | 586 | 573 | 119.6 |
| B | 0 | 245 | 44359 | 392.4 | 585 | 570 | 111.6 |
| B | 5 | 255 | 29394 | 258.29 | 585 | 570 | 111.6 |
| B | 12 | 111 | 13598 | 116.74 | 585 | 570 | 111.6 |
| C | 15 | 214 | 227373 | 1678.62 | 587 | 593 | 135.1 |
| C | 0 | 239 | 110764 | 815.48 | 587 | 593 | 135.1 |
| C | 14 | 254 | 47767 | 349.18 | 587 | 593 | 135.1 |
| D | 1 | 52 | 577810 | 4118.26 | 580 | 565 | 140.2 |
| D | 13 | 249 | 197154 | 1402.53 | 580 | 565 | 140.2 |
| D | 2 | 249 | 179305 | 1275.19 | 580 | 565 | 140.2 |
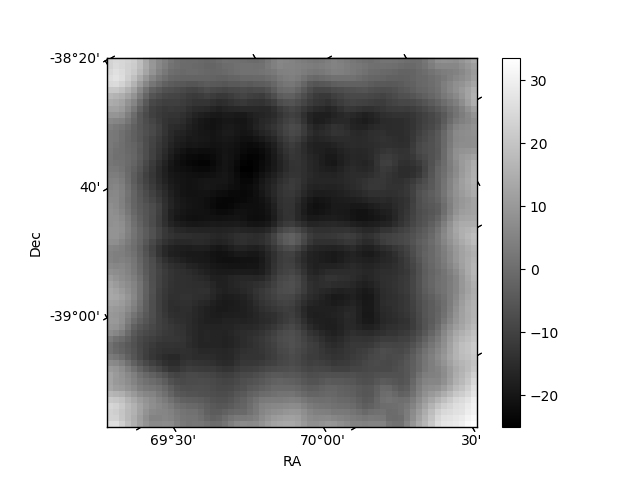
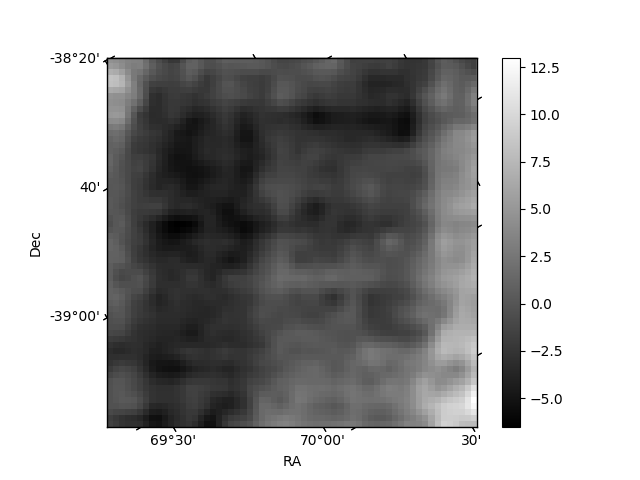
Histogram calculated using DETX and DETY for each event in the final _common_clean file
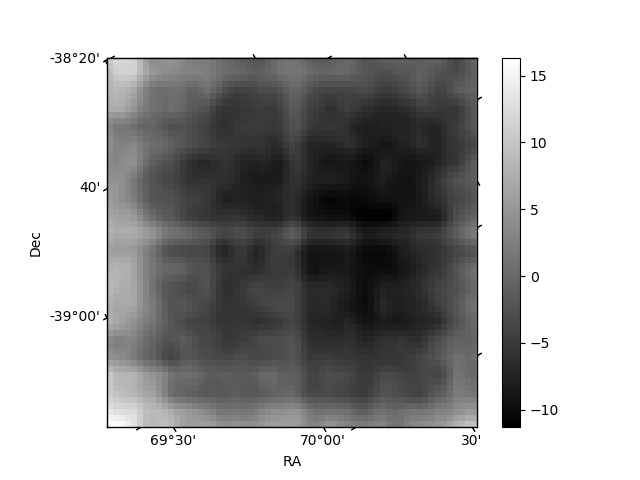
| Quadrant A | 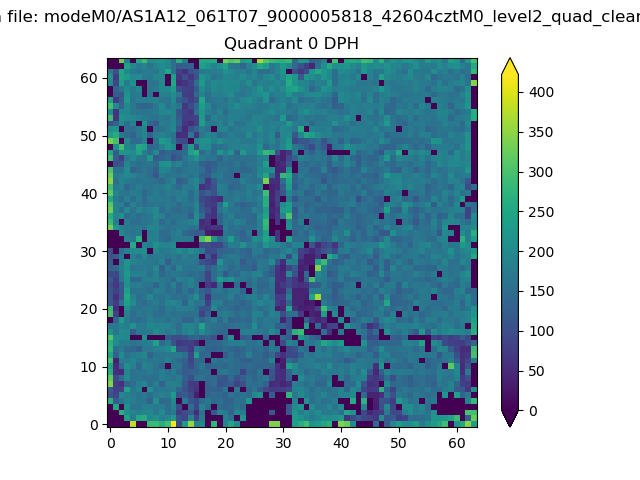 |
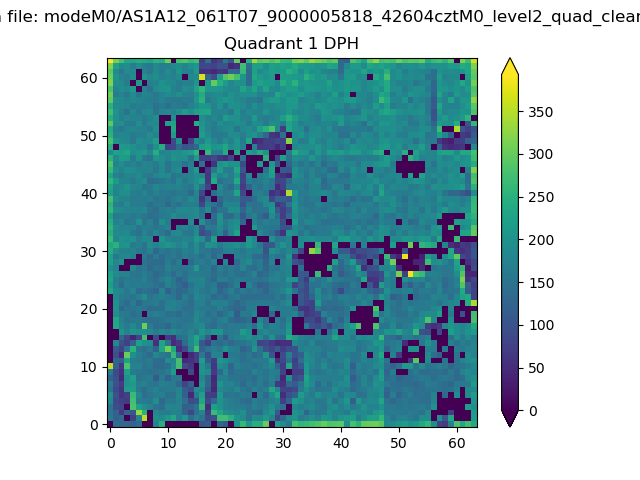 |
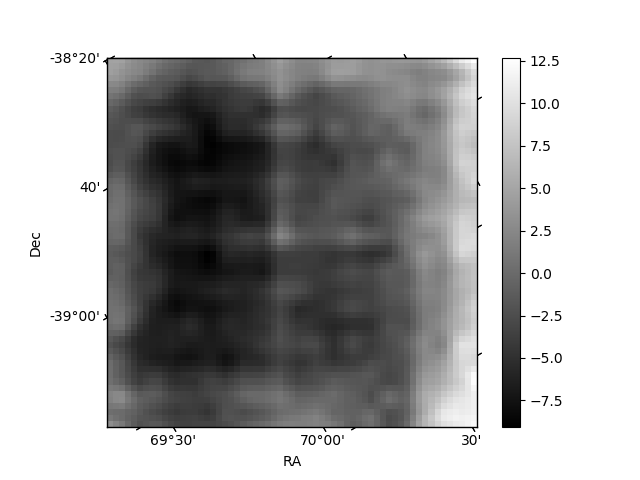
Quadrant B |
|---|---|---|---|
| Quadrant D | 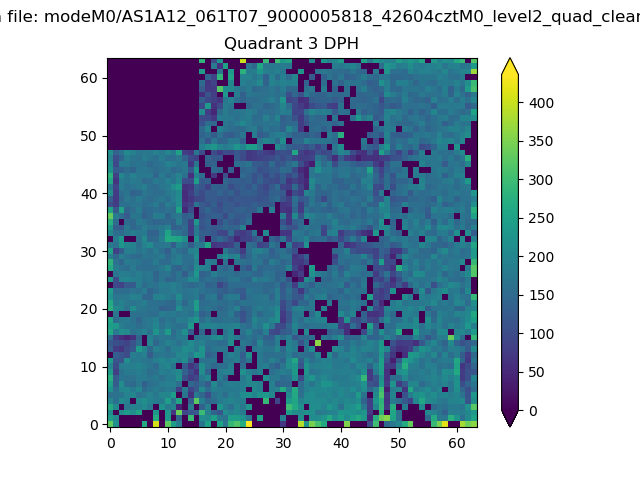 |
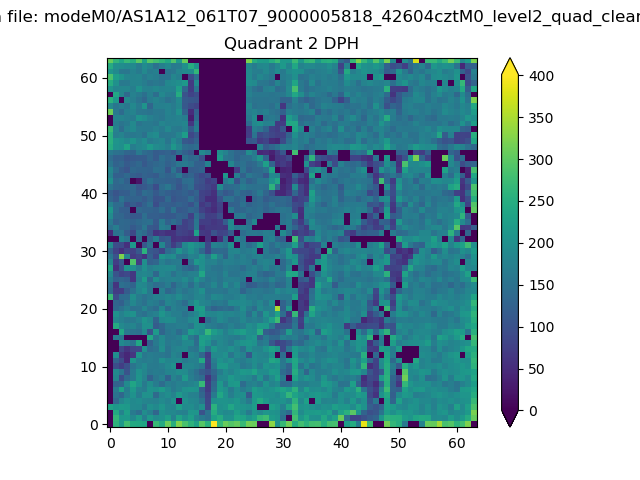 |
Quadrant C |
| Plot type | Count rate plots | Images |
|---|---|---|
| Comparison with Poisson distribution Blue bars denote a histogram of data divided into 1 sec bins. Red curve is a Poisson curve with rate = median count rate of data. |
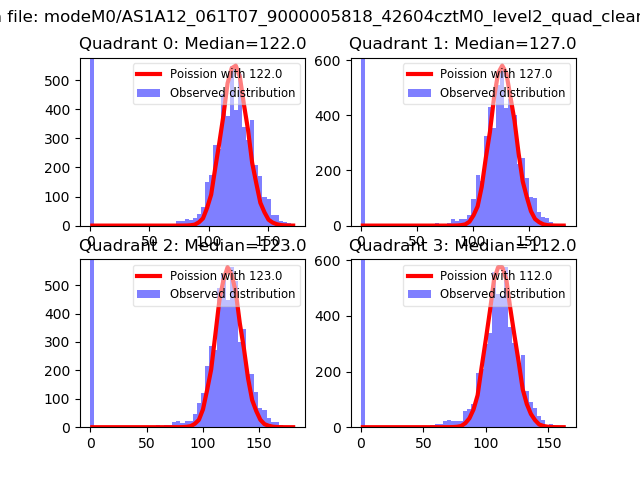 |
 |
| Quadrant-wise count rates Data is divided into 100 sec bins |
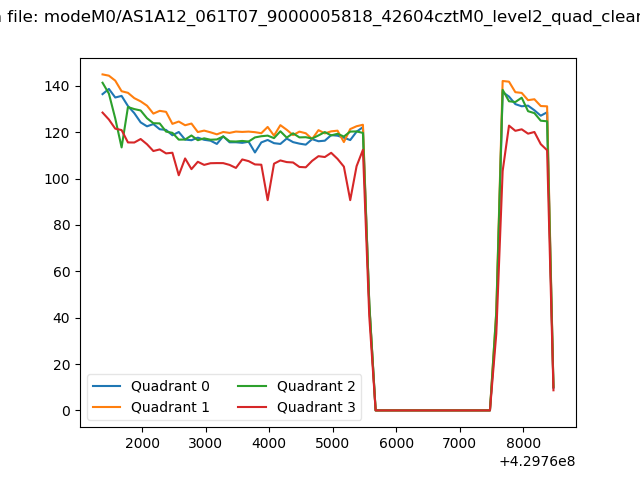 |
|
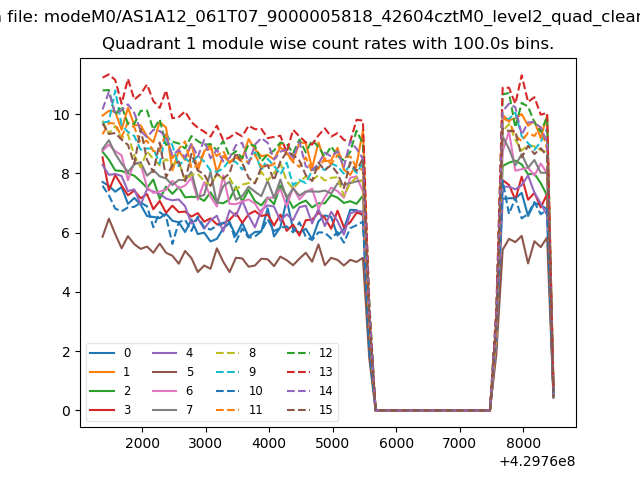
| Module-wise count rates for Quadrant A Data is divided into 100 sec bins |
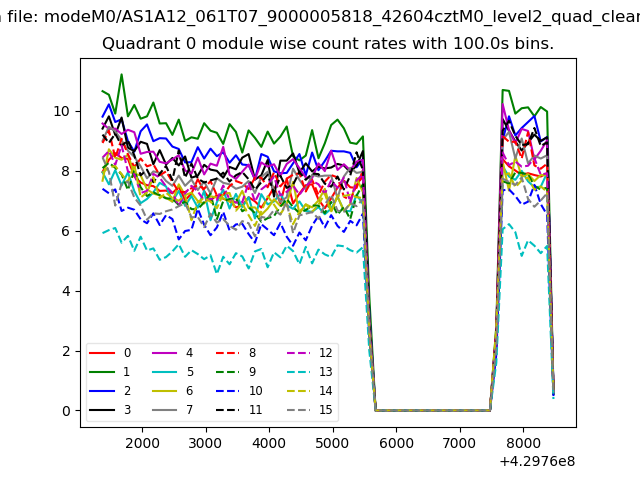 |
 |
| Module-wise count rates for Quadrant B Data is divided into 100 sec bins |
 |
 |
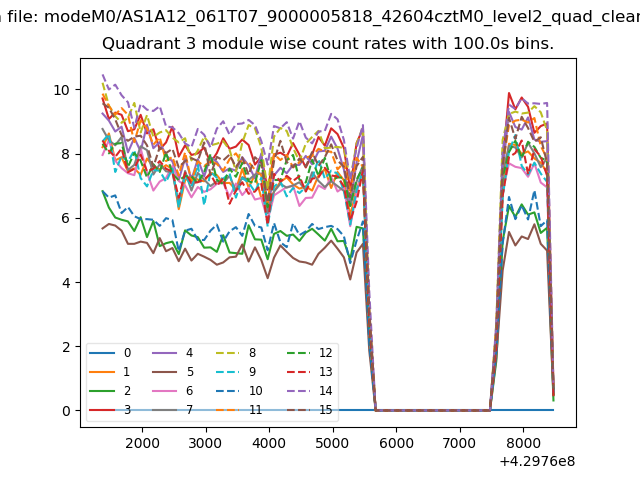
| Module-wise count rates for Quadrant C Data is divided into 100 sec bins |
 |
 |
| Module-wise count rates for Quadrant D Data is divided into 100 sec bins |
 |
 |
| Parameter | Plot |
|---|---|
| CZT HV Monitor | 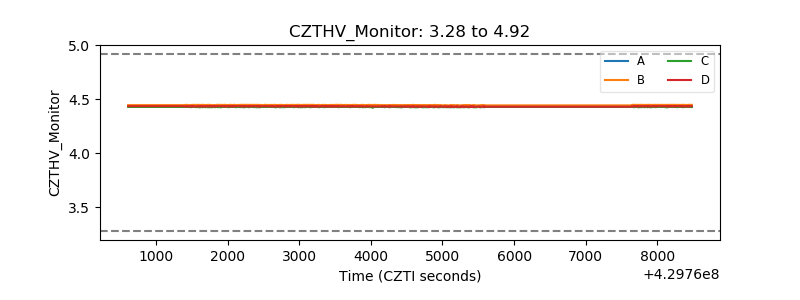 |
| D_VDD | 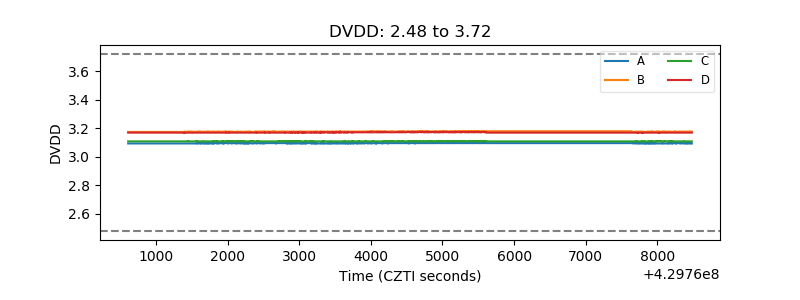 |
| Temperature 1 | 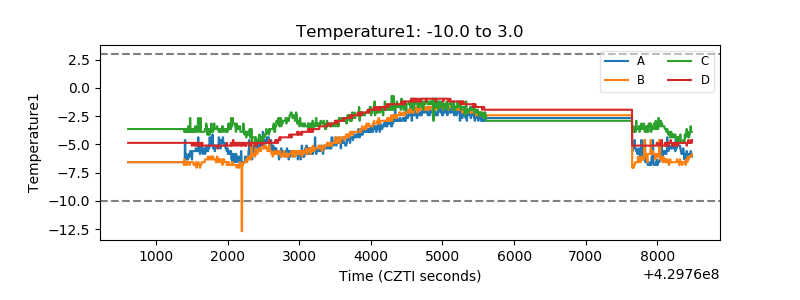 |
| Veto HV Monitor | 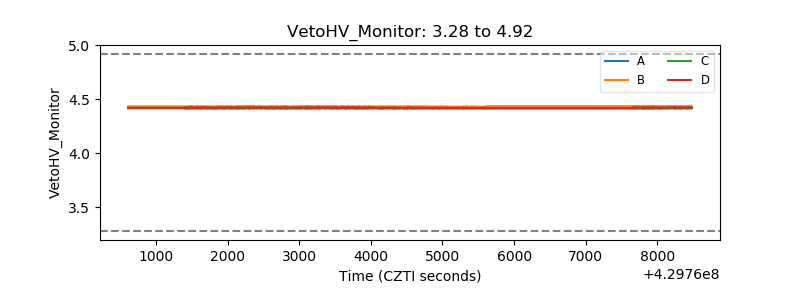 |
| Veto LLD | 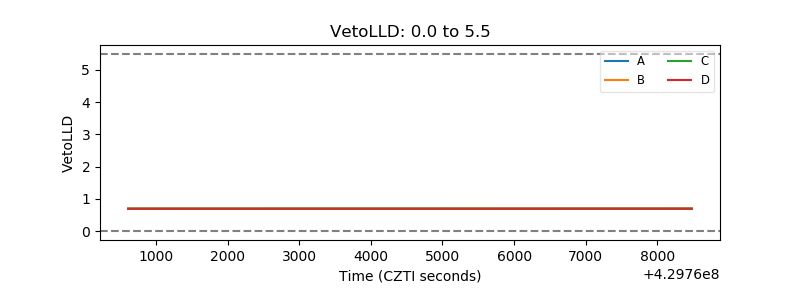 |
| Alpha Counter |  |
| _CPM_Rate | 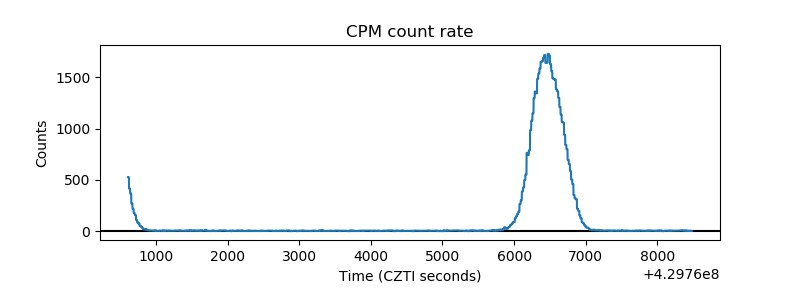 |
| CZT Counter | 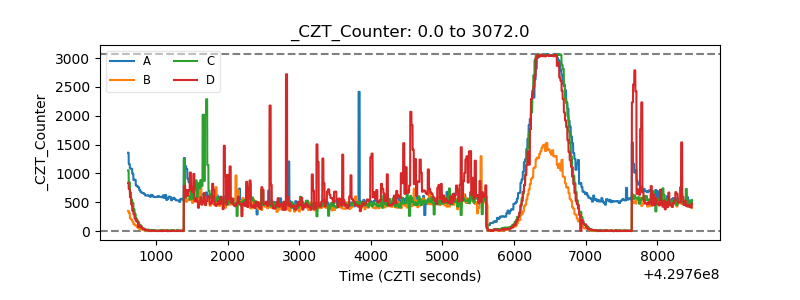 |
| +2.5 Volts monitor | 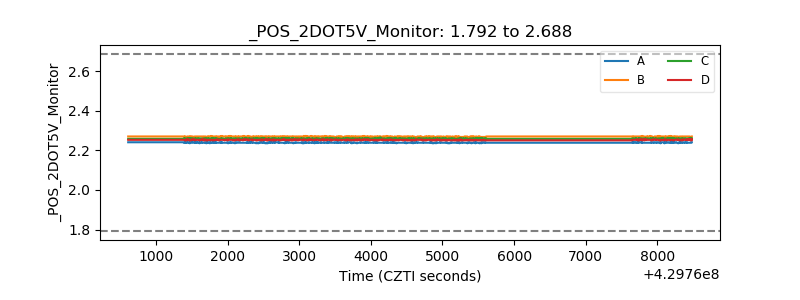 |
| +5 Volts monitor | 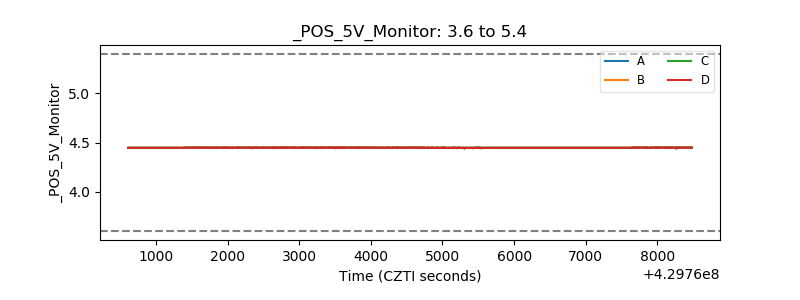 |
| _ROLL_ROT | 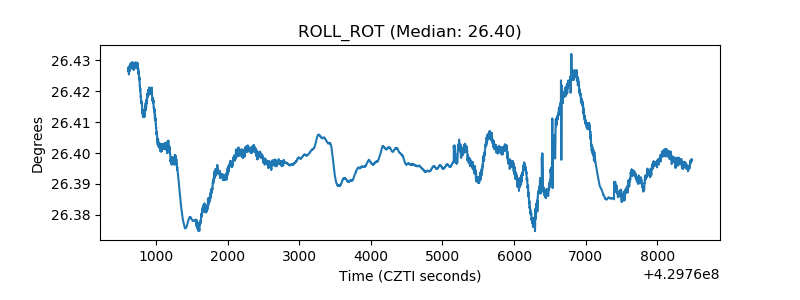 |
| _Roll_DEC | 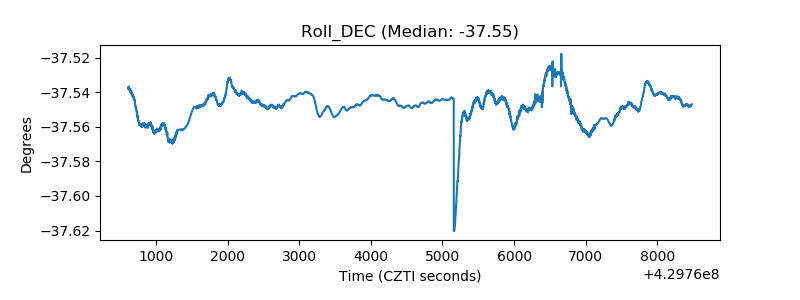 |
| _Roll_RA |  |
| Veto Counter | 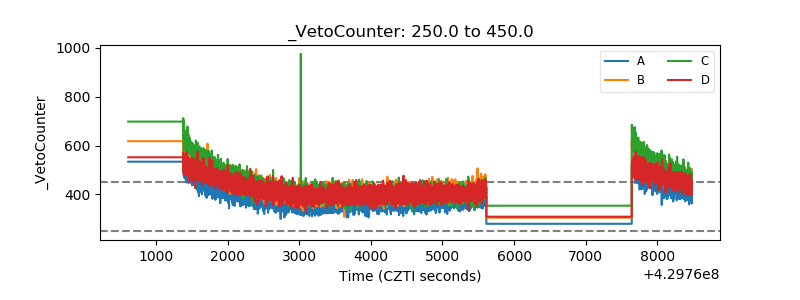 |