| Param | Original file | Final file |
|---|---|---|
| Filename | modeM0/AS1A12_061T07_9000005818_42605cztM0_level2.fits | modeM0/AS1A12_061T07_9000005818_42605cztM0_level2_quad_clean.evt |
| Size (bytes) | 313,191,360 | 88,459,200 |
| Size | 298.7 MB | 84.4 MB |
| Events in quadrant A | 2,720,606 | 594,982 |
| Events in quadrant B | 2,355,963 | 615,646 |
| Events in quadrant C | 2,468,880 | 599,372 |
| Events in quadrant D | 3,664,035 | 523,826 |
| Mode M0 | |||
|---|---|---|---|
| Quadrant | BADHDUFLAG | Total packets | Discarded packets |
| A | 0 | 10940 | 2 |
| B | 0 | 10176 | 2 |
| C | 0 | 10088 | 2 |
| D | 0 | 14200 | 2 |
| Mode SS | |||
|---|---|---|---|
| Quadrant | BADHDUFLAG | Total packets | Discarded packets |
| A | 0 | 98 | 0 |
| B | 0 | 98 | 0 |
| C | 0 | 98 | 0 |
| D | 0 | 98 | 0 |
| Mode M9 | |||
|---|---|---|---|
| Quadrant | BADHDUFLAG | Total packets | Discarded packets |
| A | 0 | 25 | 0 |
| B | 0 | 26 | 0 |
| C | 0 | 26 | 0 |
| D | 0 | 26 | 0 |
| Quadrant | Total seconds | Saturated seconds | Saturation percentage |
|---|---|---|---|
| A | 4925 | 15 | 0.304569% |
| B | 4925 | 17 | 0.345178% |
| C | 4925 | 4 | 0.081218% |
| D | 4924 | 283 | 5.747360% |
Noise dominated data is calculated using 1-second bins in cleaned event files. If a bin has >2000 counts, and if more than 50% of those come from <1% of pixels, then it is considered to be noise-dominated and hence unusable.
| Quadrant | # 1 sec bins | Bins with >0 counts | Bins with >2000 counts | High rate bins dominated by noise | Noise dominated (total time) | Noise dominated (detector-on time) | Marked lightcurve |
|---|---|---|---|---|---|---|---|
| A | 7048 | 4926 | 4 | 4 | 0.06% | 0.08% | 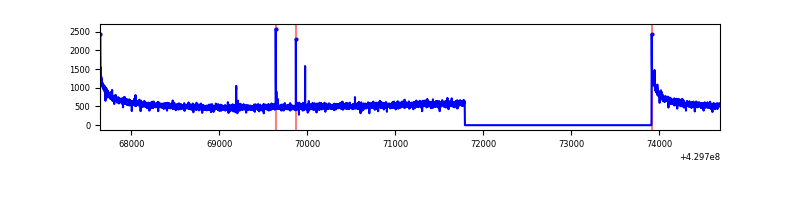 |
| B | 7048 | 4926 | 5 | 5 | 0.07% | 0.10% | 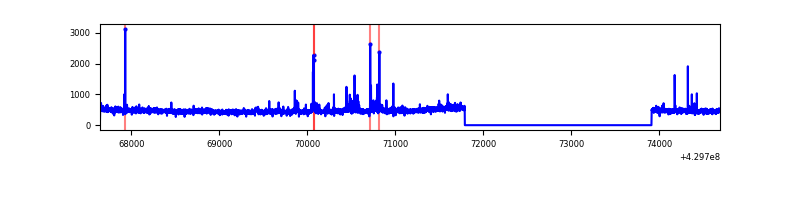 |
| C | 7048 | 4926 | 0 | 0 | 0.00% | 0.00% | 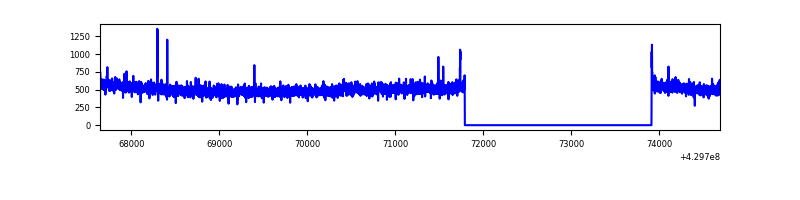 |
| D | 7047 | 4925 | 248 | 248 | 3.52% | 5.04% | 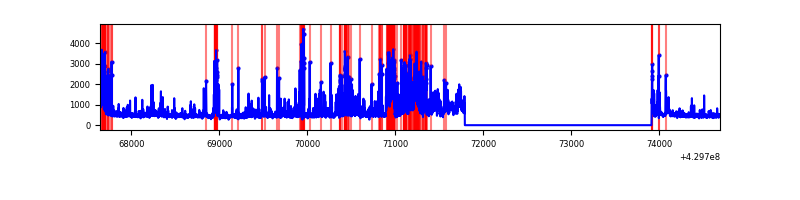 |
Top three noisy pixels from each quadrant. If the there are fewer than three noisy pixels in the level2.evt file, extra rows are filled as -1
| Pixel properties | Quadrant properties | ||||||
|---|---|---|---|---|---|---|---|
| Quadrant | DetID | PixID | Counts | Sigma | Mean | Median | Sigma |
| A | 10 | 83 | 516243 | 4477.74 | 565 | 554 | 115.2 |
| A | 15 | 237 | 11090 | 91.48 | 565 | 554 | 115.2 |
| A | 13 | 254 | 6842 | 54.6 | 565 | 554 | 115.2 |
| B | 0 | 245 | 65193 | 596.45 | 562 | 548 | 108.4 |
| B | 7 | 202 | 24750 | 223.3 | 562 | 548 | 108.4 |
| B | 5 | 255 | 22988 | 207.05 | 562 | 548 | 108.4 |
| C | 15 | 214 | 222953 | 1706.87 | 564 | 570 | 130.3 |
| C | 3 | 233 | 28807 | 216.73 | 564 | 570 | 130.3 |
| C | 14 | 254 | 12313 | 90.13 | 564 | 570 | 130.3 |
| D | 1 | 52 | 1112444 | 8277.41 | 551 | 537 | 134.3 |
| D | 12 | 6 | 153755 | 1140.61 | 551 | 537 | 134.3 |
| D | 2 | 249 | 99011 | 733.07 | 551 | 537 | 134.3 |
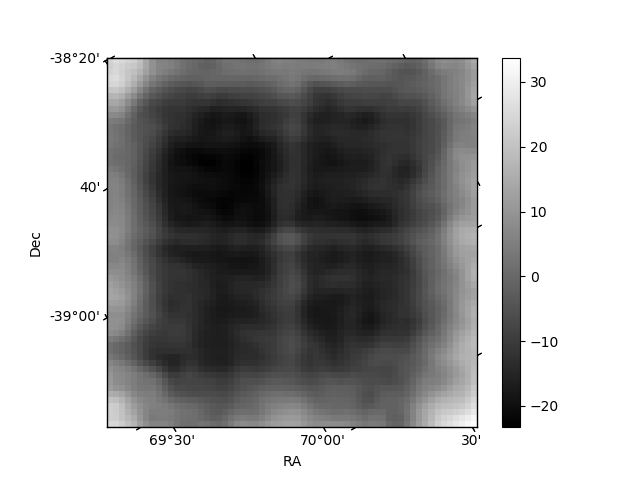
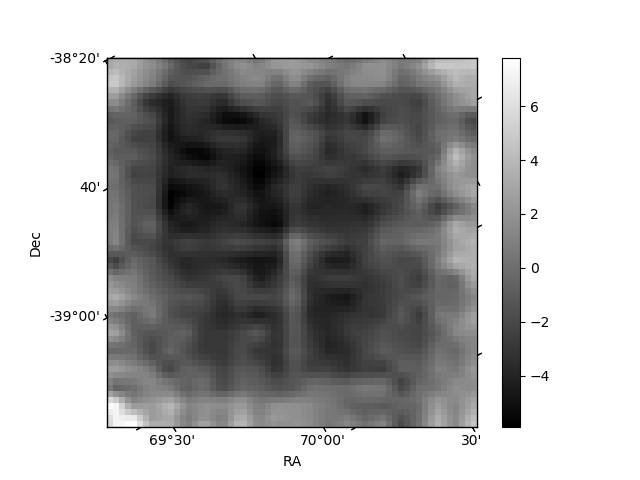
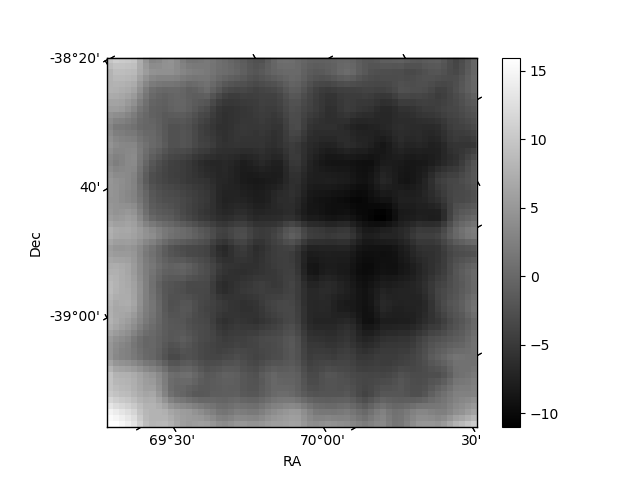
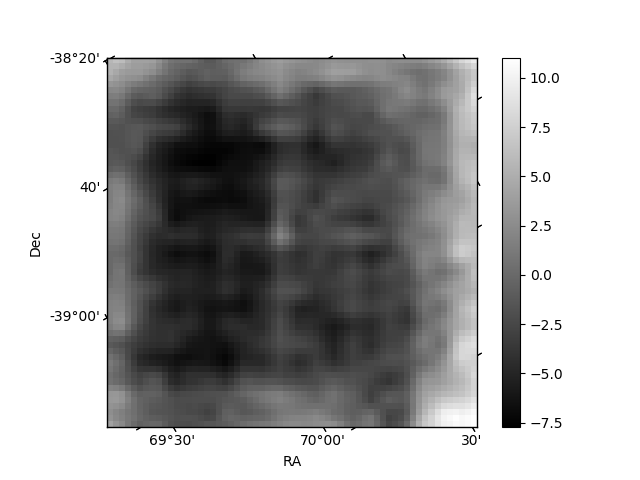
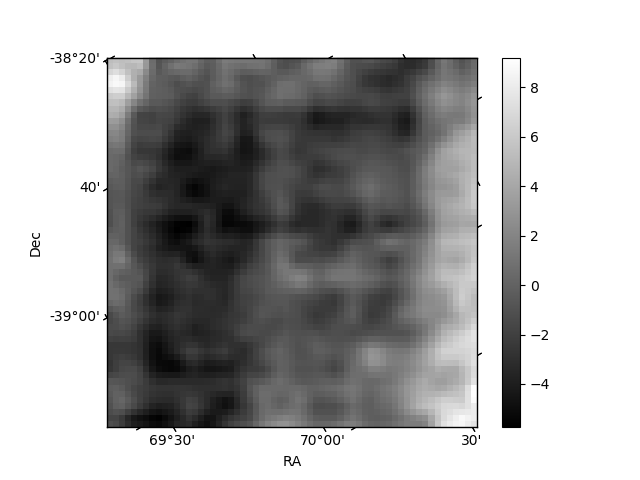
Histogram calculated using DETX and DETY for each event in the final _common_clean file
| Quadrant A | 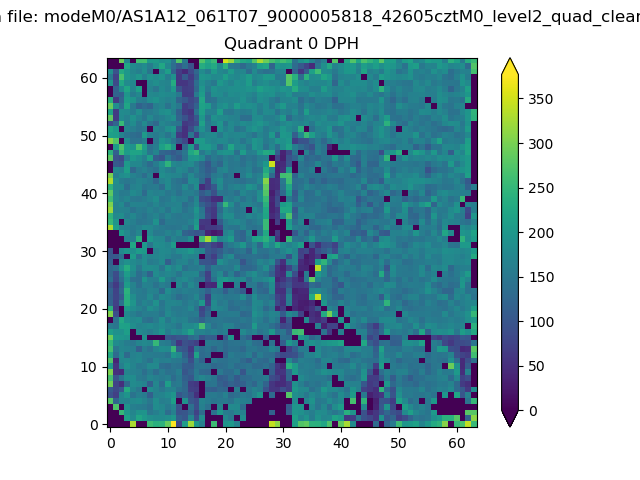 |
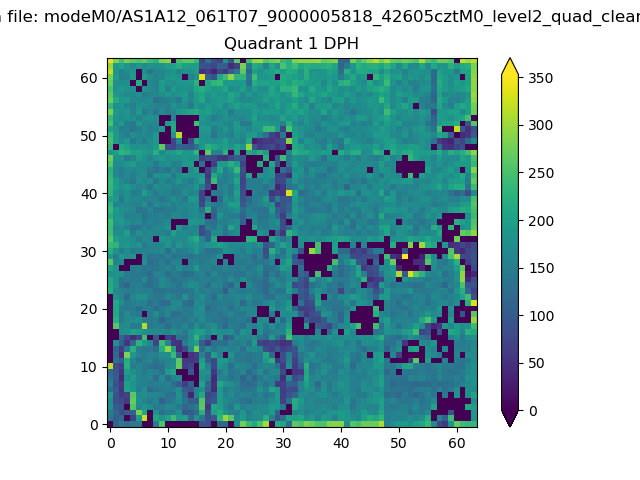 |
Quadrant B |
|---|---|---|---|
| Quadrant D | 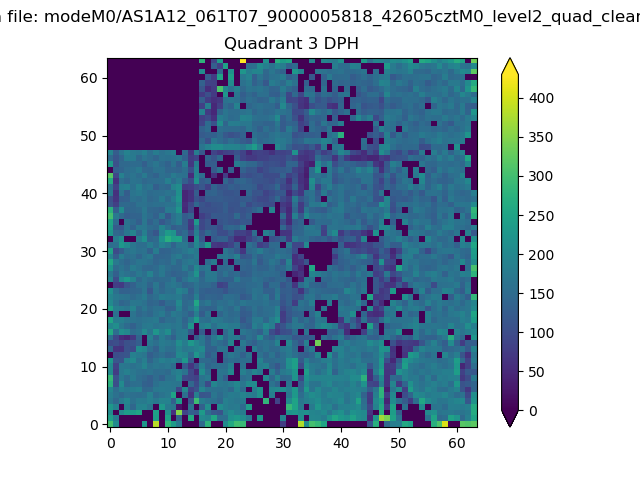 |
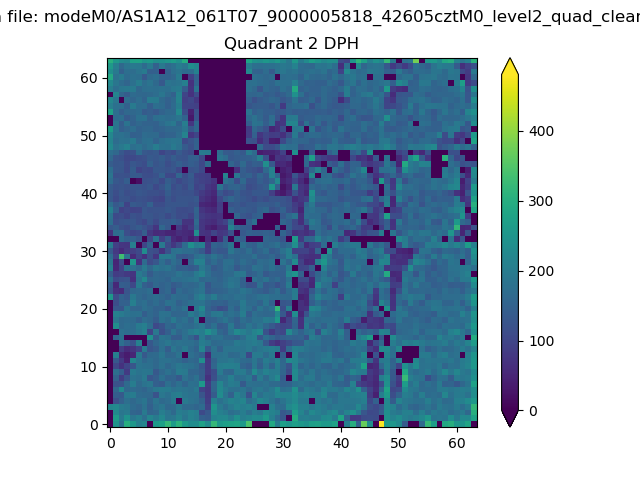 |
Quadrant C |
| Plot type | Count rate plots | Images |
|---|---|---|
| Comparison with Poisson distribution Blue bars denote a histogram of data divided into 1 sec bins. Red curve is a Poisson curve with rate = median count rate of data. |
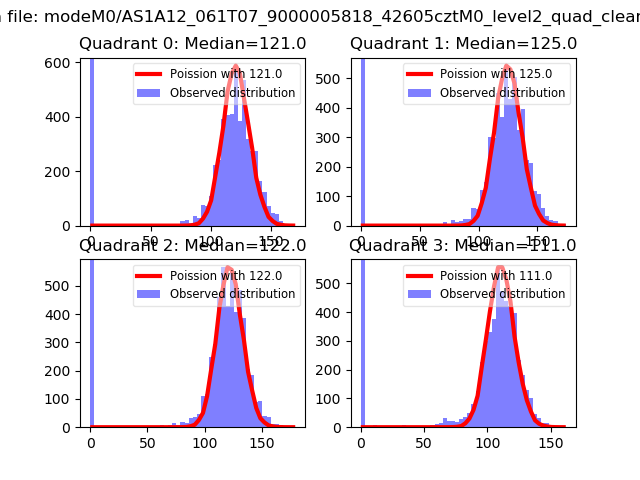 |
 |
| Quadrant-wise count rates Data is divided into 100 sec bins |
 |
|
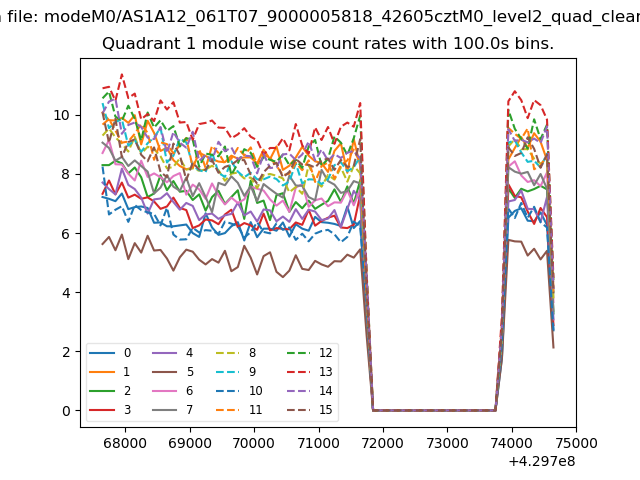
| Module-wise count rates for Quadrant A Data is divided into 100 sec bins |
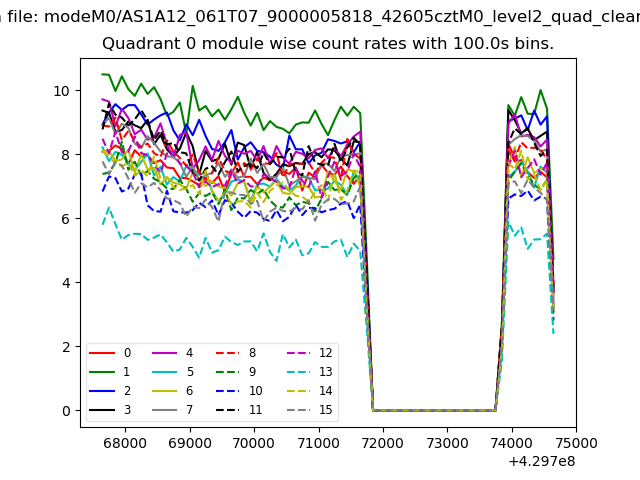 |
 |
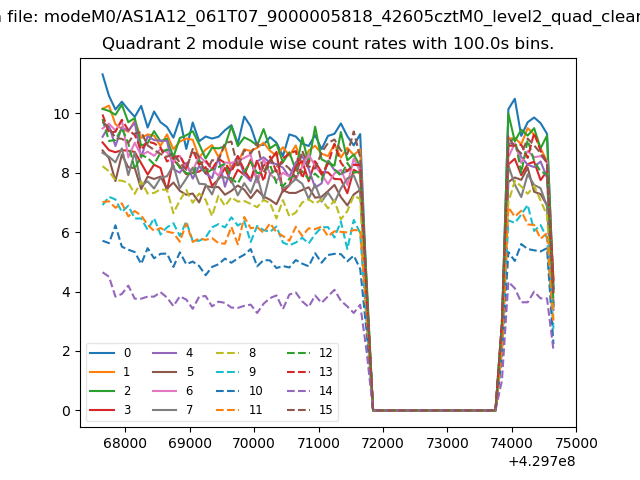
| Module-wise count rates for Quadrant B Data is divided into 100 sec bins |
 |
 |
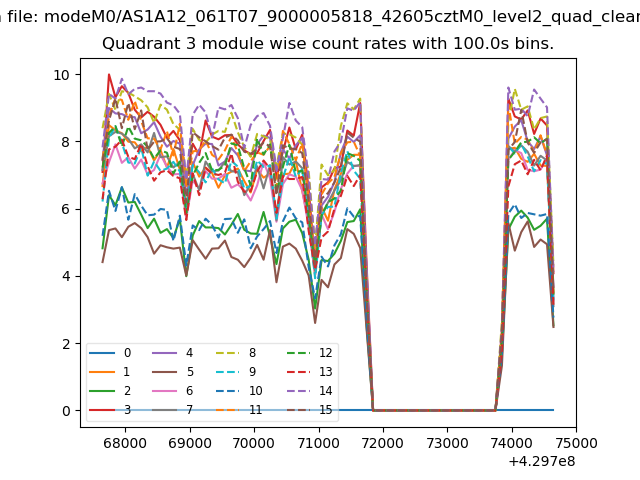
| Module-wise count rates for Quadrant C Data is divided into 100 sec bins |
 |
 |
| Module-wise count rates for Quadrant D Data is divided into 100 sec bins |
 |
 |
| Parameter | Plot |
|---|---|
| CZT HV Monitor | 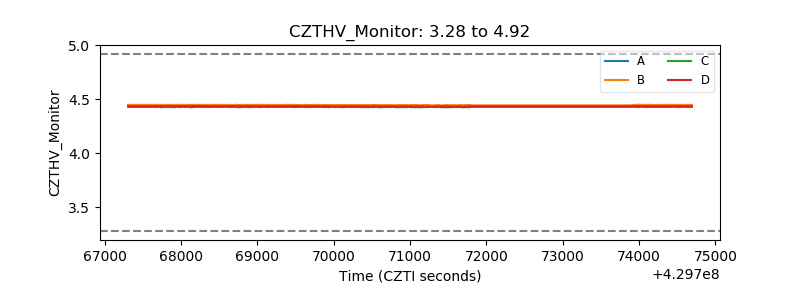 |
| D_VDD | 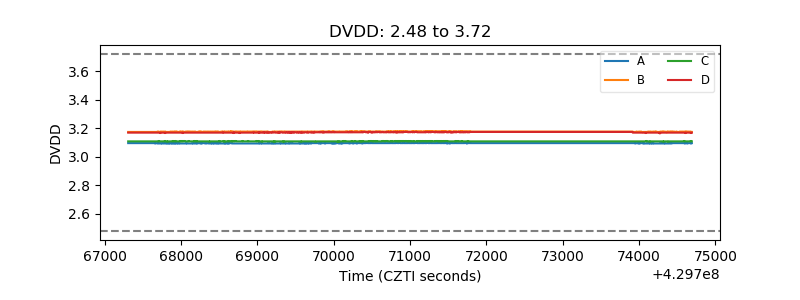 |
| Temperature 1 | 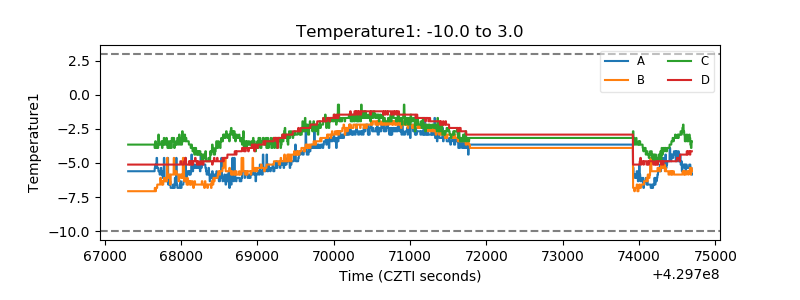 |
| Veto HV Monitor | 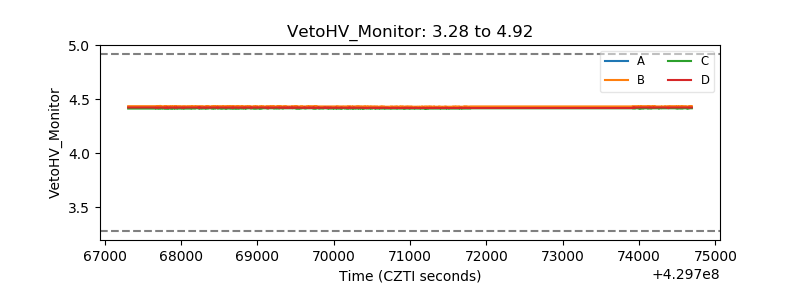 |
| Veto LLD | 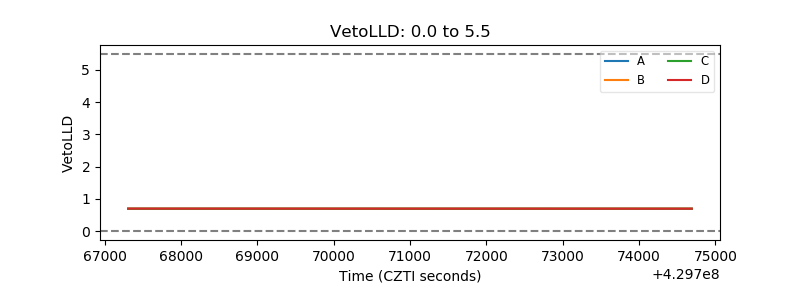 |
| Alpha Counter | 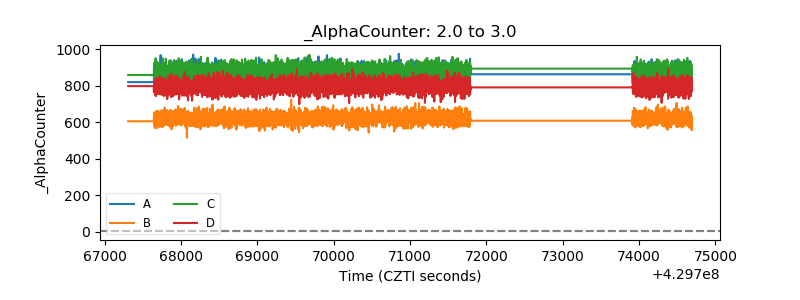 |
| _CPM_Rate | 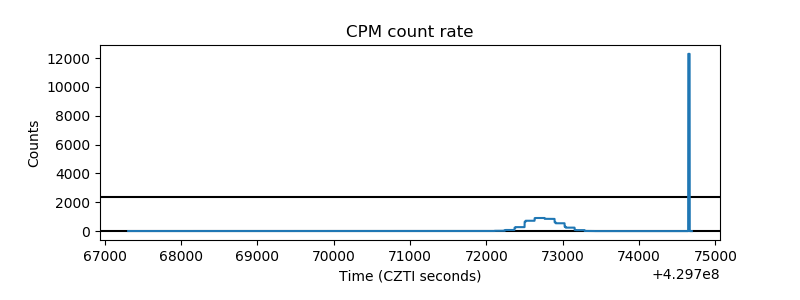 |
| CZT Counter | 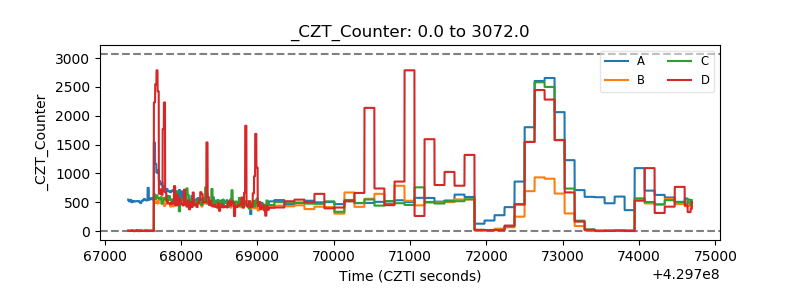 |
| +2.5 Volts monitor | 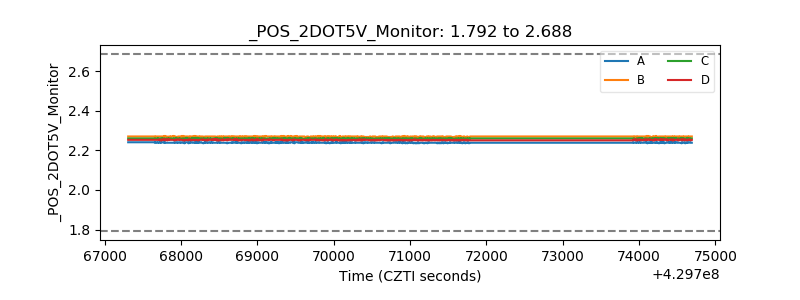 |
| +5 Volts monitor | 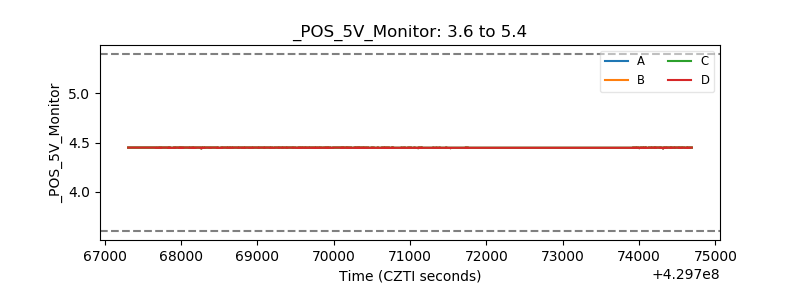 |
| _ROLL_ROT | 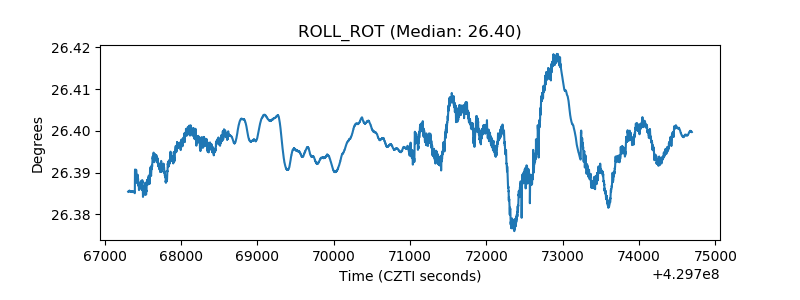 |
| _Roll_DEC | 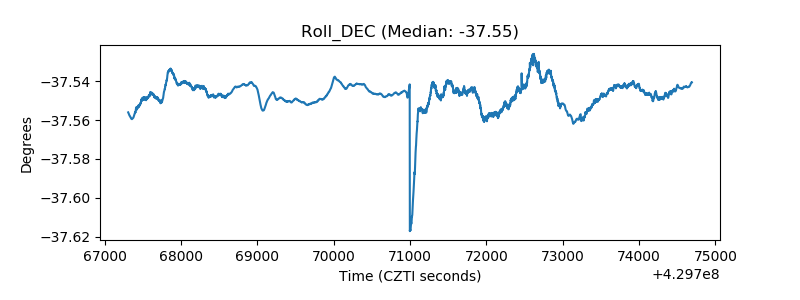 |
| _Roll_RA | 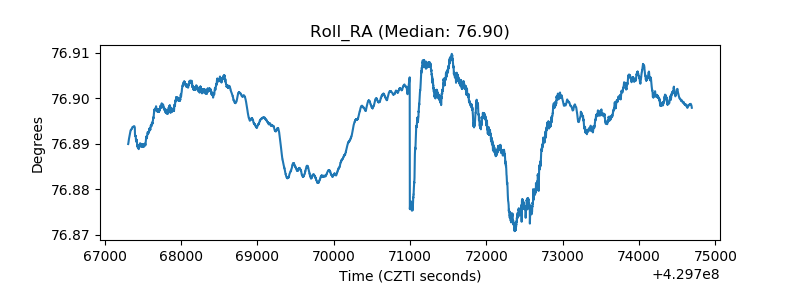 |
| Veto Counter | 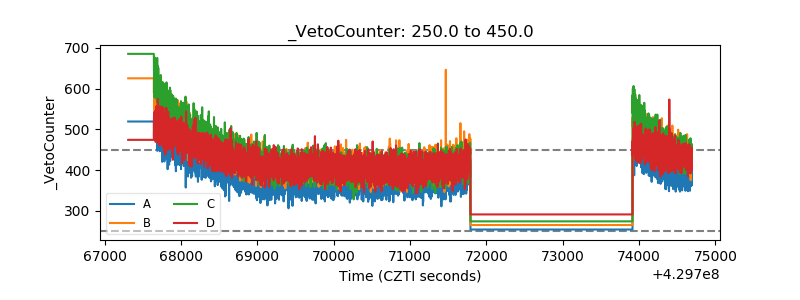 |