| Param | Original file | Final file |
|---|---|---|
| Filename | modeM0/AS1A12_061T07_9000005818_42606cztM0_level2.fits | modeM0/AS1A12_061T07_9000005818_42606cztM0_level2_quad_clean.evt |
| Size (bytes) | 298,465,920 | 85,109,760 |
| Size | 284.6 MB | 81.2 MB |
| Events in quadrant A | 2,689,518 | 566,178 |
| Events in quadrant B | 2,427,562 | 582,520 |
| Events in quadrant C | 2,583,108 | 566,087 |
| Events in quadrant D | 2,968,400 | 521,037 |
| Mode M0 | |||
|---|---|---|---|
| Quadrant | BADHDUFLAG | Total packets | Discarded packets |
| A | 0 | 10792 | 2 |
| B | 0 | 10286 | 3 |
| C | 0 | 10451 | 2 |
| D | 0 | 12128 | 2 |
| Mode SS | |||
|---|---|---|---|
| Quadrant | BADHDUFLAG | Total packets | Discarded packets |
| A | 0 | 98 | 0 |
| B | 0 | 98 | 0 |
| C | 0 | 98 | 0 |
| D | 0 | 98 | 0 |
| Mode M9 | |||
|---|---|---|---|
| Quadrant | BADHDUFLAG | Total packets | Discarded packets |
| A | 0 | 23 | 0 |
| B | 0 | 24 | 0 |
| C | 0 | 24 | 0 |
| D | 0 | 24 | 0 |
| Quadrant | Total seconds | Saturated seconds | Saturation percentage |
|---|---|---|---|
| A | 4871 | 9 | 0.184767% |
| B | 4870 | 13 | 0.266940% |
| C | 4870 | 27 | 0.554415% |
| D | 4870 | 49 | 1.006160% |
Noise dominated data is calculated using 1-second bins in cleaned event files. If a bin has >2000 counts, and if more than 50% of those come from <1% of pixels, then it is considered to be noise-dominated and hence unusable.
| Quadrant | # 1 sec bins | Bins with >0 counts | Bins with >2000 counts | High rate bins dominated by noise | Noise dominated (total time) | Noise dominated (detector-on time) | Marked lightcurve |
|---|---|---|---|---|---|---|---|
| A | 6992 | 4872 | 2 | 2 | 0.03% | 0.04% | 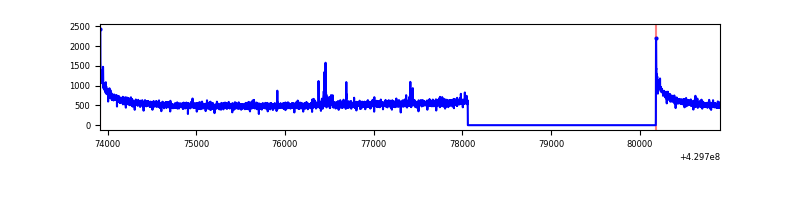 |
| B | 6991 | 4871 | 8 | 8 | 0.11% | 0.16% | 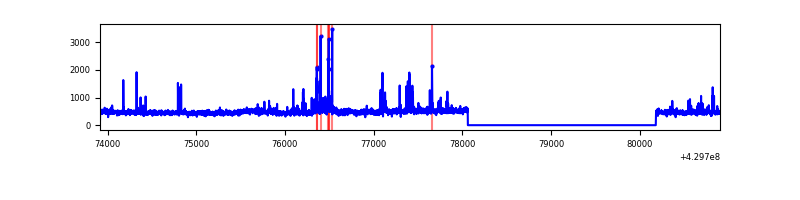 |
| C | 6991 | 4871 | 21 | 21 | 0.30% | 0.43% | 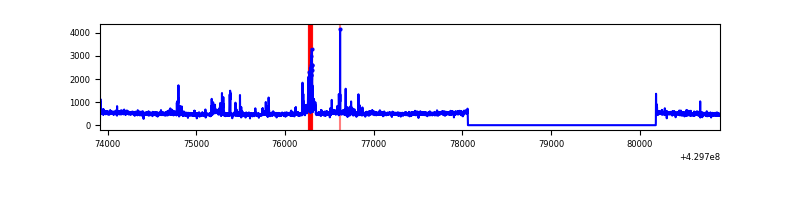 |
| D | 6991 | 4871 | 35 | 35 | 0.50% | 0.72% | 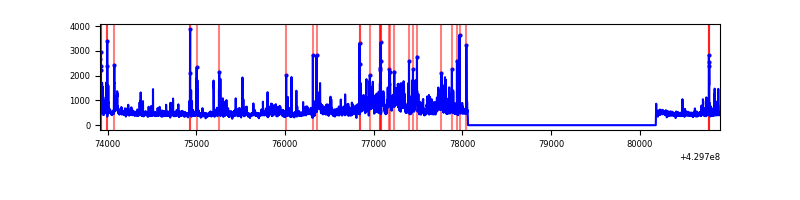 |
Top three noisy pixels from each quadrant. If the there are fewer than three noisy pixels in the level2.evt file, extra rows are filled as -1
| Pixel properties | Quadrant properties | ||||||
|---|---|---|---|---|---|---|---|
| Quadrant | DetID | PixID | Counts | Sigma | Mean | Median | Sigma |
| A | 10 | 83 | 537159 | 4823.59 | 549 | 538 | 111.2 |
| A | 2 | 79 | 12067 | 103.63 | 549 | 538 | 111.2 |
| A | 13 | 248 | 11201 | 95.85 | 549 | 538 | 111.2 |
| B | 0 | 245 | 113984 | 1085.52 | 542 | 526 | 104.5 |
| B | 5 | 172 | 53701 | 508.76 | 542 | 526 | 104.5 |
| B | 7 | 202 | 52037 | 492.84 | 542 | 526 | 104.5 |
| C | 15 | 214 | 220095 | 1753.07 | 542 | 545 | 125.2 |
| C | 5 | 250 | 110920 | 881.33 | 542 | 545 | 125.2 |
| C | 3 | 233 | 56330 | 445.43 | 542 | 545 | 125.2 |
| D | 1 | 52 | 405942 | 3078.84 | 544 | 529 | 131.7 |
| D | 2 | 249 | 227289 | 1722.09 | 544 | 529 | 131.7 |
| D | 9 | 19 | 104110 | 786.63 | 544 | 529 | 131.7 |
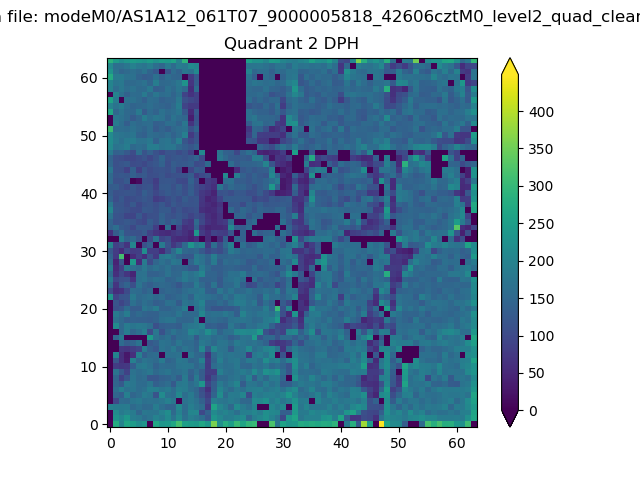
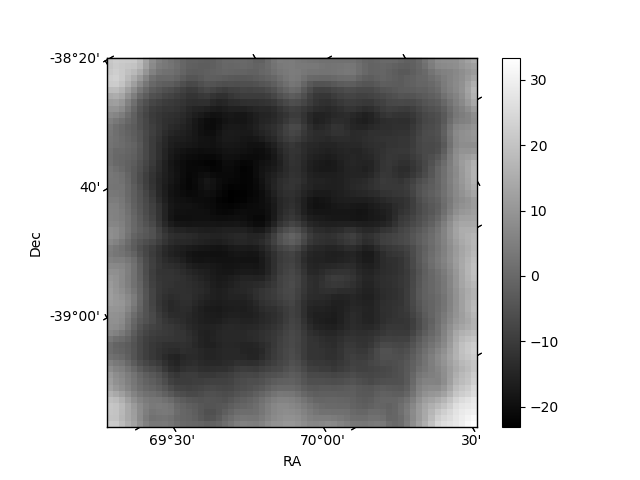
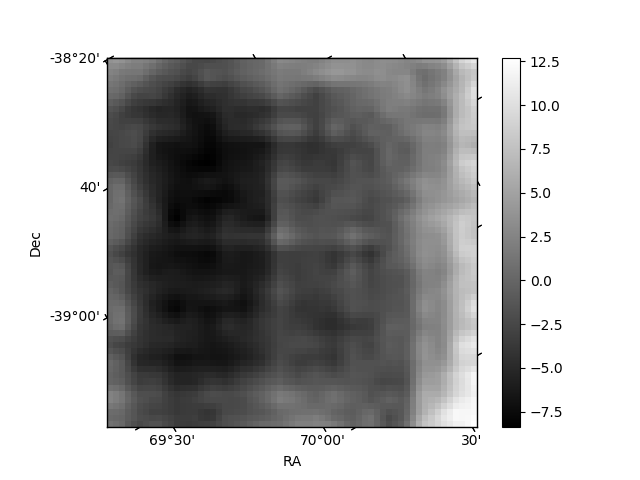
Histogram calculated using DETX and DETY for each event in the final _common_clean file
| Quadrant A | 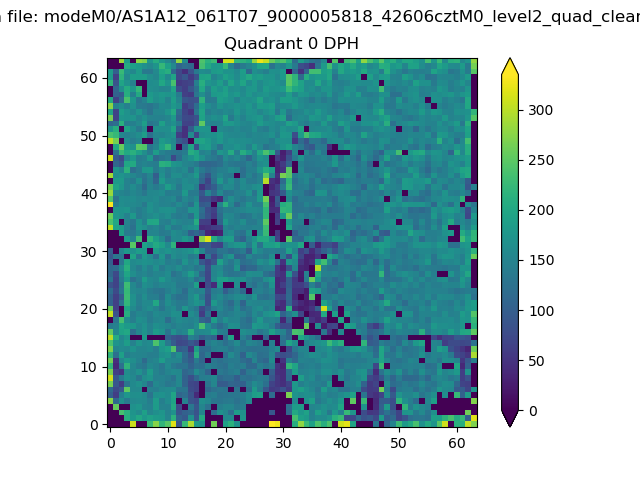 |
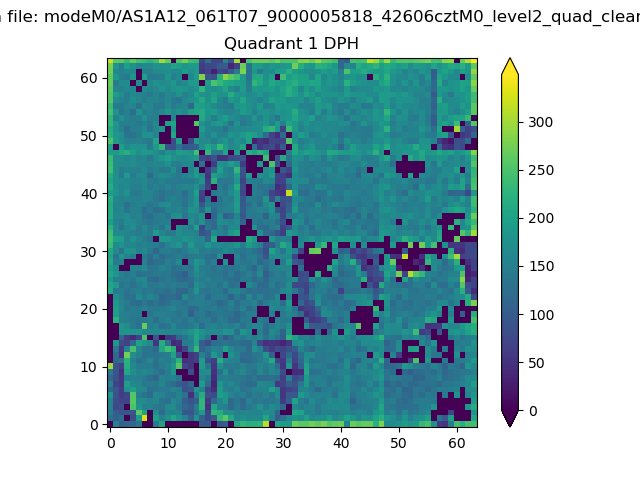 |
Quadrant B |
|---|---|---|---|
| Quadrant D | 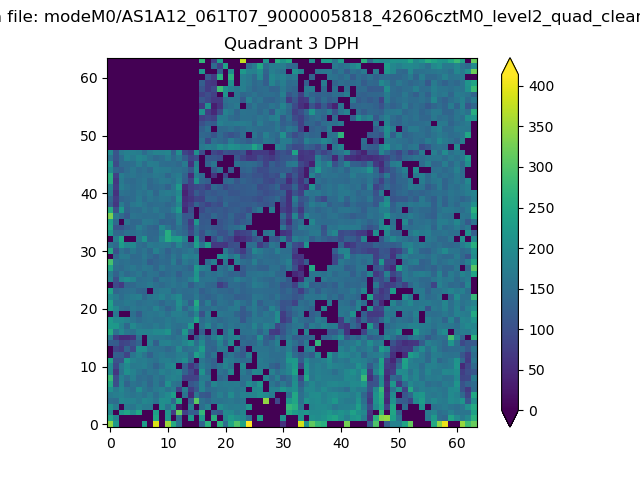 |
 |
Quadrant C |
| Plot type | Count rate plots | Images |
|---|---|---|
| Comparison with Poisson distribution Blue bars denote a histogram of data divided into 1 sec bins. Red curve is a Poisson curve with rate = median count rate of data. |
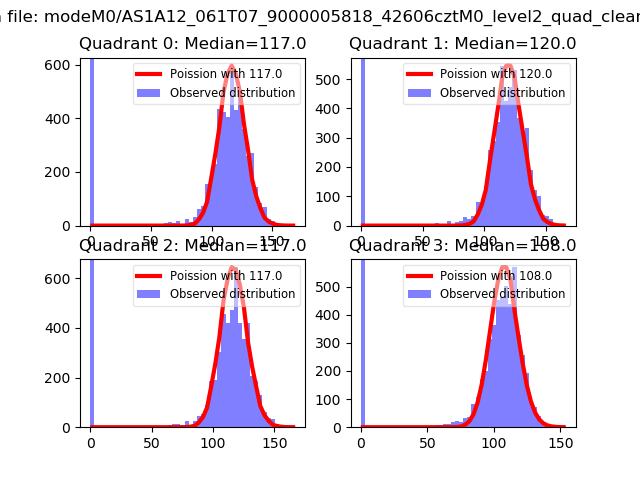 |
 |
| Quadrant-wise count rates Data is divided into 100 sec bins |
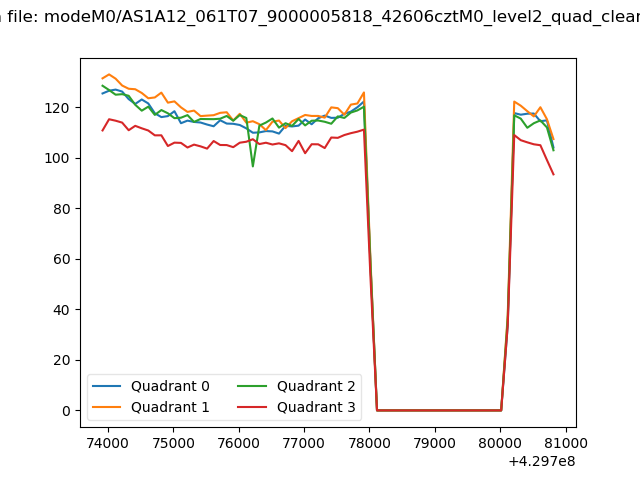 |
|
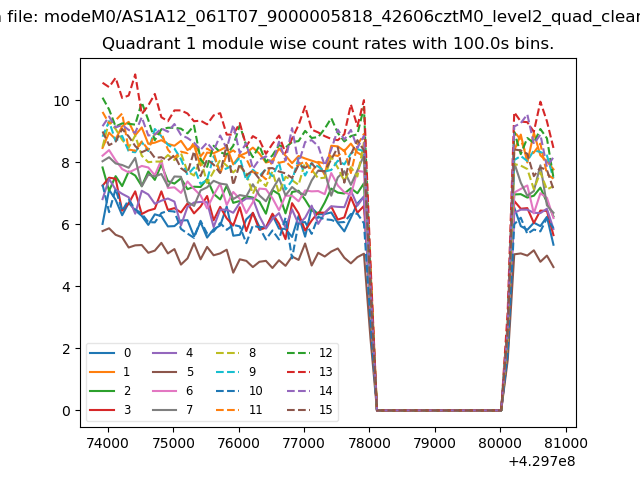
| Module-wise count rates for Quadrant A Data is divided into 100 sec bins |
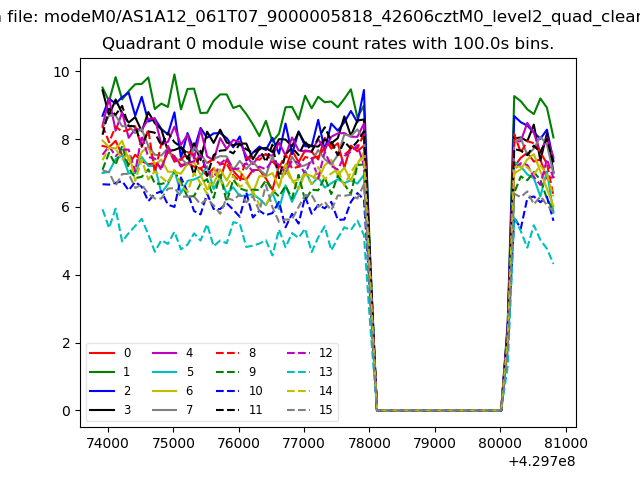 |
 |
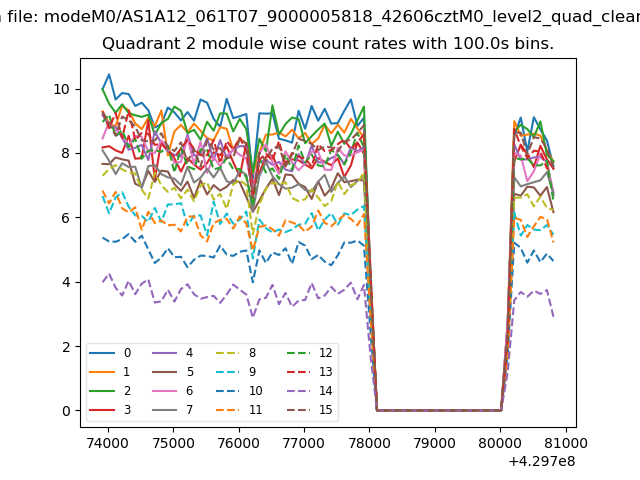
| Module-wise count rates for Quadrant B Data is divided into 100 sec bins |
 |
 |
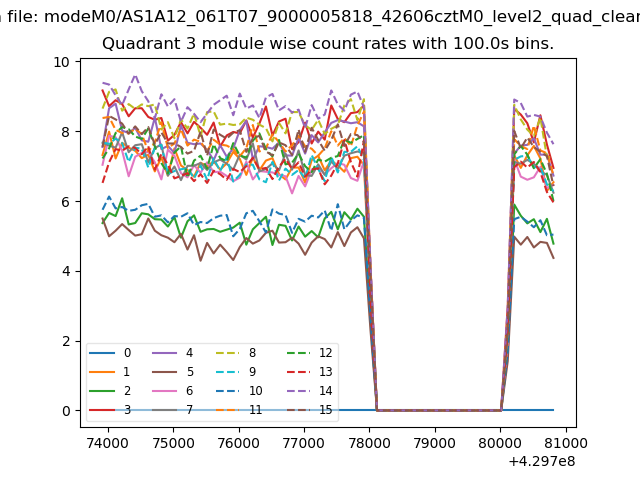
| Module-wise count rates for Quadrant C Data is divided into 100 sec bins |
 |
 |
| Module-wise count rates for Quadrant D Data is divided into 100 sec bins |
 |
 |
| Parameter | Plot |
|---|---|
| CZT HV Monitor | 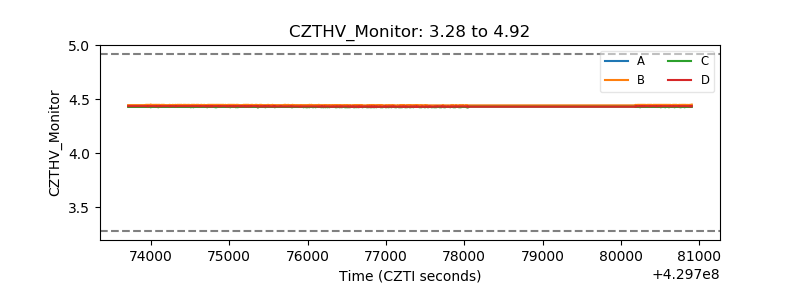 |
| D_VDD | 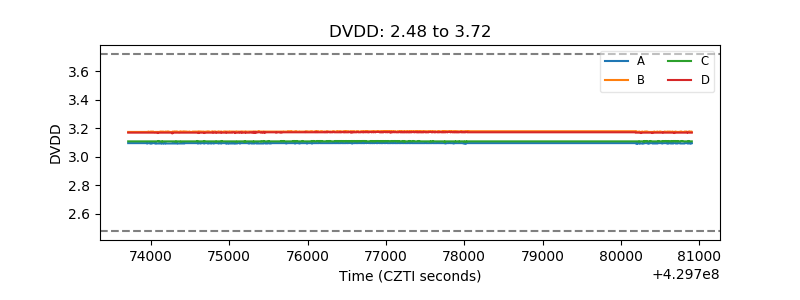 |
| Temperature 1 | 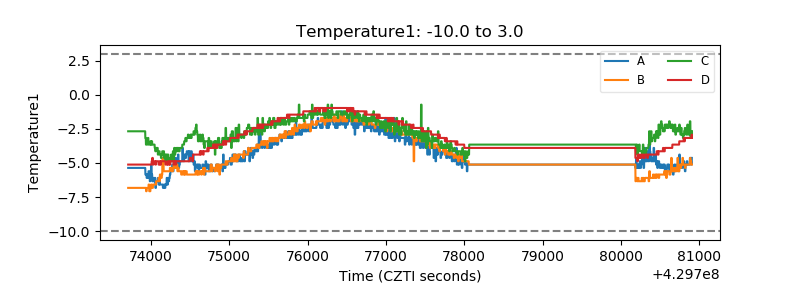 |
| Veto HV Monitor | 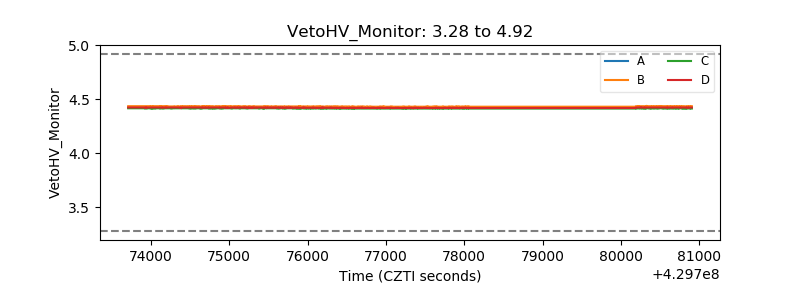 |
| Veto LLD | 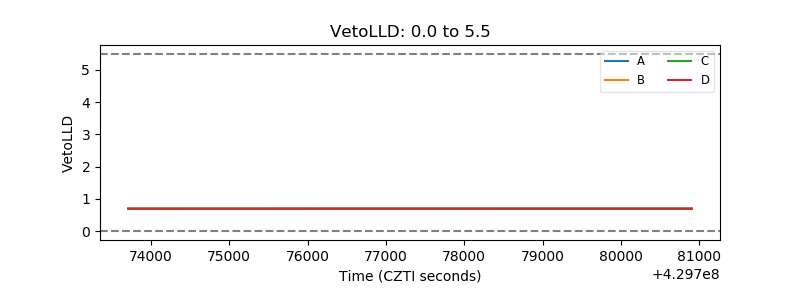 |
| Alpha Counter |  |
| _CPM_Rate | 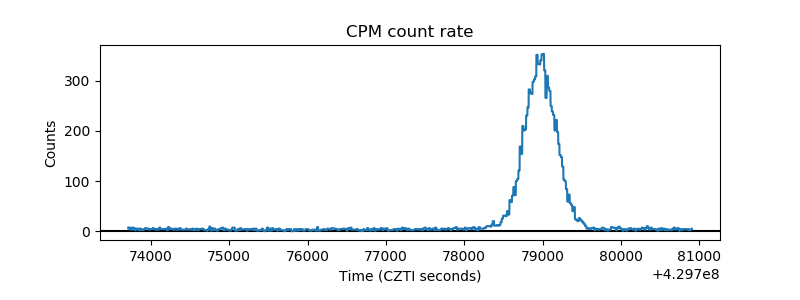 |
| CZT Counter | 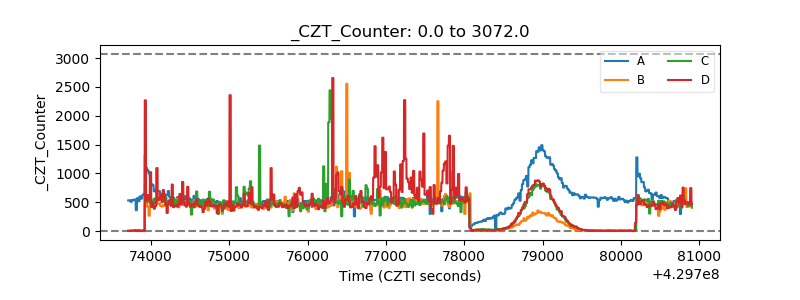 |
| +2.5 Volts monitor | 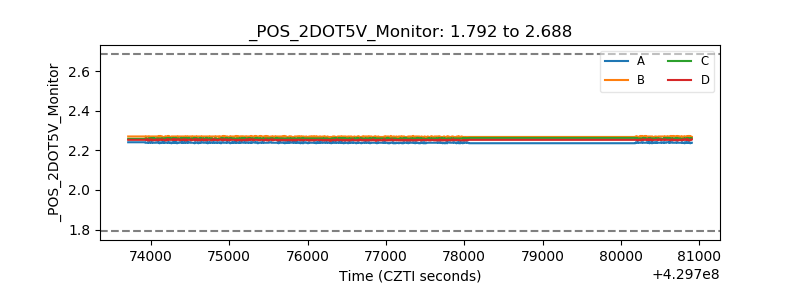 |
| +5 Volts monitor | 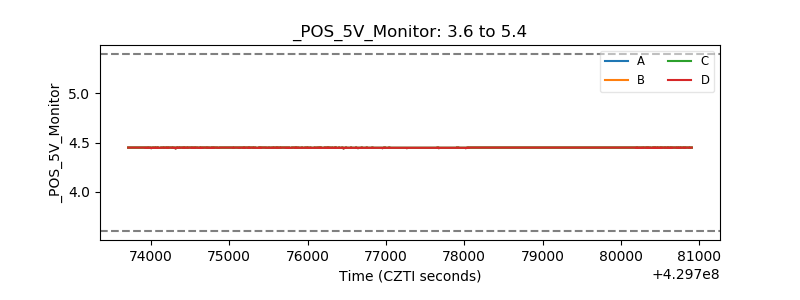 |
| _ROLL_ROT | 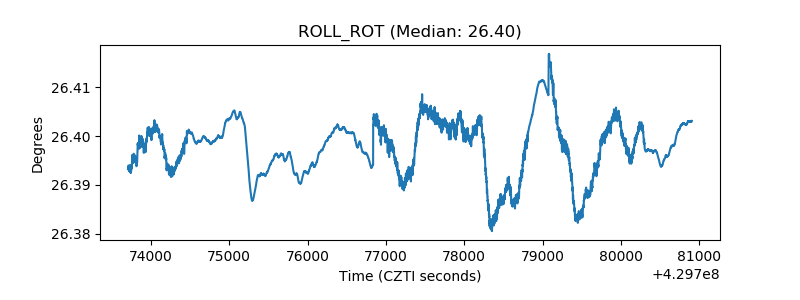 |
| _Roll_DEC | 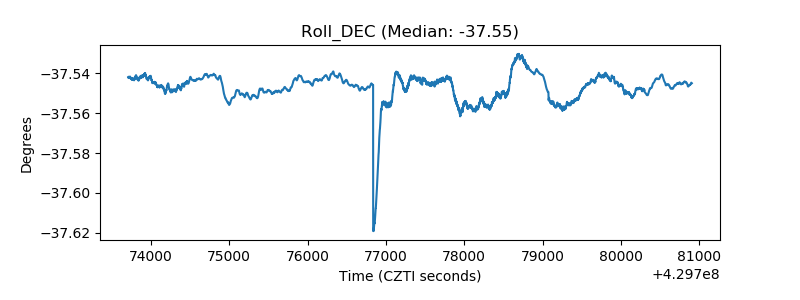 |
| _Roll_RA | 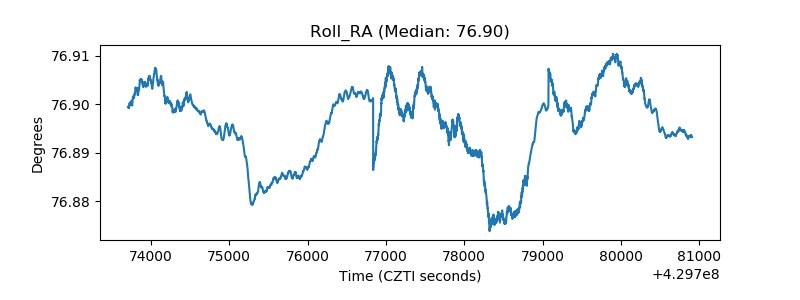 |
| Veto Counter | 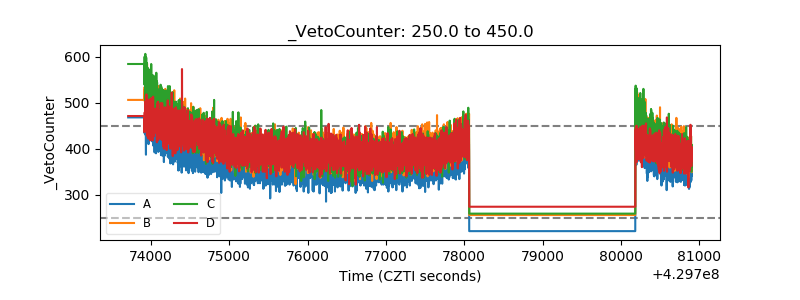 |