| Param | Original file | Final file |
|---|---|---|
| Filename | modeM0/AS1A12_061T07_9000005818_42607cztM0_level2.fits | modeM0/AS1A12_061T07_9000005818_42607cztM0_level2_quad_clean.evt |
| Size (bytes) | 344,232,000 | 88,888,320 |
| Size | 328.3 MB | 84.8 MB |
| Events in quadrant A | 2,878,794 | 592,467 |
| Events in quadrant B | 2,625,498 | 603,874 |
| Events in quadrant C | 3,218,147 | 589,556 |
| Events in quadrant D | 3,604,942 | 532,102 |
| Mode M0 | |||
|---|---|---|---|
| Quadrant | BADHDUFLAG | Total packets | Discarded packets |
| A | 0 | 11608 | 2 |
| B | 0 | 11319 | 2 |
| C | 0 | 12935 | 2 |
| D | 0 | 14333 | 2 |
| Mode SS | |||
|---|---|---|---|
| Quadrant | BADHDUFLAG | Total packets | Discarded packets |
| A | 0 | 110 | 0 |
| B | 0 | 110 | 0 |
| C | 0 | 110 | 0 |
| D | 0 | 110 | 0 |
| Mode M9 | |||
|---|---|---|---|
| Quadrant | BADHDUFLAG | Total packets | Discarded packets |
| A | 0 | 20 | 0 |
| B | 0 | 20 | 0 |
| C | 0 | 20 | 0 |
| D | 0 | 20 | 0 |
| Quadrant | Total seconds | Saturated seconds | Saturation percentage |
|---|---|---|---|
| A | 5328 | 12 | 0.225225% |
| B | 5329 | 36 | 0.675549% |
| C | 5329 | 19 | 0.356540% |
| D | 5329 | 159 | 2.983674% |
Noise dominated data is calculated using 1-second bins in cleaned event files. If a bin has >2000 counts, and if more than 50% of those come from <1% of pixels, then it is considered to be noise-dominated and hence unusable.
| Quadrant | # 1 sec bins | Bins with >0 counts | Bins with >2000 counts | High rate bins dominated by noise | Noise dominated (total time) | Noise dominated (detector-on time) | Marked lightcurve |
|---|---|---|---|---|---|---|---|
| A | 7360 | 5329 | 2 | 2 | 0.03% | 0.04% | 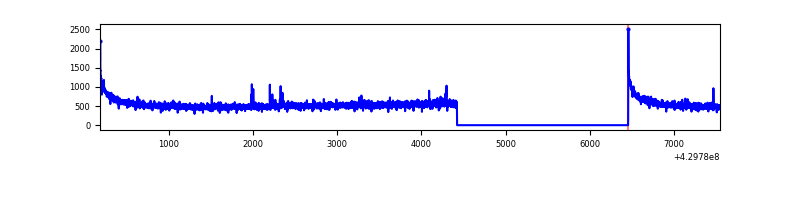 |
| B | 7361 | 5330 | 22 | 22 | 0.30% | 0.41% | 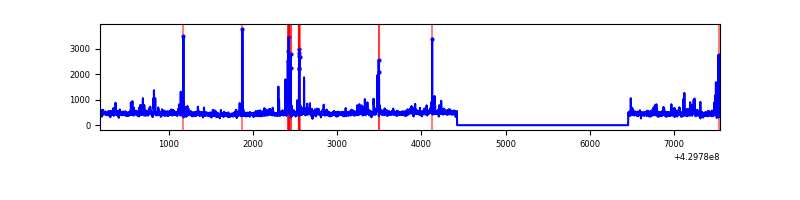 |
| C | 7361 | 5330 | 15 | 15 | 0.20% | 0.28% | 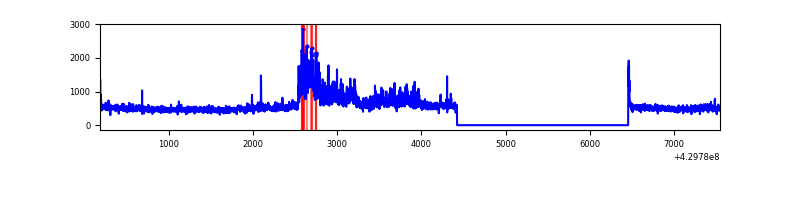 |
| D | 7361 | 5330 | 141 | 141 | 1.92% | 2.65% | 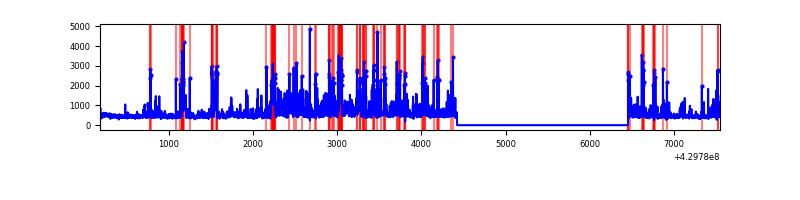 |
Top three noisy pixels from each quadrant. If the there are fewer than three noisy pixels in the level2.evt file, extra rows are filled as -1
| Pixel properties | Quadrant properties | ||||||
|---|---|---|---|---|---|---|---|
| Quadrant | DetID | PixID | Counts | Sigma | Mean | Median | Sigma |
| A | 10 | 83 | 581859 | 4821.46 | 587 | 575 | 120.6 |
| A | 13 | 248 | 16365 | 130.97 | 587 | 575 | 120.6 |
| A | 13 | 6 | 6500 | 49.14 | 587 | 575 | 120.6 |
| B | 0 | 245 | 115778 | 1019.71 | 580 | 563 | 113.0 |
| B | 15 | 85 | 58868 | 516.03 | 580 | 563 | 113.0 |
| B | 7 | 202 | 50956 | 446.0 | 580 | 563 | 113.0 |
| C | 3 | 233 | 711952 | 5316.65 | 576 | 580 | 133.8 |
| C | 15 | 214 | 241705 | 1802.12 | 576 | 580 | 133.8 |
| C | 2 | 16 | 7803 | 53.98 | 576 | 580 | 133.8 |
| D | 1 | 52 | 705168 | 5017.01 | 574 | 557 | 140.4 |
| D | 2 | 249 | 222073 | 1577.25 | 574 | 557 | 140.4 |
| D | 13 | 249 | 157138 | 1114.9 | 574 | 557 | 140.4 |
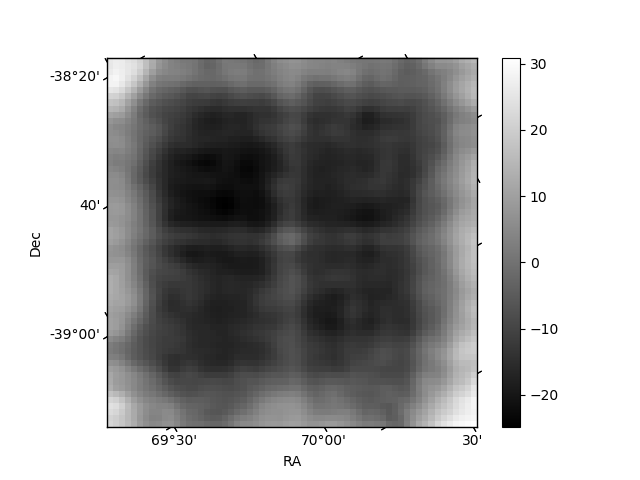
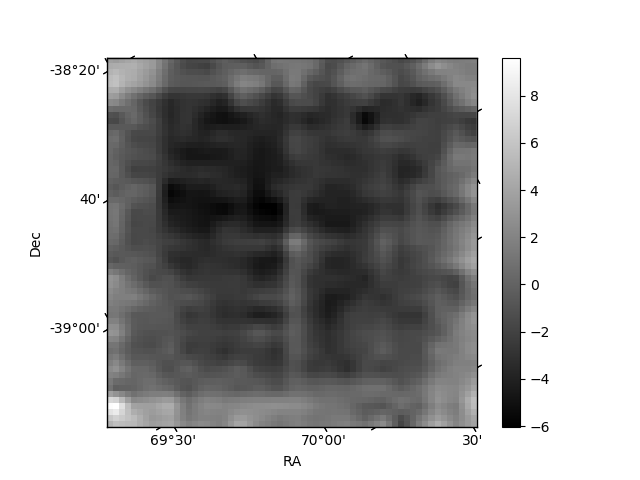
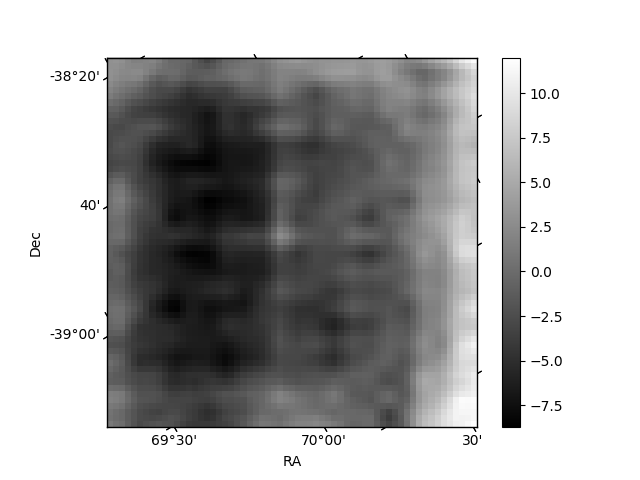
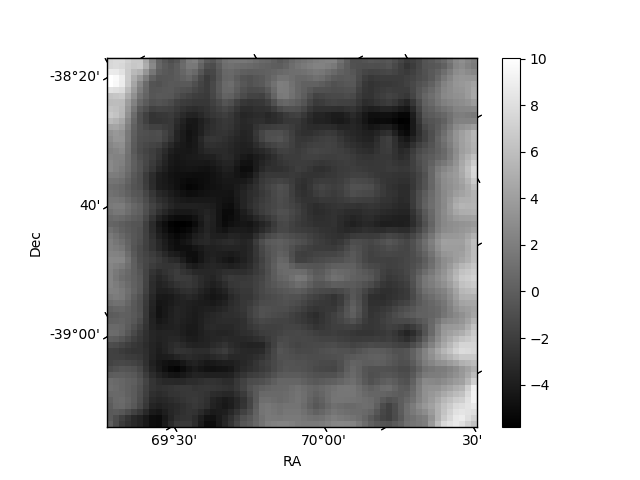
Histogram calculated using DETX and DETY for each event in the final _common_clean file
| Quadrant A | 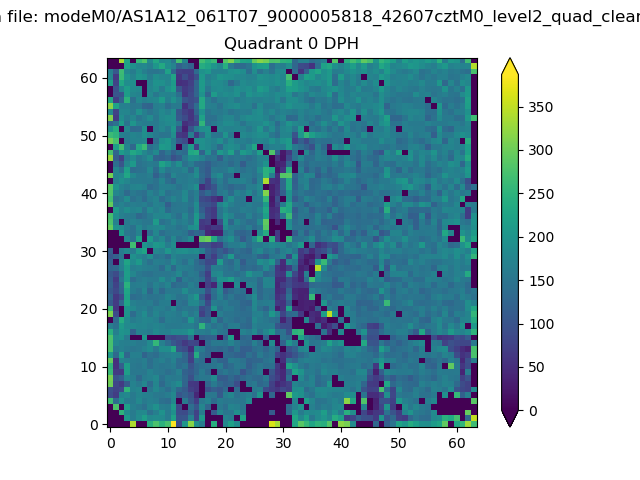 |
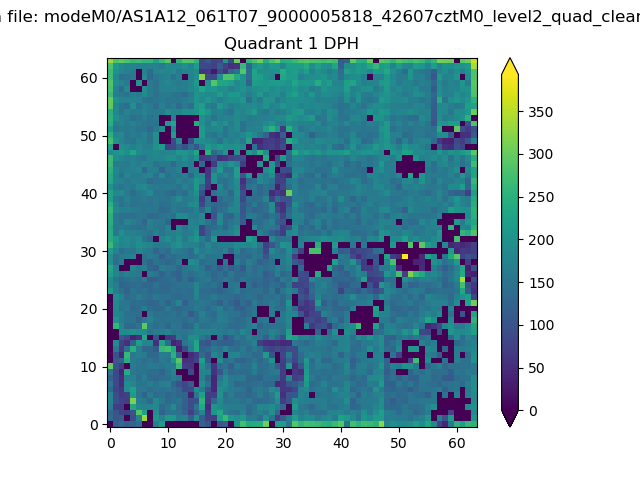 |
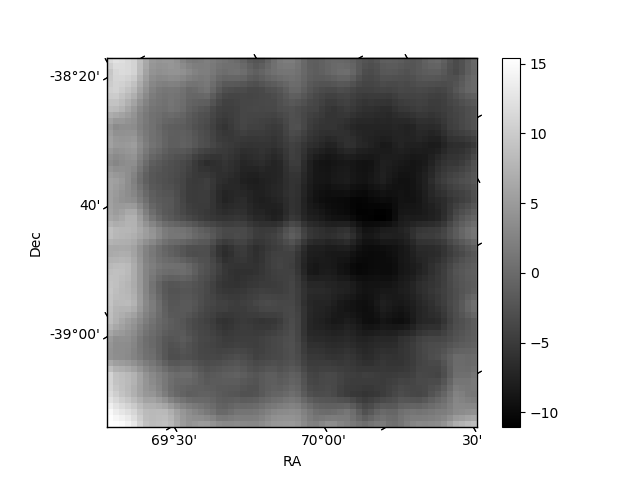
Quadrant B |
|---|---|---|---|
| Quadrant D | 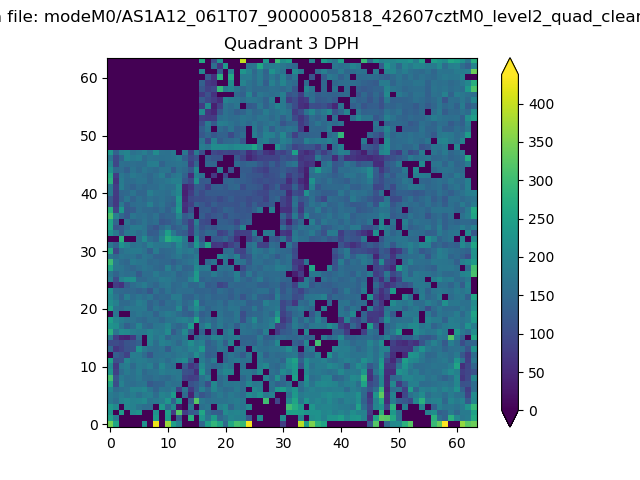 |
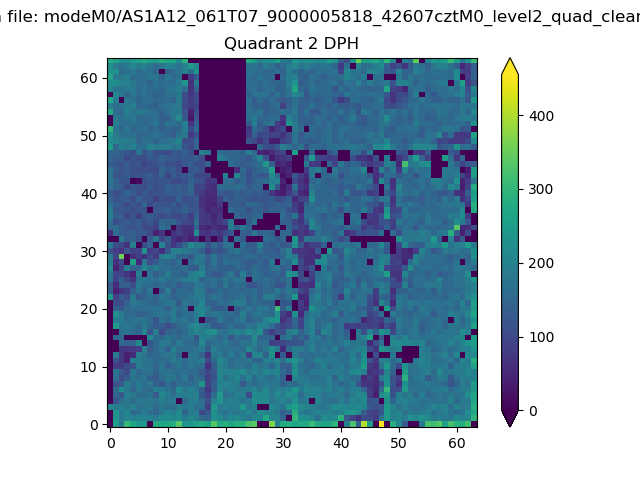 |
Quadrant C |
| Plot type | Count rate plots | Images |
|---|---|---|
| Comparison with Poisson distribution Blue bars denote a histogram of data divided into 1 sec bins. Red curve is a Poisson curve with rate = median count rate of data. |
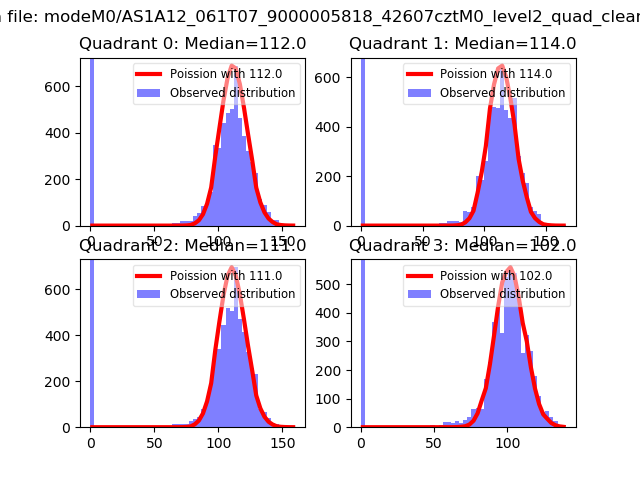 |
 |
| Quadrant-wise count rates Data is divided into 100 sec bins |
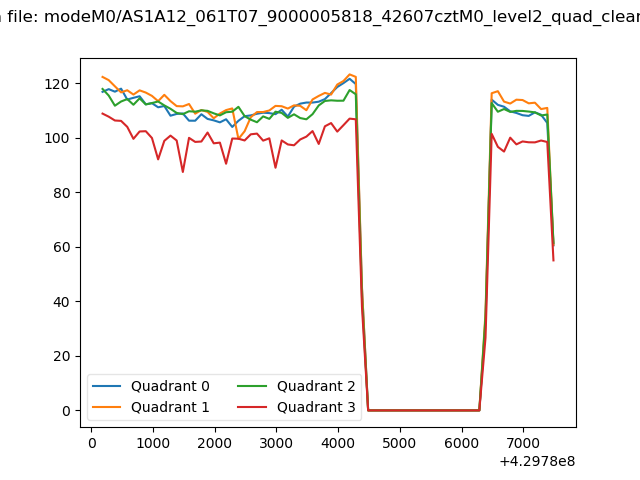 |
|
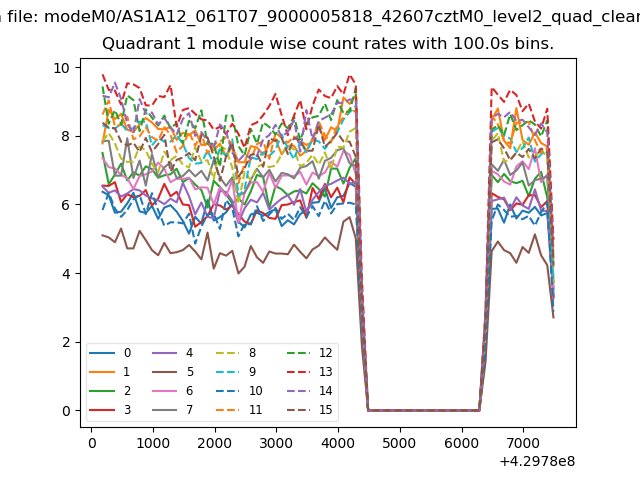
| Module-wise count rates for Quadrant A Data is divided into 100 sec bins |
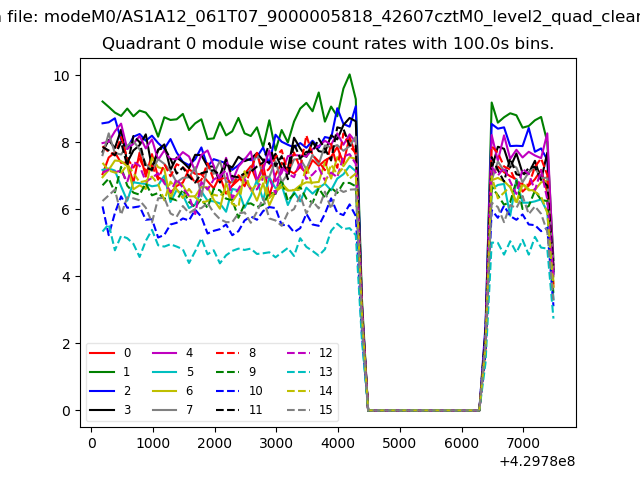 |
 |
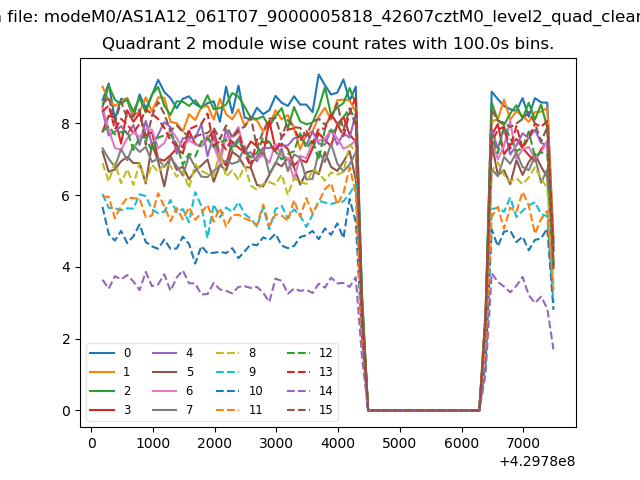
| Module-wise count rates for Quadrant B Data is divided into 100 sec bins |
 |
 |
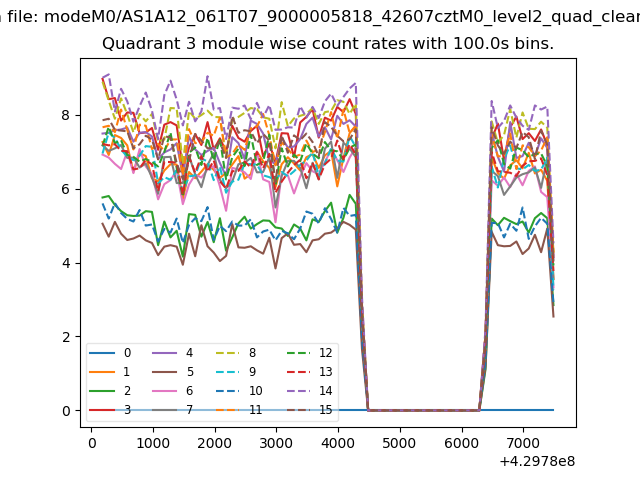
| Module-wise count rates for Quadrant C Data is divided into 100 sec bins |
 |
 |
| Module-wise count rates for Quadrant D Data is divided into 100 sec bins |
 |
 |
| Parameter | Plot |
|---|---|
| CZT HV Monitor | 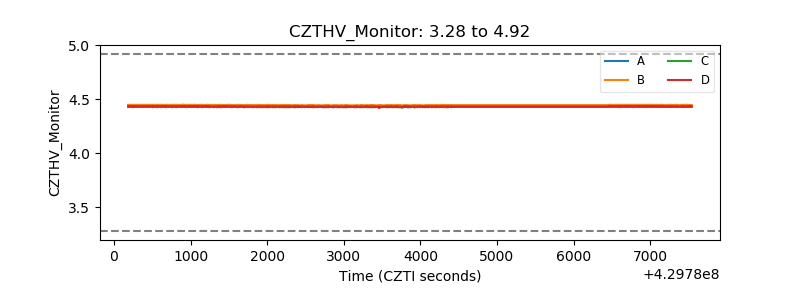 |
| D_VDD | 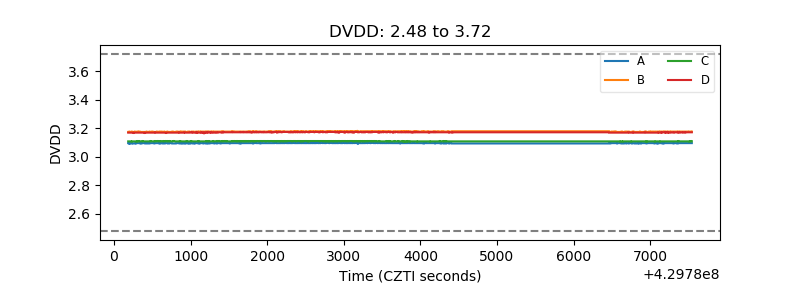 |
| Temperature 1 | 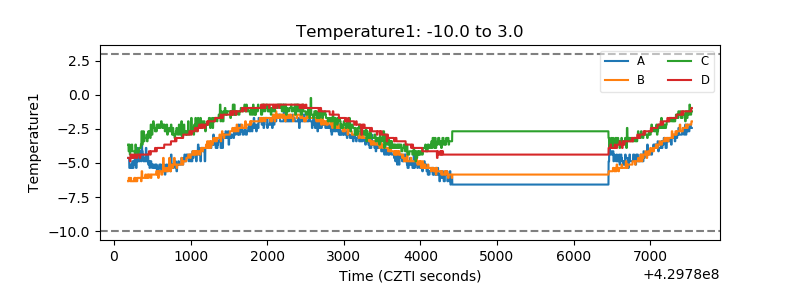 |
| Veto HV Monitor | 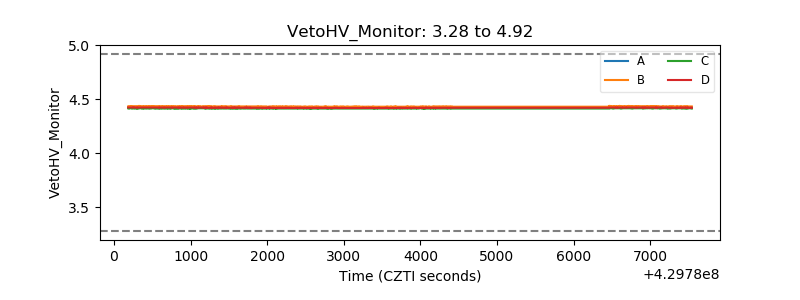 |
| Veto LLD | 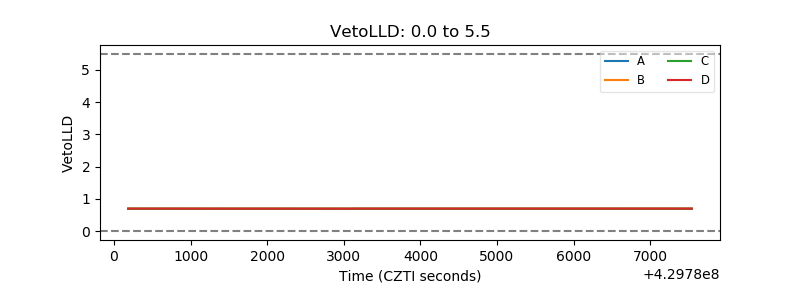 |
| Alpha Counter |  |
| _CPM_Rate | 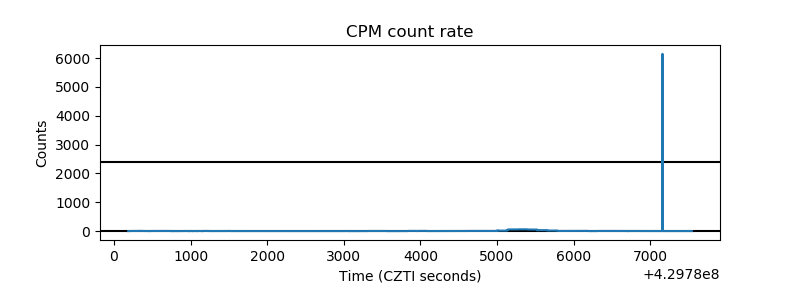 |
| CZT Counter | 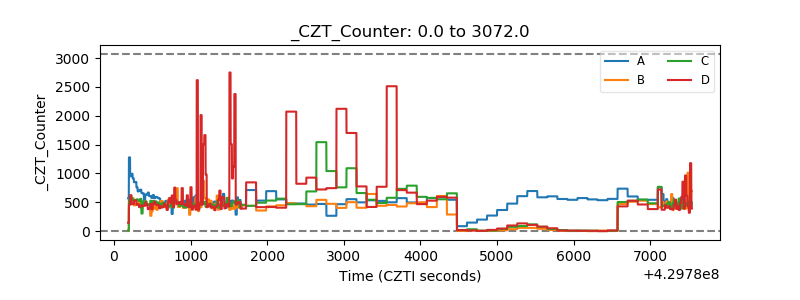 |
| +2.5 Volts monitor | 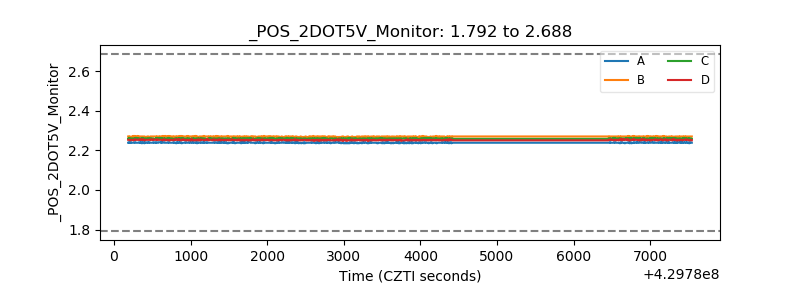 |
| +5 Volts monitor | 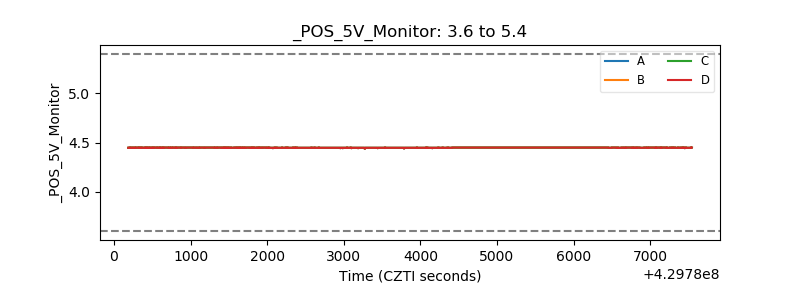 |
| _ROLL_ROT | 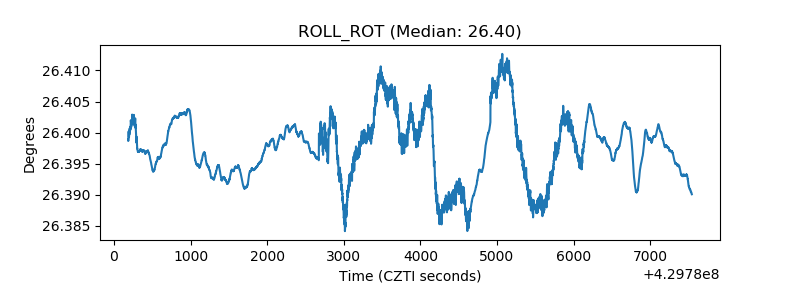 |
| _Roll_DEC | 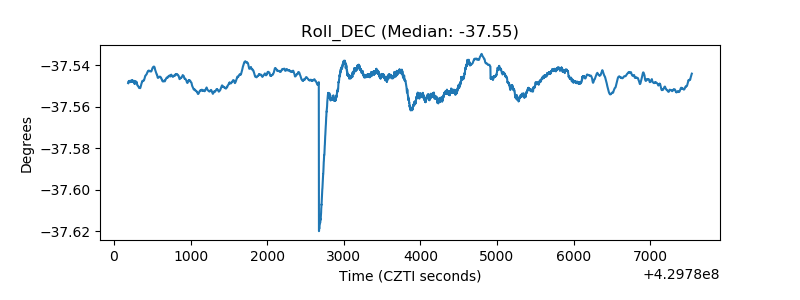 |
| _Roll_RA | 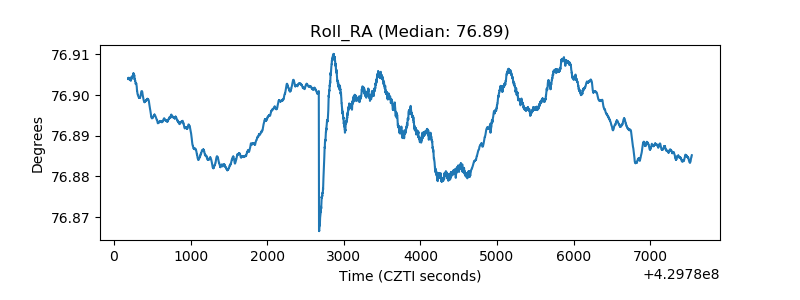 |
| Veto Counter | 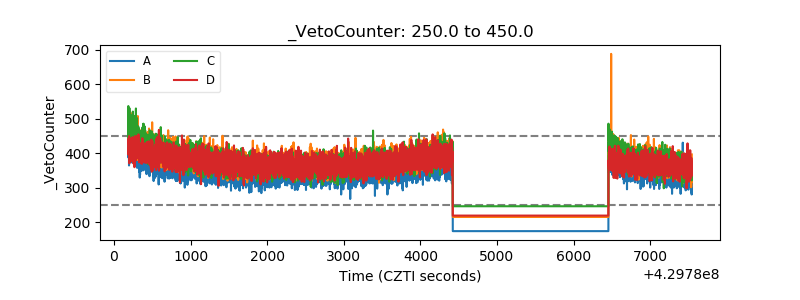 |