| Param | Original file | Final file |
|---|---|---|
| Filename | modeM0/AS1A12_061T07_9000005818_42609cztM0_level2.fits | modeM0/AS1A12_061T07_9000005818_42609cztM0_level2_quad_clean.evt |
| Size (bytes) | 376,303,680 | 89,072,640 |
| Size | 358.9 MB | 84.9 MB |
| Events in quadrant A | 2,915,774 | 597,520 |
| Events in quadrant B | 2,671,321 | 611,328 |
| Events in quadrant C | 3,690,589 | 592,212 |
| Events in quadrant D | 4,217,933 | 505,960 |
| Mode M0 | |||
|---|---|---|---|
| Quadrant | BADHDUFLAG | Total packets | Discarded packets |
| A | 0 | 11772 | 1 |
| B | 0 | 11751 | 1 |
| C | 0 | 14453 | 1 |
| D | 0 | 16334 | 1 |
| Mode SS | |||
|---|---|---|---|
| Quadrant | BADHDUFLAG | Total packets | Discarded packets |
| A | 0 | 114 | 0 |
| B | 0 | 114 | 0 |
| C | 0 | 114 | 0 |
| D | 0 | 114 | 0 |
| Mode M9 | |||
|---|---|---|---|
| Quadrant | BADHDUFLAG | Total packets | Discarded packets |
| A | 0 | 14 | 0 |
| B | 0 | 14 | 0 |
| C | 0 | 14 | 0 |
| D | 0 | 14 | 0 |
| Quadrant | Total seconds | Saturated seconds | Saturation percentage |
|---|---|---|---|
| A | 5574 | 9 | 0.161464% |
| B | 5575 | 24 | 0.430493% |
| C | 5575 | 53 | 0.950673% |
| D | 5575 | 495 | 8.878924% |
Noise dominated data is calculated using 1-second bins in cleaned event files. If a bin has >2000 counts, and if more than 50% of those come from <1% of pixels, then it is considered to be noise-dominated and hence unusable.
| Quadrant | # 1 sec bins | Bins with >0 counts | Bins with >2000 counts | High rate bins dominated by noise | Noise dominated (total time) | Noise dominated (detector-on time) | Marked lightcurve |
|---|---|---|---|---|---|---|---|
| A | 6977 | 5575 | 3 | 3 | 0.04% | 0.05% | 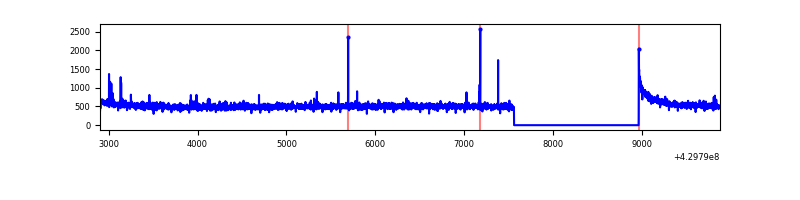 |
| B | 6978 | 5576 | 9 | 9 | 0.13% | 0.16% | 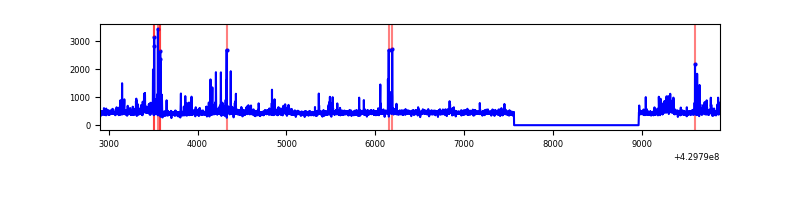 |
| C | 6978 | 5576 | 65 | 65 | 0.93% | 1.17% | 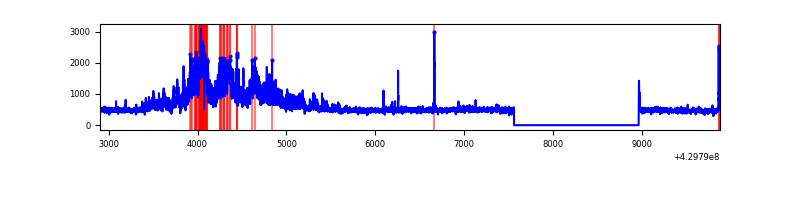 |
| D | 6978 | 5576 | 484 | 484 | 6.94% | 8.68% | 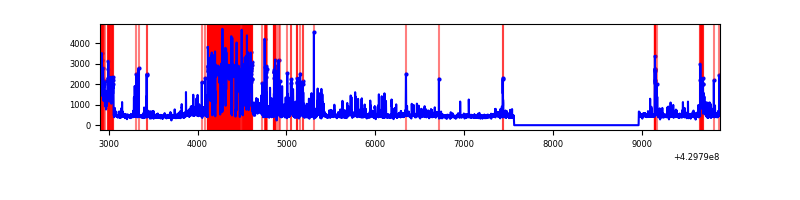 |
Top three noisy pixels from each quadrant. If the there are fewer than three noisy pixels in the level2.evt file, extra rows are filled as -1
| Pixel properties | Quadrant properties | ||||||
|---|---|---|---|---|---|---|---|
| Quadrant | DetID | PixID | Counts | Sigma | Mean | Median | Sigma |
| A | 10 | 83 | 530480 | 4214.77 | 606 | 593 | 125.7 |
| A | 13 | 248 | 13854 | 105.48 | 606 | 593 | 125.7 |
| A | 2 | 79 | 11537 | 87.05 | 606 | 593 | 125.7 |
| B | 0 | 245 | 99450 | 844.62 | 602 | 586 | 117.1 |
| B | 5 | 172 | 49762 | 420.12 | 602 | 586 | 117.1 |
| B | 15 | 33 | 45268 | 381.73 | 602 | 586 | 117.1 |
| C | 3 | 233 | 1113170 | 8061.66 | 591 | 593 | 138.0 |
| C | 15 | 214 | 229313 | 1657.29 | 591 | 593 | 138.0 |
| C | 14 | 254 | 18118 | 126.99 | 591 | 593 | 138.0 |
| D | 1 | 52 | 1791571 | 12798.73 | 568 | 552 | 139.9 |
| D | 1 | 47 | 111499 | 792.83 | 568 | 552 | 139.9 |
| D | 2 | 234 | 29692 | 208.23 | 568 | 552 | 139.9 |
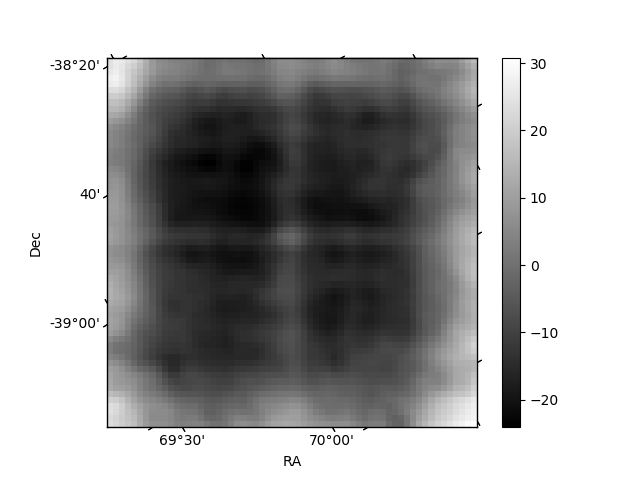
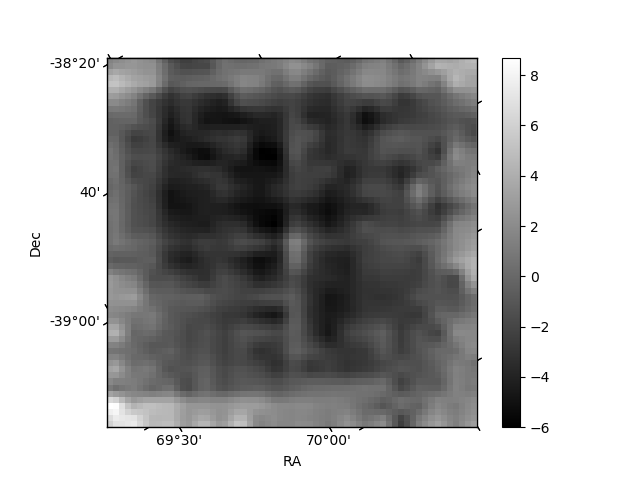
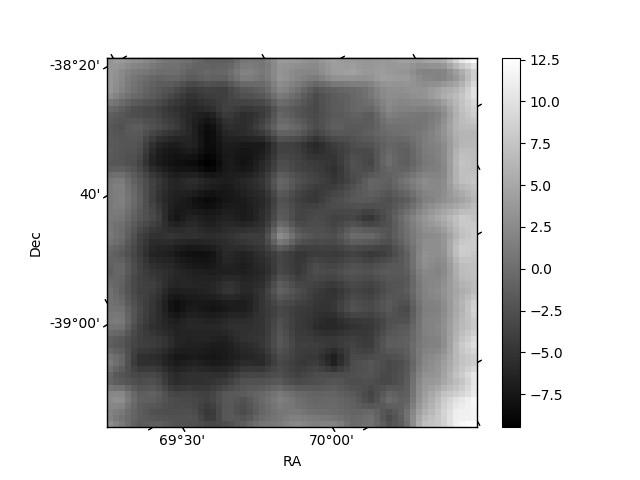
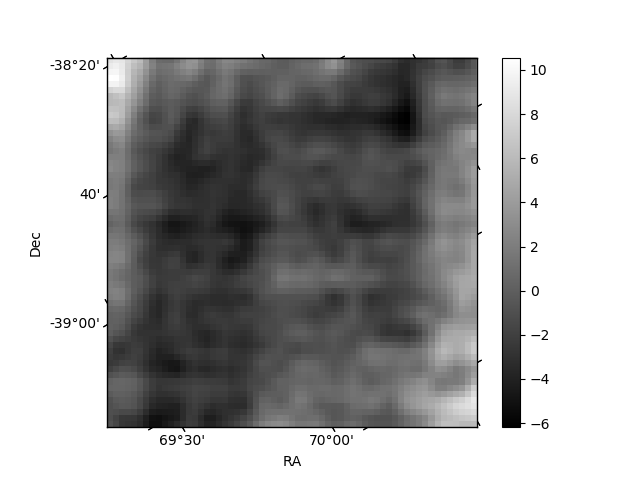
Histogram calculated using DETX and DETY for each event in the final _common_clean file
| Quadrant A | 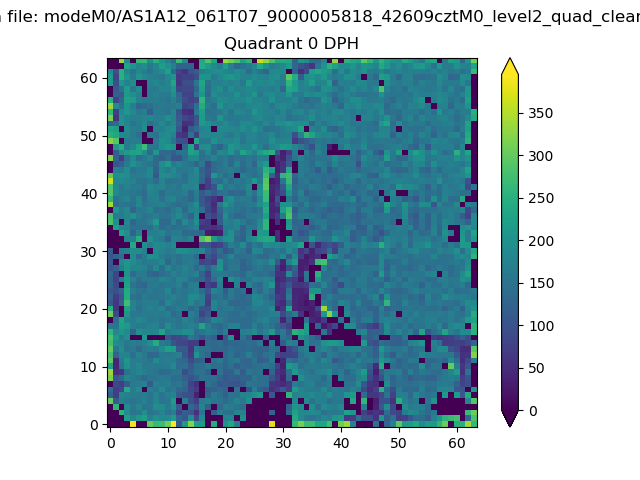 |
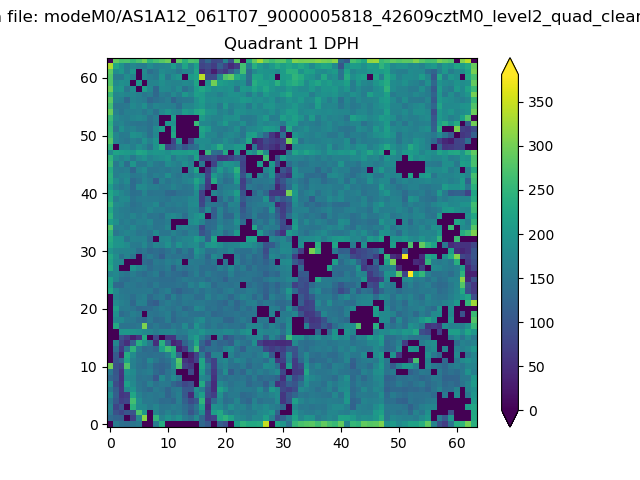 |
Quadrant B |
|---|---|---|---|
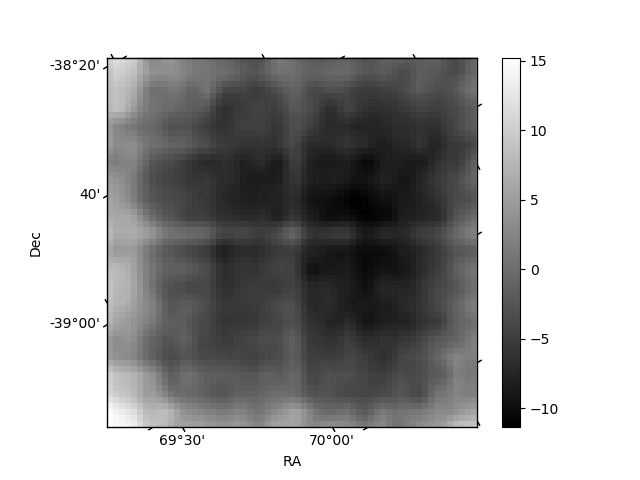
| Quadrant D | 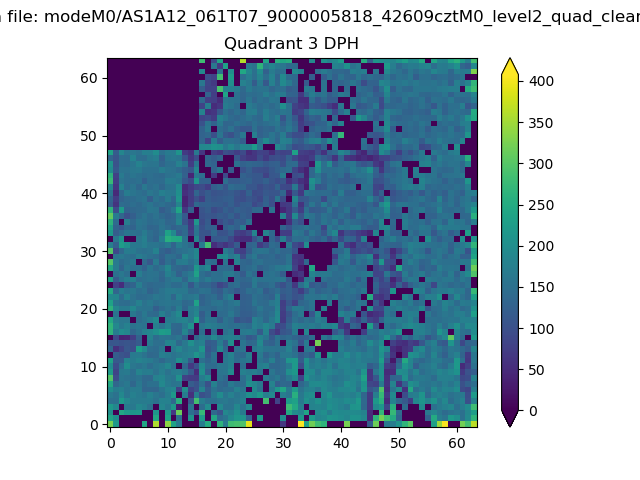 |
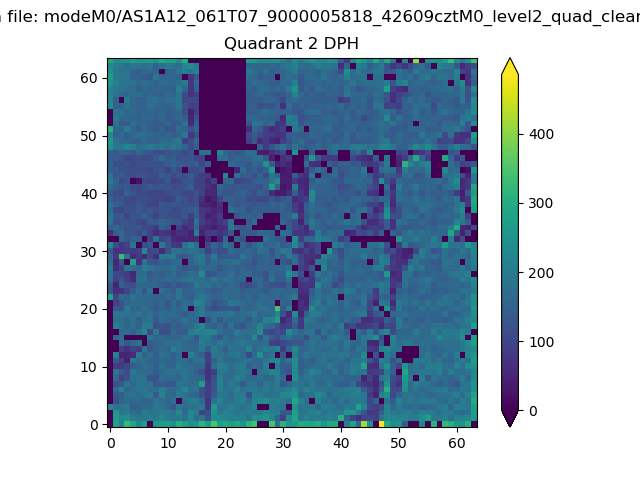 |
Quadrant C |
| Plot type | Count rate plots | Images |
|---|---|---|
| Comparison with Poisson distribution Blue bars denote a histogram of data divided into 1 sec bins. Red curve is a Poisson curve with rate = median count rate of data. |
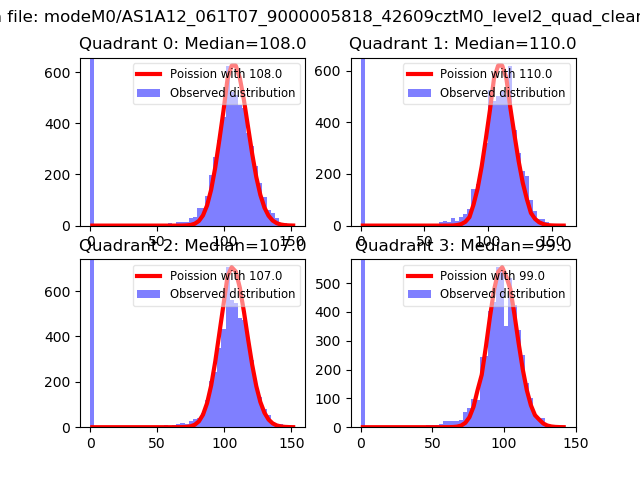 |
 |
| Quadrant-wise count rates Data is divided into 100 sec bins |
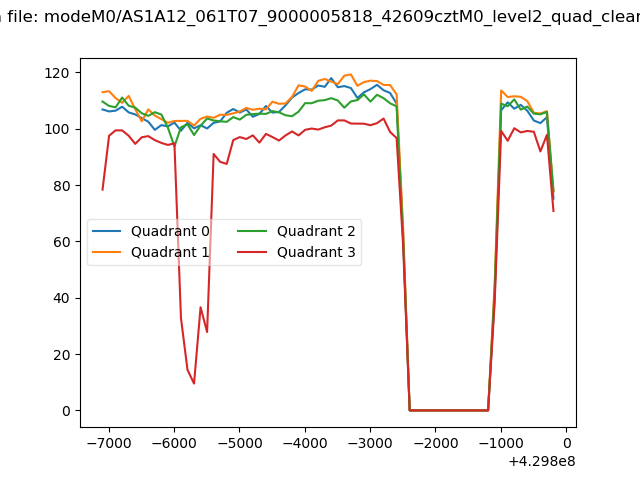 |
|
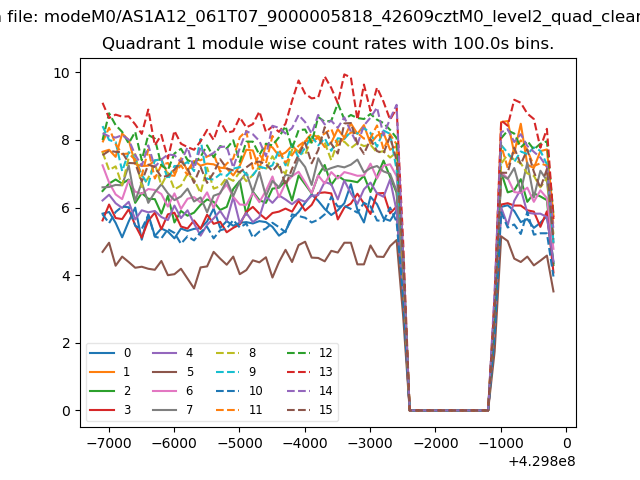
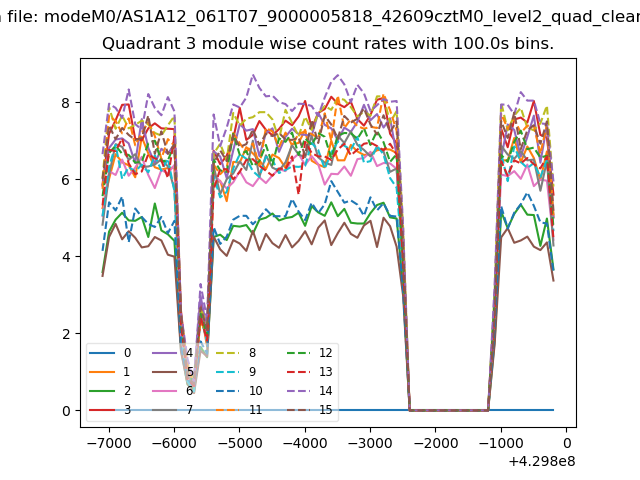
| Module-wise count rates for Quadrant A Data is divided into 100 sec bins |
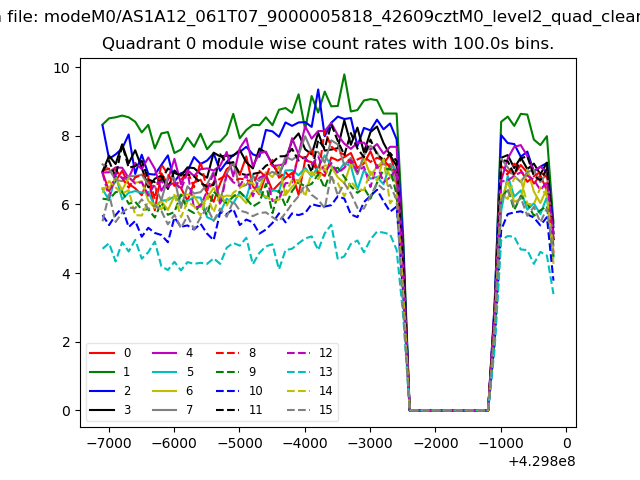 |
 |
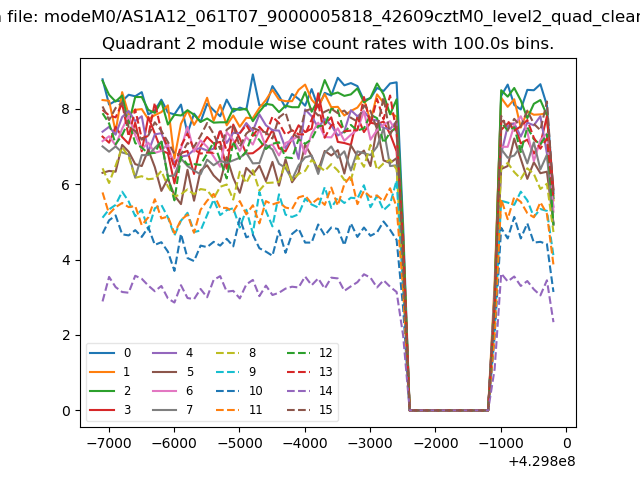
| Module-wise count rates for Quadrant B Data is divided into 100 sec bins |
 |
 |
| Module-wise count rates for Quadrant C Data is divided into 100 sec bins |
 |
 |
| Module-wise count rates for Quadrant D Data is divided into 100 sec bins |
 |
 |
| Parameter | Plot |
|---|---|
| CZT HV Monitor | 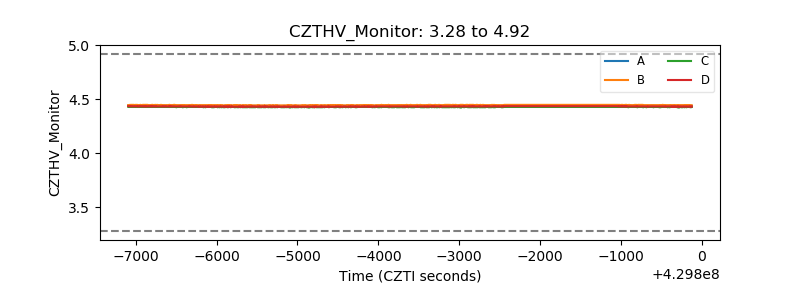 |
| D_VDD | 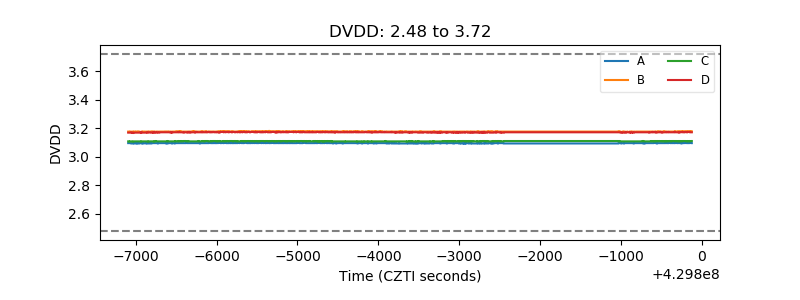 |
| Temperature 1 | 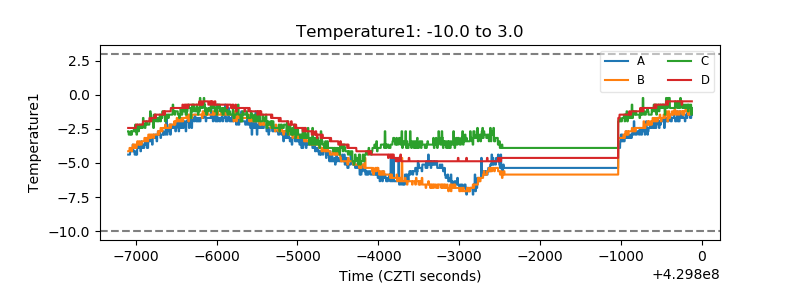 |
| Veto HV Monitor | 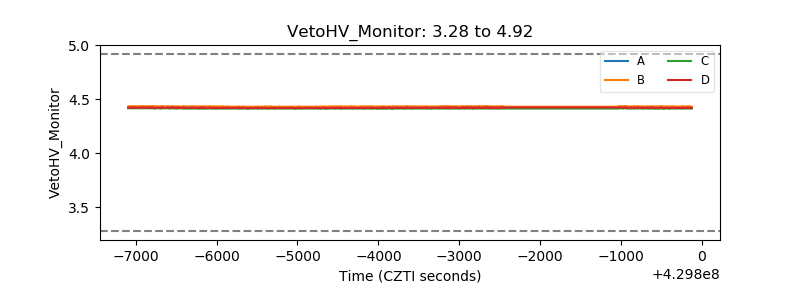 |
| Veto LLD | 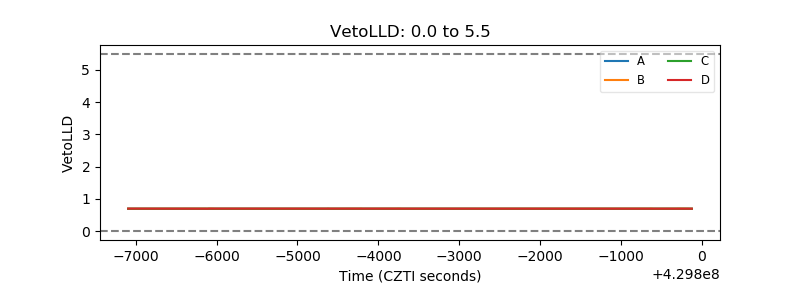 |
| Alpha Counter | 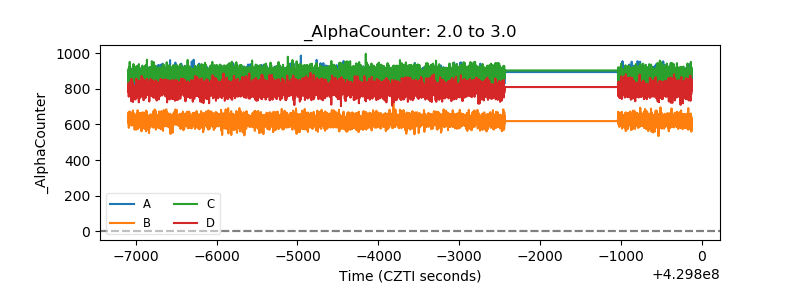 |
| _CPM_Rate | 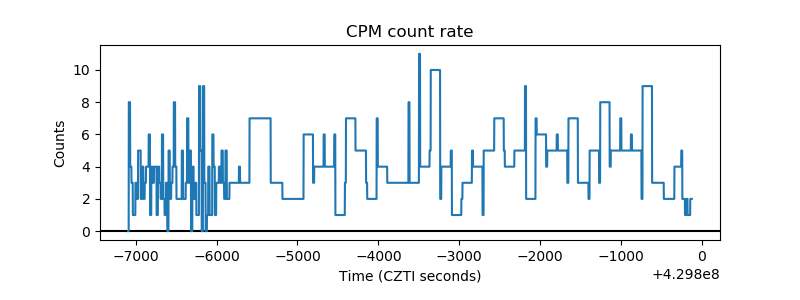 |
| CZT Counter | 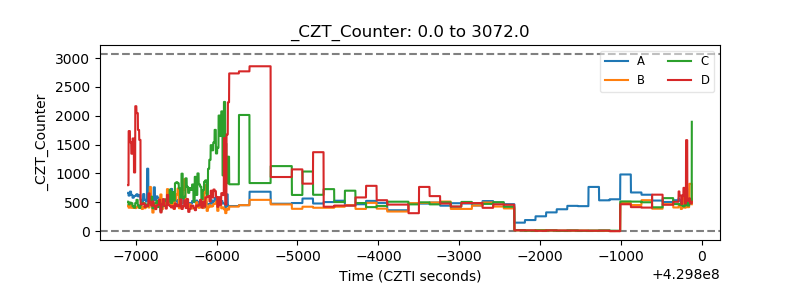 |
| +2.5 Volts monitor | 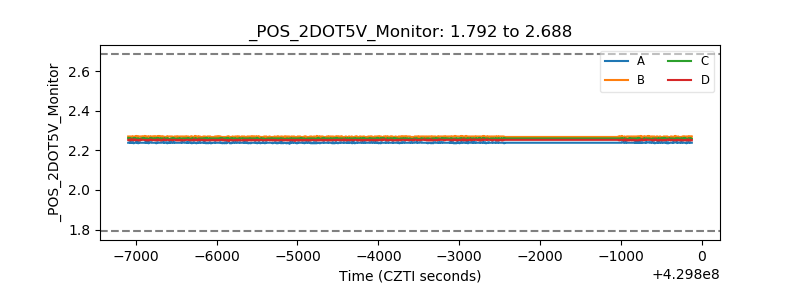 |
| +5 Volts monitor | 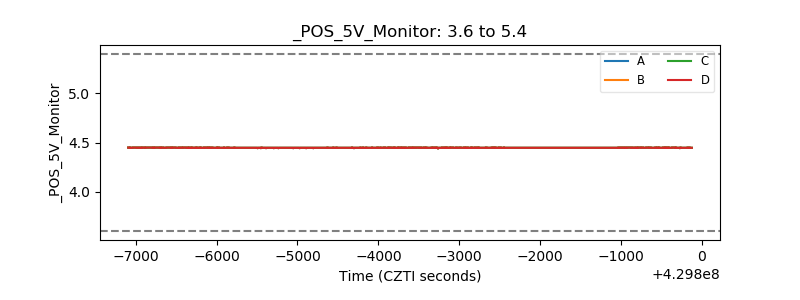 |
| _ROLL_ROT | 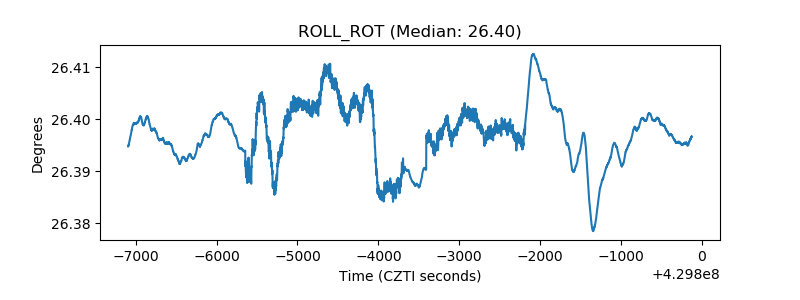 |
| _Roll_DEC | 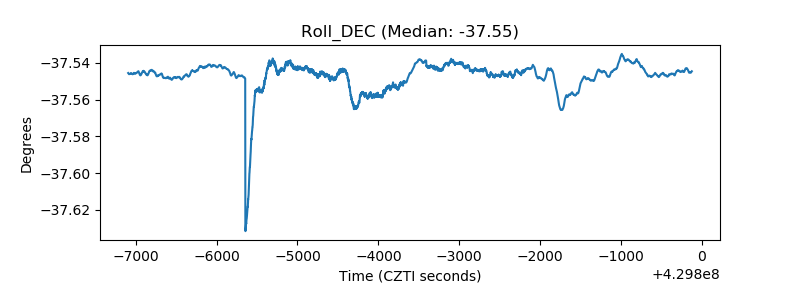 |
| _Roll_RA | 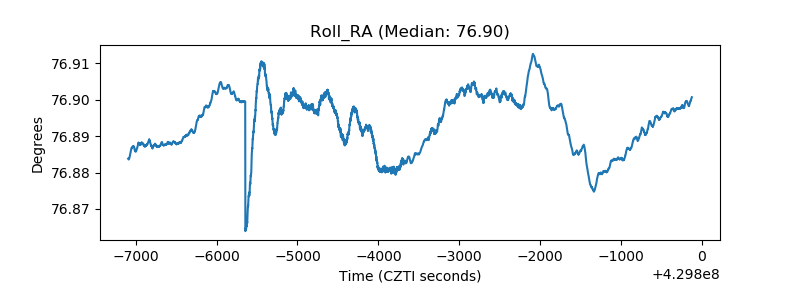 |
| Veto Counter | 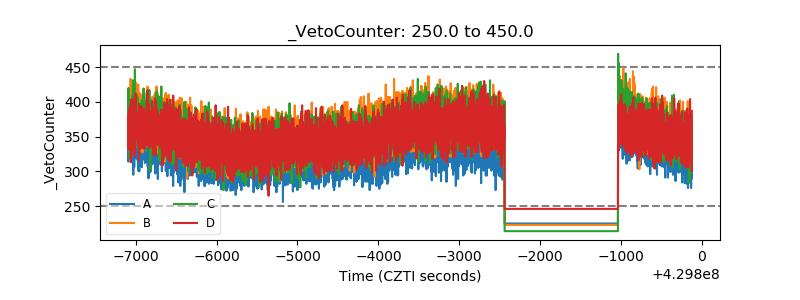 |