| Param | Original file | Final file |
|---|---|---|
| Filename | modeM0/AS1A12_061T07_9000005818_42610cztM0_level2.fits | modeM0/AS1A12_061T07_9000005818_42610cztM0_level2_quad_clean.evt |
| Size (bytes) | 366,324,480 | 94,550,400 |
| Size | 349.4 MB | 90.2 MB |
| Events in quadrant A | 3,198,438 | 628,578 |
| Events in quadrant B | 2,987,106 | 639,218 |
| Events in quadrant C | 2,834,628 | 624,745 |
| Events in quadrant D | 4,080,901 | 558,216 |
| Mode M0 | |||
|---|---|---|---|
| Quadrant | BADHDUFLAG | Total packets | Discarded packets |
| A | 0 | 12903 | 2 |
| B | 0 | 12811 | 2 |
| C | 0 | 12087 | 2 |
| D | 0 | 16152 | 2 |
| Mode SS | |||
|---|---|---|---|
| Quadrant | BADHDUFLAG | Total packets | Discarded packets |
| A | 0 | 120 | 0 |
| B | 0 | 120 | 0 |
| C | 0 | 120 | 0 |
| D | 0 | 120 | 0 |
| Mode M9 | |||
|---|---|---|---|
| Quadrant | BADHDUFLAG | Total packets | Discarded packets |
| A | 0 | 20 | 0 |
| B | 0 | 21 | 0 |
| C | 0 | 21 | 0 |
| D | 0 | 21 | 0 |
| Quadrant | Total seconds | Saturated seconds | Saturation percentage |
|---|---|---|---|
| A | 5897 | 14 | 0.237409% |
| B | 5897 | 52 | 0.881804% |
| C | 5897 | 12 | 0.203493% |
| D | 5897 | 265 | 4.493810% |
Noise dominated data is calculated using 1-second bins in cleaned event files. If a bin has >2000 counts, and if more than 50% of those come from <1% of pixels, then it is considered to be noise-dominated and hence unusable.
| Quadrant | # 1 sec bins | Bins with >0 counts | Bins with >2000 counts | High rate bins dominated by noise | Noise dominated (total time) | Noise dominated (detector-on time) | Marked lightcurve |
|---|---|---|---|---|---|---|---|
| A | 7208 | 5898 | 3 | 3 | 0.04% | 0.05% |  |
| B | 7208 | 5898 | 29 | 29 | 0.40% | 0.49% | 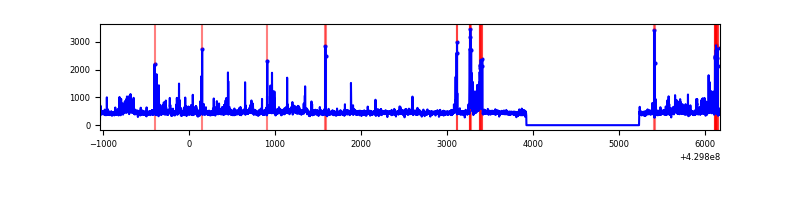 |
| C | 7208 | 5898 | 11 | 11 | 0.15% | 0.19% | 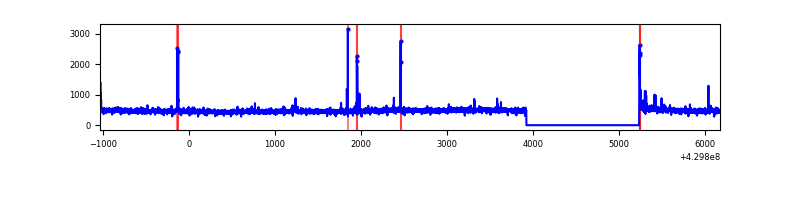 |
| D | 7208 | 5898 | 238 | 238 | 3.30% | 4.04% | 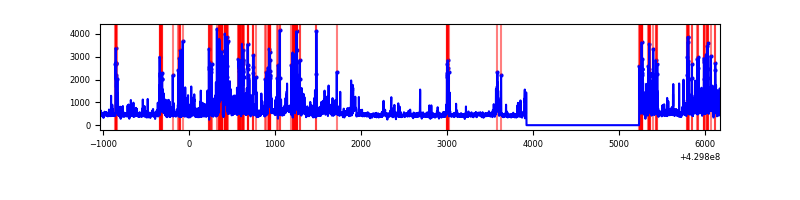 |
Top three noisy pixels from each quadrant. If the there are fewer than three noisy pixels in the level2.evt file, extra rows are filled as -1
| Pixel properties | Quadrant properties | ||||||
|---|---|---|---|---|---|---|---|
| Quadrant | DetID | PixID | Counts | Sigma | Mean | Median | Sigma |
| A | 10 | 83 | 627250 | 4698.15 | 642 | 626 | 133.4 |
| A | 7 | 3 | 64426 | 478.34 | 642 | 626 | 133.4 |
| A | 13 | 6 | 12391 | 88.21 | 642 | 626 | 133.4 |
| B | 3 | 112 | 140049 | 1126.74 | 635 | 616 | 123.7 |
| B | 0 | 245 | 89725 | 720.07 | 635 | 616 | 123.7 |
| B | 15 | 32 | 63154 | 505.36 | 635 | 616 | 123.7 |
| C | 15 | 214 | 246527 | 1662.9 | 626 | 629 | 147.9 |
| C | 3 | 233 | 89158 | 598.68 | 626 | 629 | 147.9 |
| C | 14 | 254 | 31953 | 211.83 | 626 | 629 | 147.9 |
| D | 1 | 52 | 573380 | 3810.99 | 618 | 600 | 150.3 |
| D | 13 | 249 | 389143 | 2585.17 | 618 | 600 | 150.3 |
| D | 12 | 233 | 216367 | 1435.61 | 618 | 600 | 150.3 |
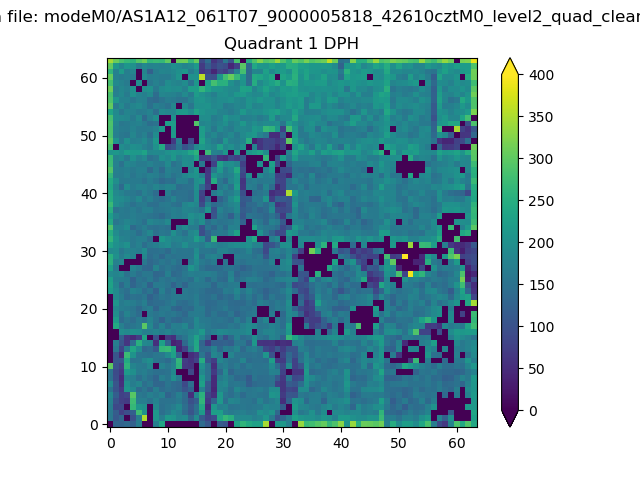
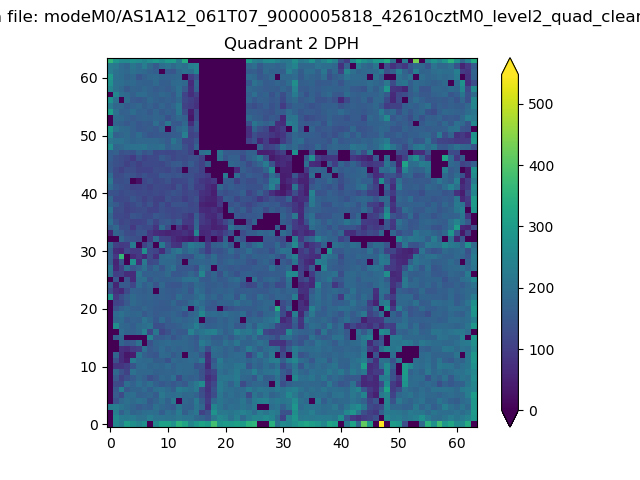
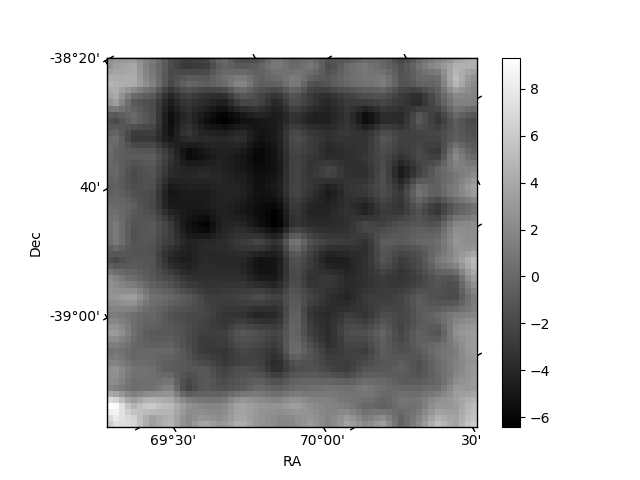
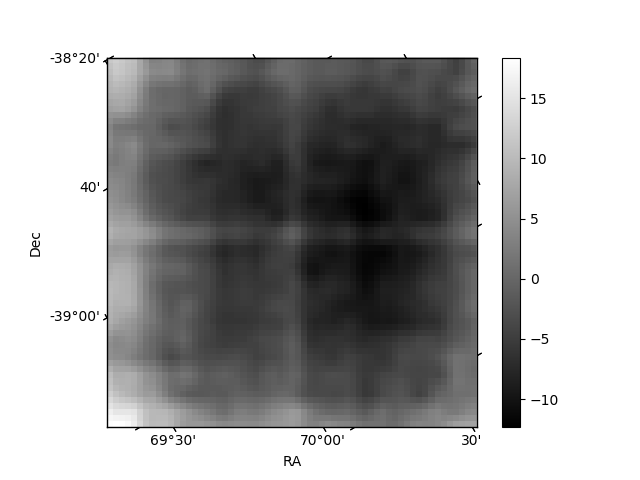
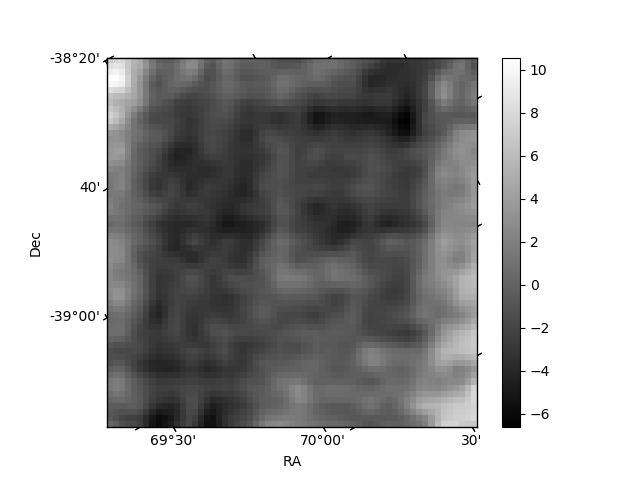
Histogram calculated using DETX and DETY for each event in the final _common_clean file
| Quadrant A | 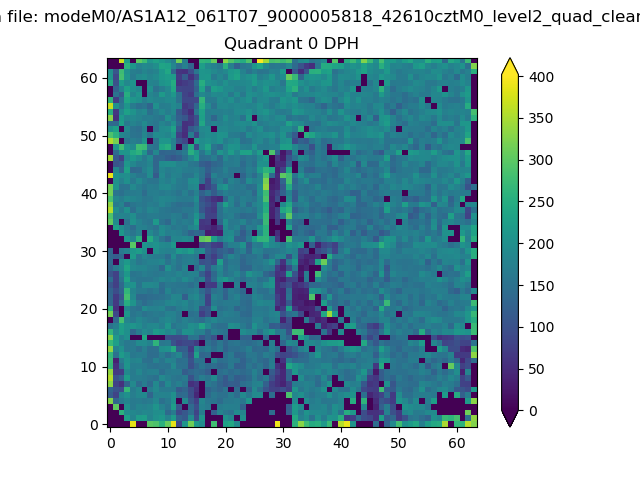 |
 |
Quadrant B |
|---|---|---|---|
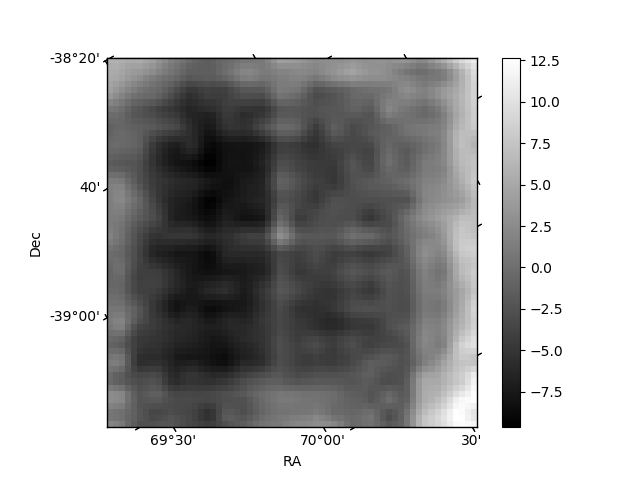
| Quadrant D | 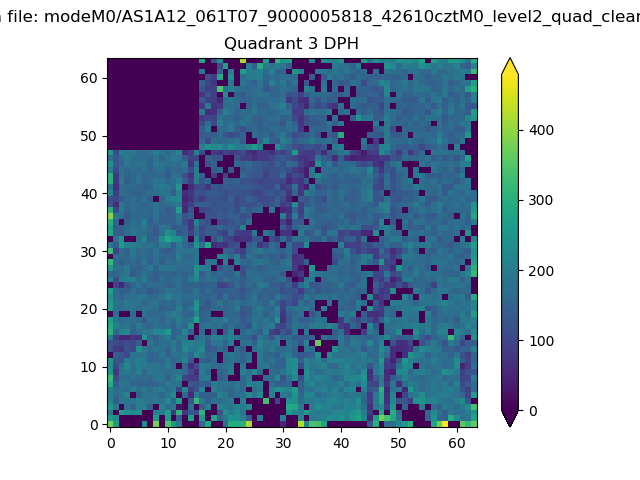 |
 |
Quadrant C |
| Plot type | Count rate plots | Images |
|---|---|---|
| Comparison with Poisson distribution Blue bars denote a histogram of data divided into 1 sec bins. Red curve is a Poisson curve with rate = median count rate of data. |
 |
 |
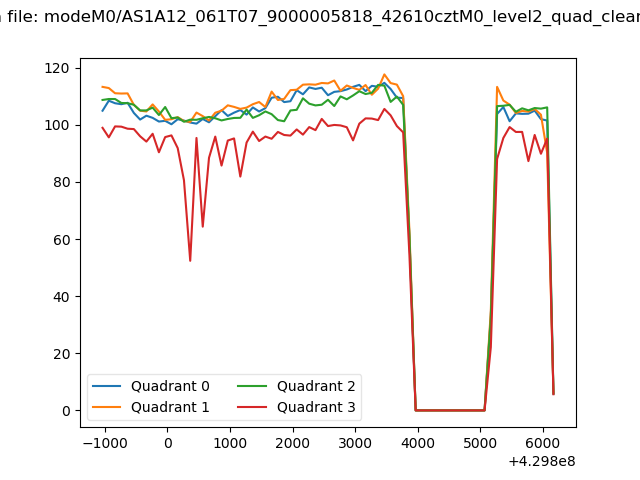
| Quadrant-wise count rates Data is divided into 100 sec bins |
 |
|
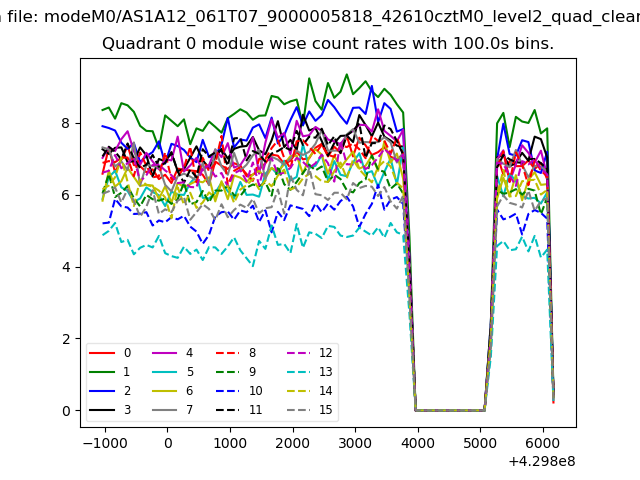
| Module-wise count rates for Quadrant A Data is divided into 100 sec bins |
 |
 |
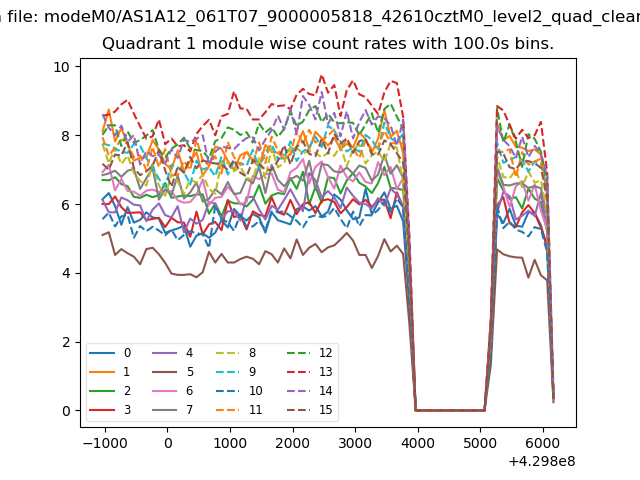
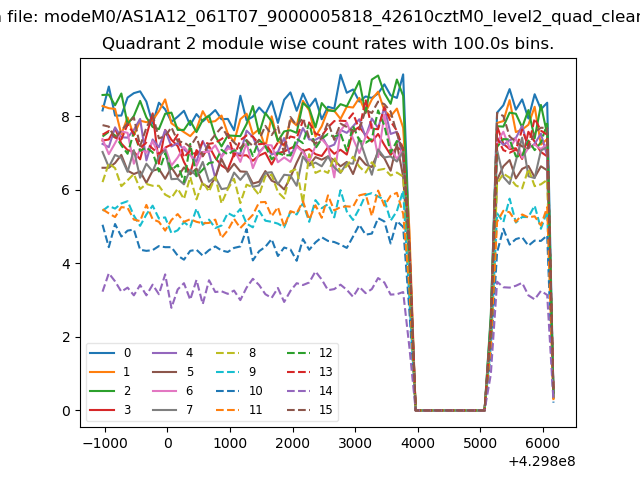
| Module-wise count rates for Quadrant B Data is divided into 100 sec bins |
 |
 |
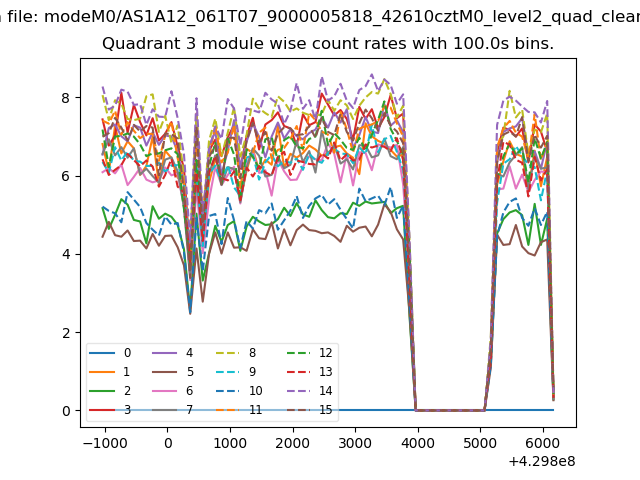
| Module-wise count rates for Quadrant C Data is divided into 100 sec bins |
 |
 |
| Module-wise count rates for Quadrant D Data is divided into 100 sec bins |
 |
 |
| Parameter | Plot |
|---|---|
| CZT HV Monitor | 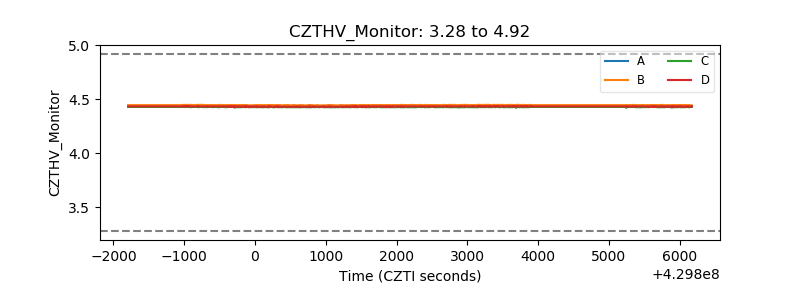 |
| D_VDD | 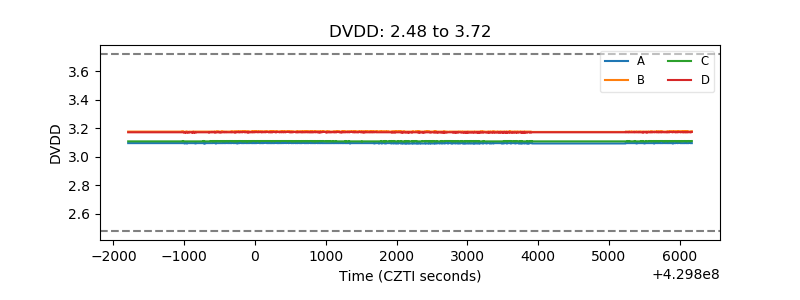 |
| Temperature 1 | 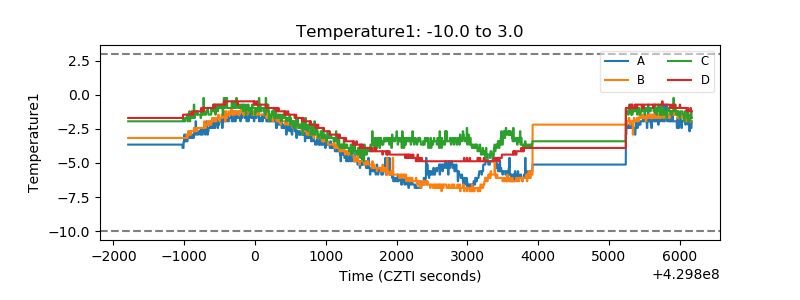 |
| Veto HV Monitor | 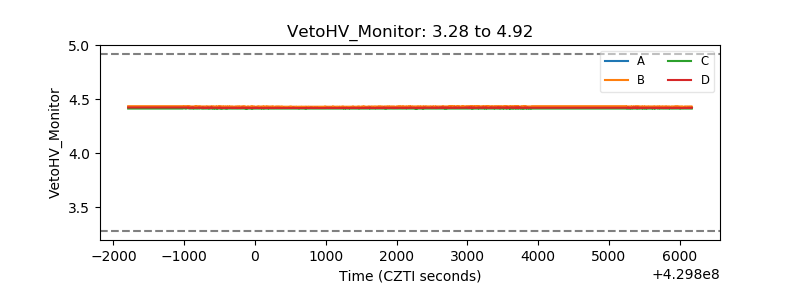 |
| Veto LLD | 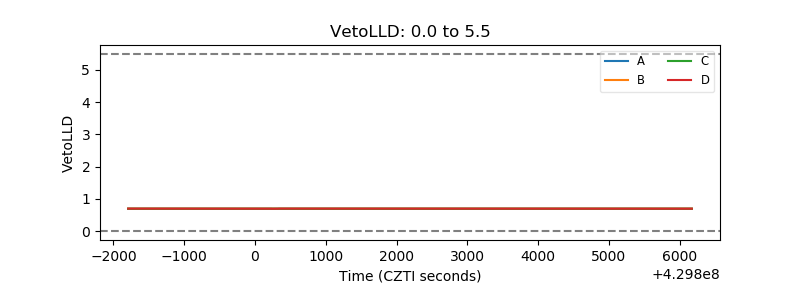 |
| Alpha Counter | 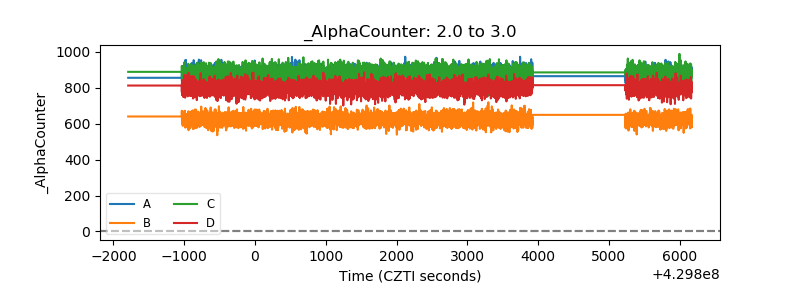 |
| _CPM_Rate | 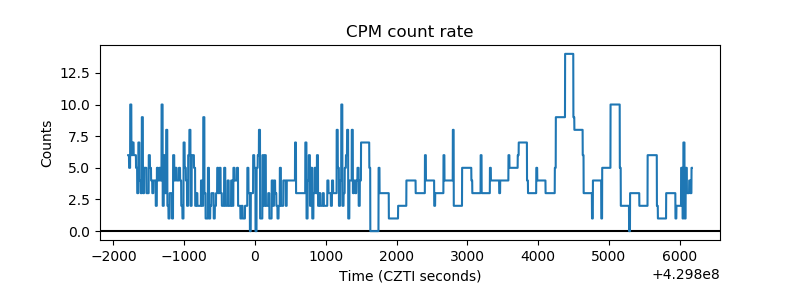 |
| CZT Counter | 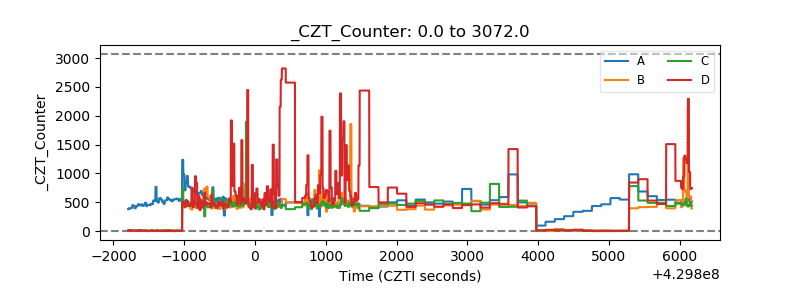 |
| +2.5 Volts monitor | 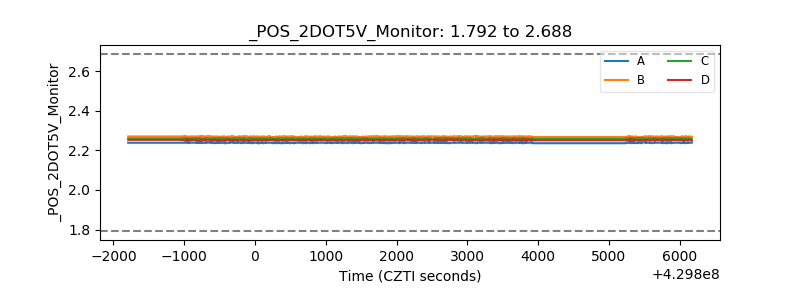 |
| +5 Volts monitor | 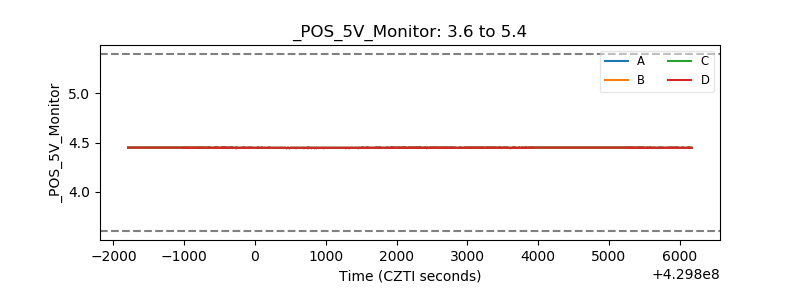 |
| _ROLL_ROT | 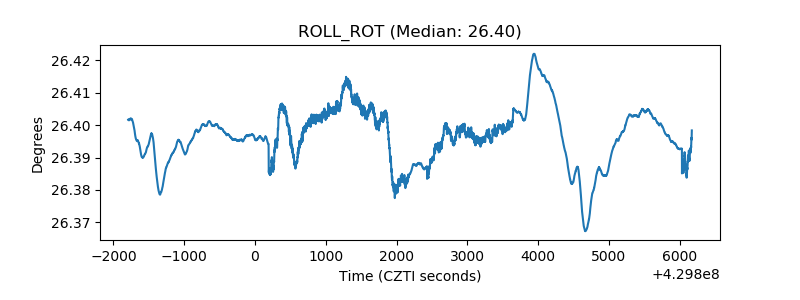 |
| _Roll_DEC | 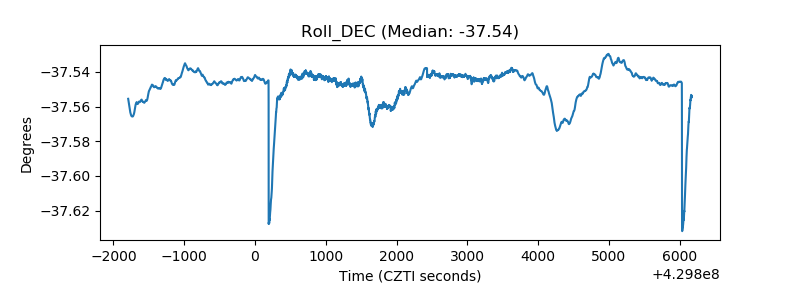 |
| _Roll_RA | 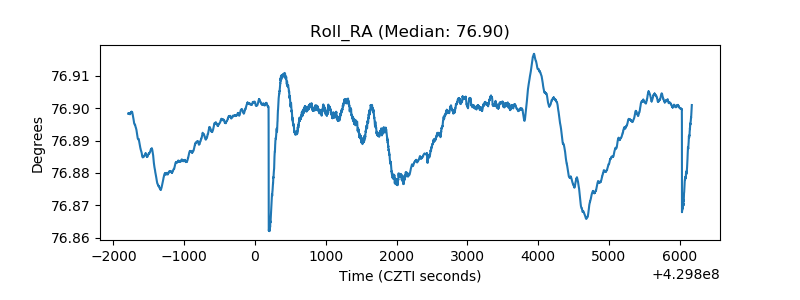 |
| Veto Counter | 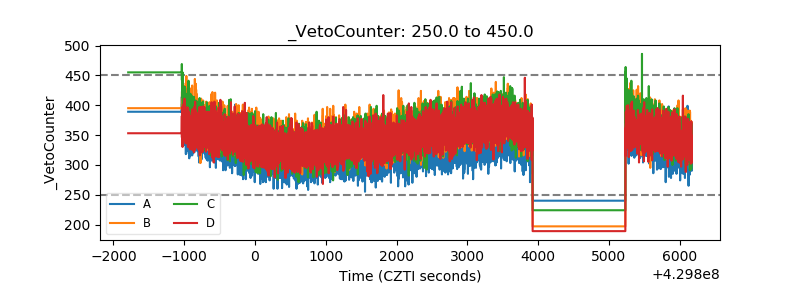 |