| Param | Original file | Final file |
|---|---|---|
| Filename | modeM0/AS1A12_061T07_9000005818_42613cztM0_level2.fits | modeM0/AS1A12_061T07_9000005818_42613cztM0_level2_quad_clean.evt |
| Size (bytes) | 983,329,920 | 245,954,880 |
| Size | 937.8 MB | 234.6 MB |
| Events in quadrant A | 8,086,340 | 1,639,595 |
| Events in quadrant B | 7,579,528 | 1,679,541 |
| Events in quadrant C | 7,574,343 | 1,616,848 |
| Events in quadrant D | 11,958,361 | 1,440,209 |
| Mode M0 | |||
|---|---|---|---|
| Quadrant | BADHDUFLAG | Total packets | Discarded packets |
| A | 0 | 33166 | 4 |
| B | 0 | 33448 | 4 |
| C | 0 | 32155 | 4 |
| D | 0 | 46335 | 4 |
| Mode SS | |||
|---|---|---|---|
| Quadrant | BADHDUFLAG | Total packets | Discarded packets |
| A | 0 | 316 | 0 |
| B | 0 | 316 | 0 |
| C | 0 | 316 | 0 |
| D | 0 | 316 | 0 |
| Mode M9 | |||
|---|---|---|---|
| Quadrant | BADHDUFLAG | Total packets | Discarded packets |
| A | 0 | 48 | 0 |
| B | 0 | 49 | 0 |
| C | 0 | 49 | 0 |
| D | 0 | 49 | 0 |
| Quadrant | Total seconds | Saturated seconds | Saturation percentage |
|---|---|---|---|
| A | 15514 | 46 | 0.296506% |
| B | 15513 | 139 | 0.896023% |
| C | 15513 | 38 | 0.244956% |
| D | 15513 | 723 | 4.660607% |
Noise dominated data is calculated using 1-second bins in cleaned event files. If a bin has >2000 counts, and if more than 50% of those come from <1% of pixels, then it is considered to be noise-dominated and hence unusable.
| Quadrant | # 1 sec bins | Bins with >0 counts | Bins with >2000 counts | High rate bins dominated by noise | Noise dominated (total time) | Noise dominated (detector-on time) | Marked lightcurve |
|---|---|---|---|---|---|---|---|
| A | 19691 | 15517 | 16 | 16 | 0.08% | 0.10% | 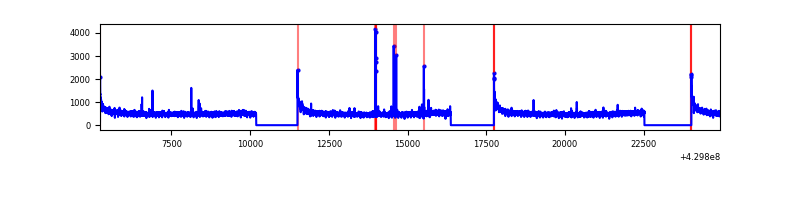 |
| B | 19690 | 15516 | 72 | 72 | 0.37% | 0.46% | 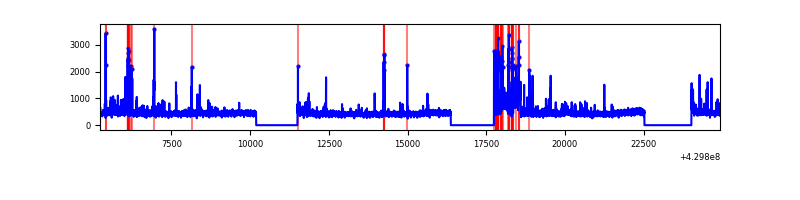 |
| C | 19690 | 15516 | 29 | 29 | 0.15% | 0.19% | 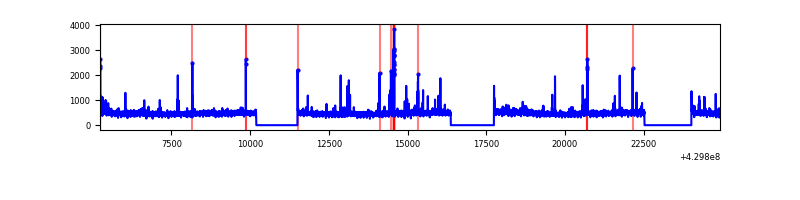 |
| D | 19690 | 15516 | 656 | 656 | 3.33% | 4.23% | 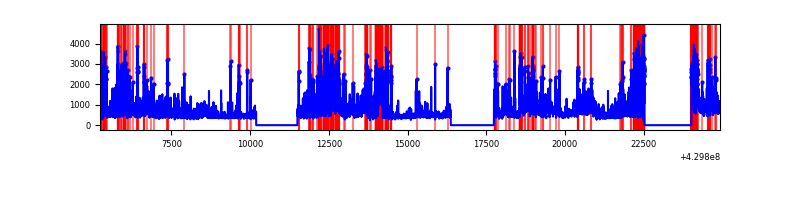 |
Top three noisy pixels from each quadrant. If the there are fewer than three noisy pixels in the level2.evt file, extra rows are filled as -1
| Pixel properties | Quadrant properties | ||||||
|---|---|---|---|---|---|---|---|
| Quadrant | DetID | PixID | Counts | Sigma | Mean | Median | Sigma |
| A | 10 | 83 | 1470790 | 4258.66 | 1685 | 1647 | 345.0 |
| A | 15 | 237 | 46736 | 130.7 | 1685 | 1647 | 345.0 |
| A | 13 | 6 | 32373 | 89.07 | 1685 | 1647 | 345.0 |
| B | 0 | 229 | 331776 | 1020.63 | 1673 | 1624 | 323.5 |
| B | 0 | 245 | 173674 | 531.87 | 1673 | 1624 | 323.5 |
| B | 15 | 85 | 123914 | 378.05 | 1673 | 1624 | 323.5 |
| C | 15 | 214 | 633165 | 1648.38 | 1649 | 1657 | 383.1 |
| C | 3 | 233 | 246088 | 638.02 | 1649 | 1657 | 383.1 |
| C | 14 | 254 | 227822 | 590.34 | 1649 | 1657 | 383.1 |
| D | 1 | 52 | 3374921 | 8565.79 | 1616 | 1568 | 393.8 |
| D | 2 | 16 | 884728 | 2242.56 | 1616 | 1568 | 393.8 |
| D | 2 | 249 | 431653 | 1092.09 | 1616 | 1568 | 393.8 |
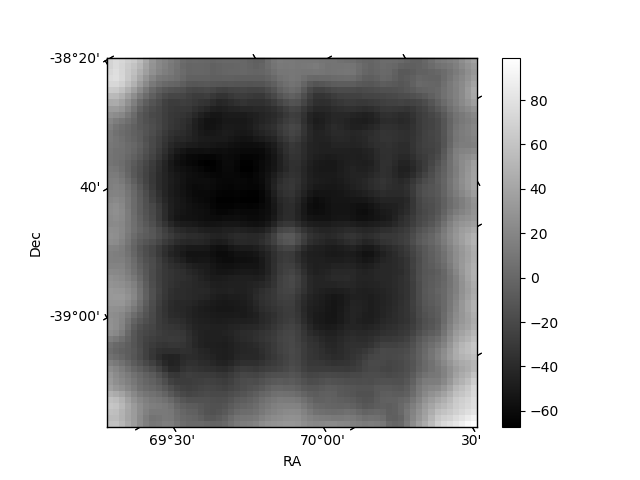
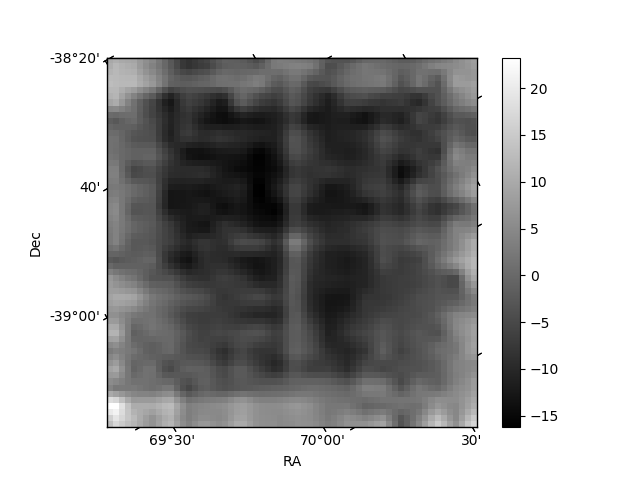
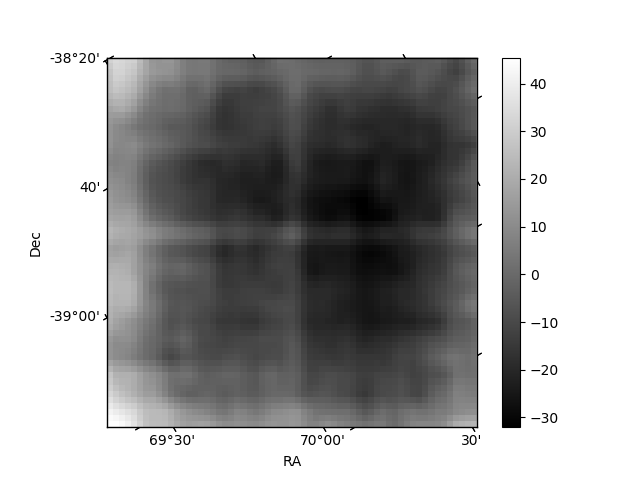
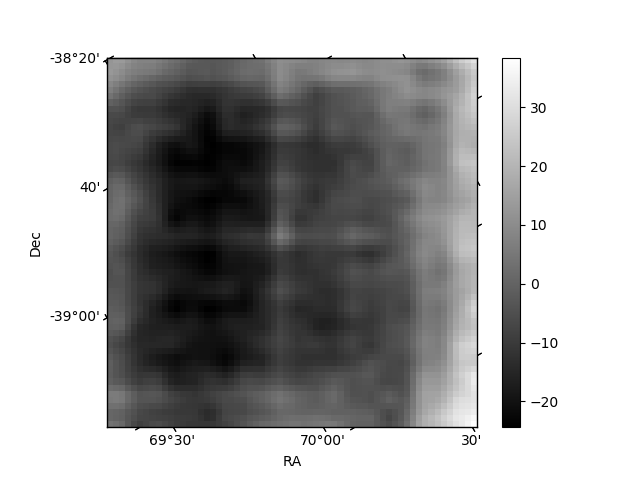
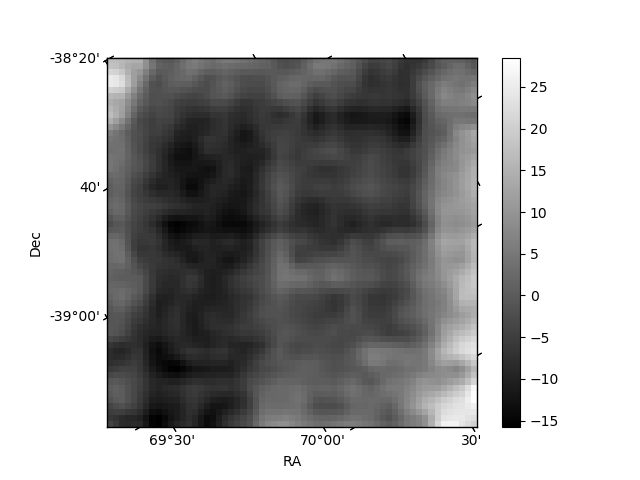
Histogram calculated using DETX and DETY for each event in the final _common_clean file
| Quadrant A | 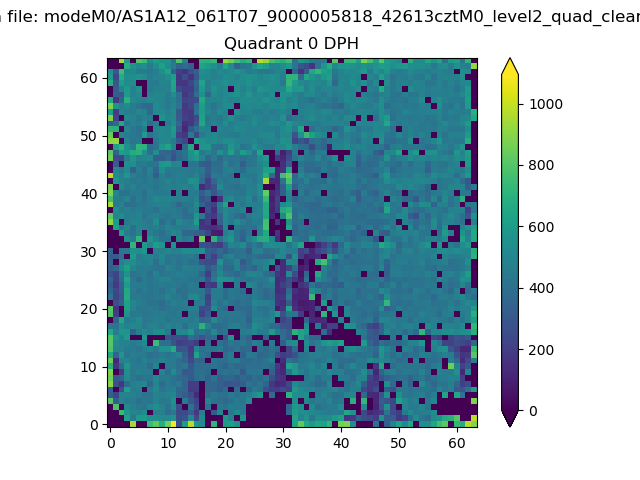 |
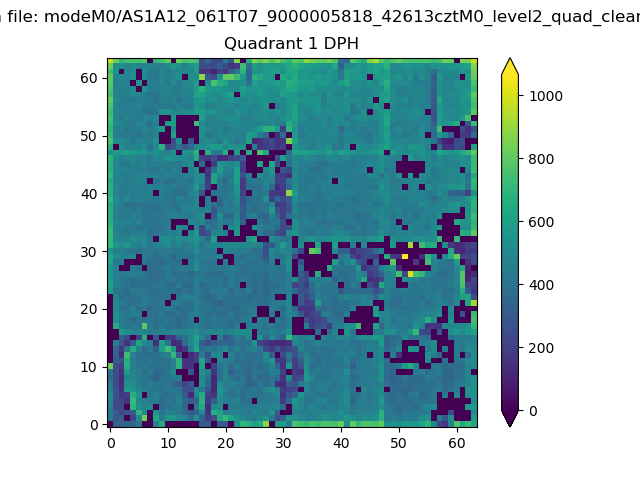 |
Quadrant B |
|---|---|---|---|
| Quadrant D | 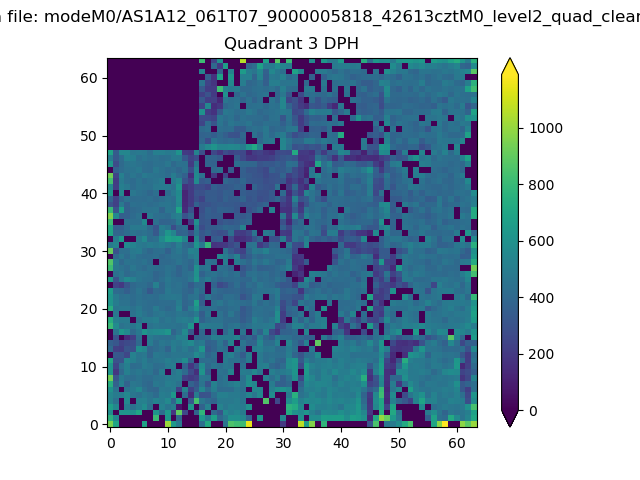 |
 |
Quadrant C |
| Plot type | Count rate plots | Images |
|---|---|---|
| Comparison with Poisson distribution Blue bars denote a histogram of data divided into 1 sec bins. Red curve is a Poisson curve with rate = median count rate of data. |
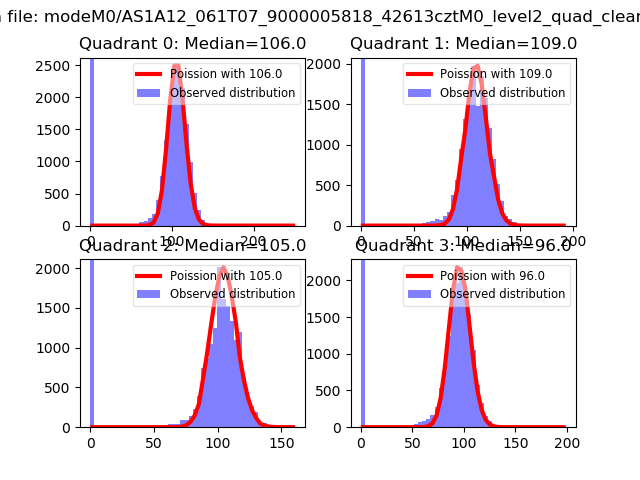 |
 |
| Quadrant-wise count rates Data is divided into 100 sec bins |
 |
|
| Module-wise count rates for Quadrant A Data is divided into 100 sec bins |
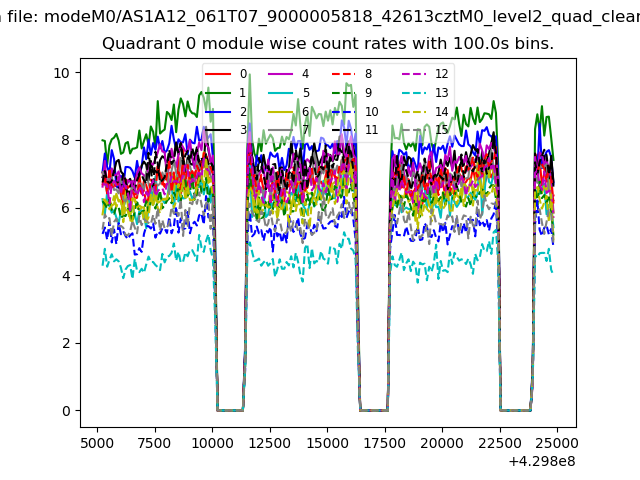 |
 |
| Module-wise count rates for Quadrant B Data is divided into 100 sec bins |
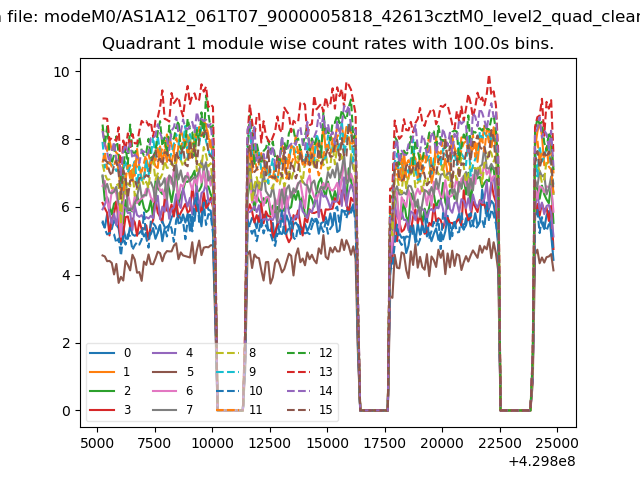 |
 |
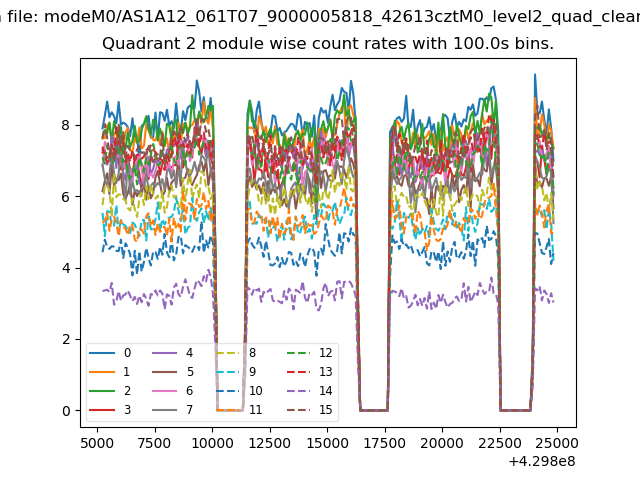
| Module-wise count rates for Quadrant C Data is divided into 100 sec bins |
 |
 |
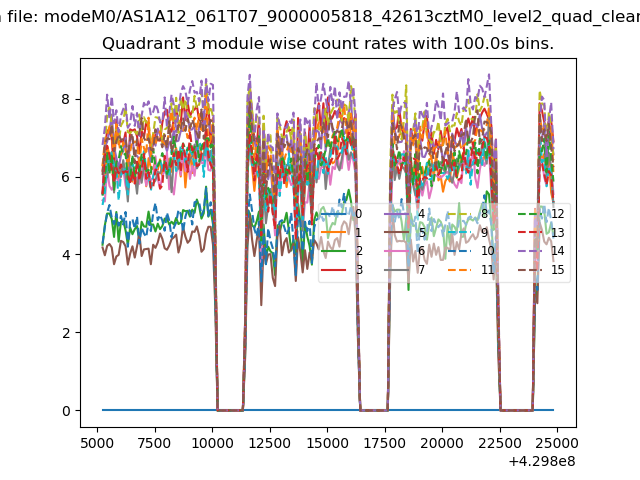
| Module-wise count rates for Quadrant D Data is divided into 100 sec bins |
 |
 |
| Parameter | Plot |
|---|---|
| CZT HV Monitor | 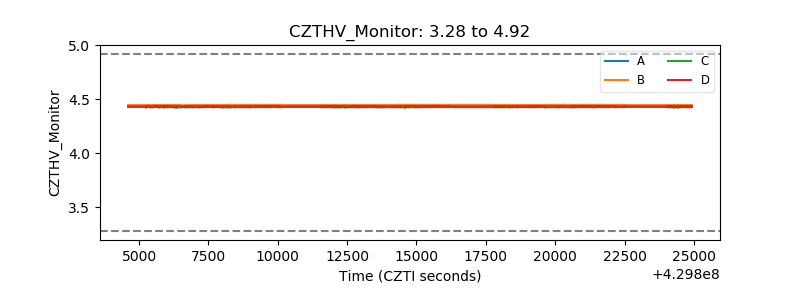 |
| D_VDD | 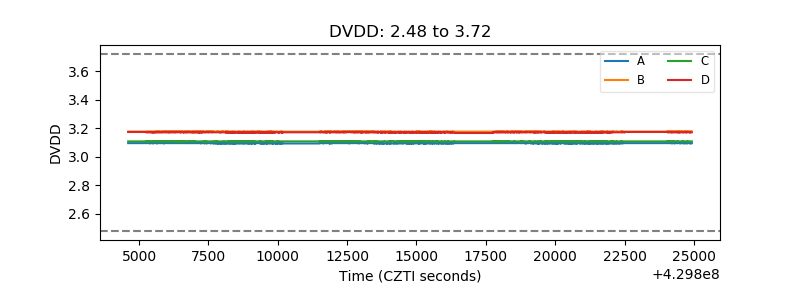 |
| Temperature 1 |  |
| Veto HV Monitor | 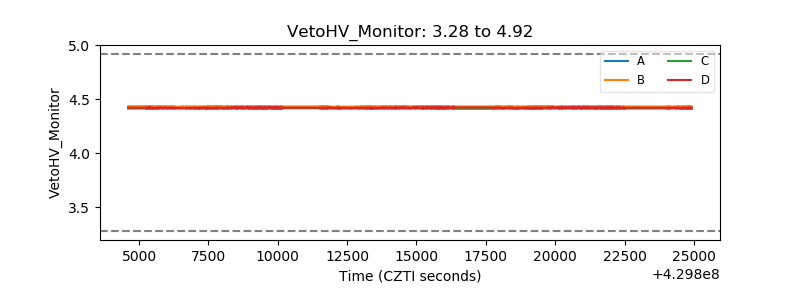 |
| Veto LLD | 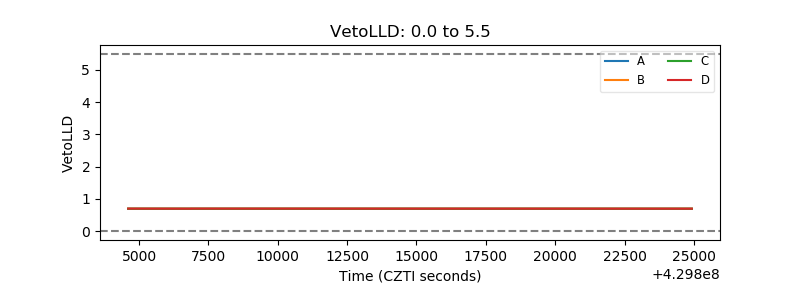 |
| Alpha Counter | 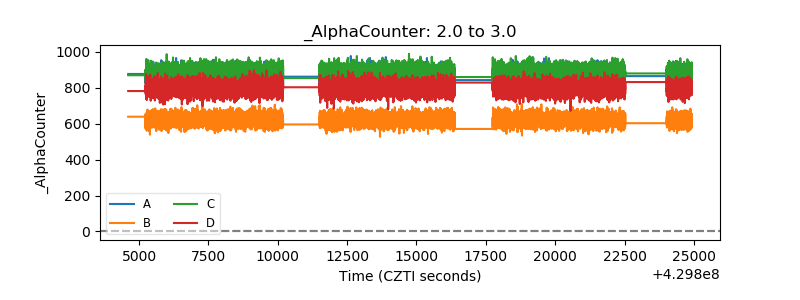 |
| _CPM_Rate | 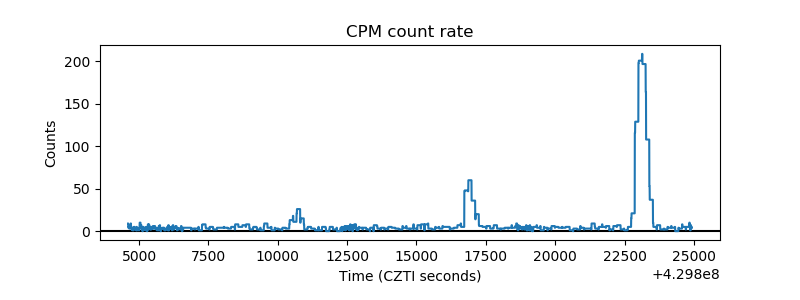 |
| CZT Counter |  |
| +2.5 Volts monitor | 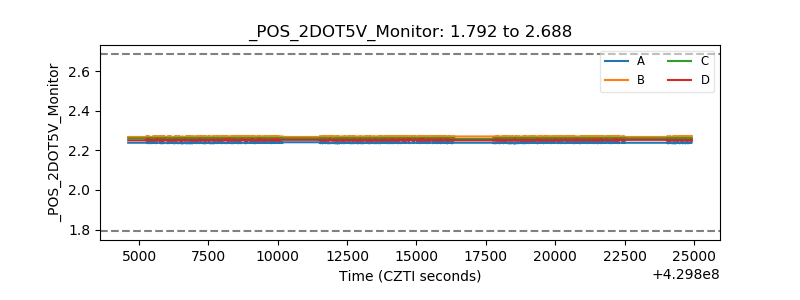 |
| +5 Volts monitor | 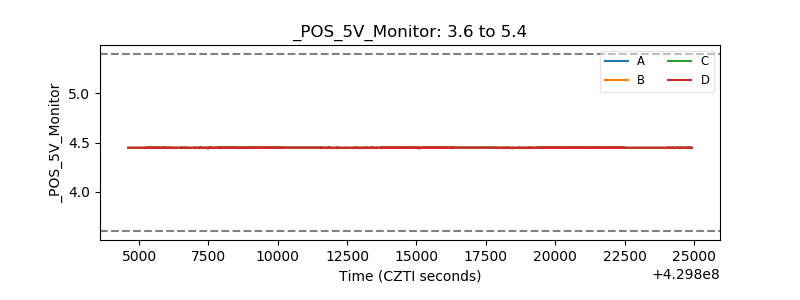 |
| _ROLL_ROT | 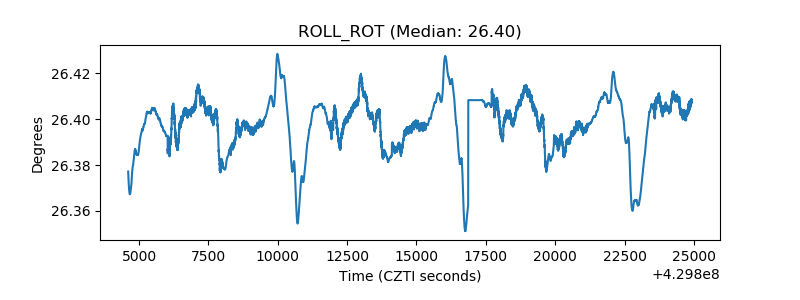 |
| _Roll_DEC | 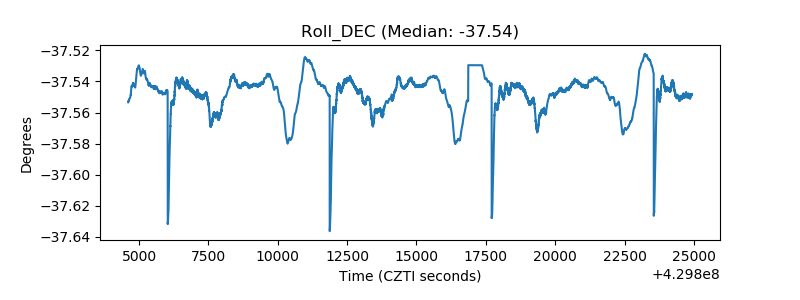 |
| _Roll_RA | 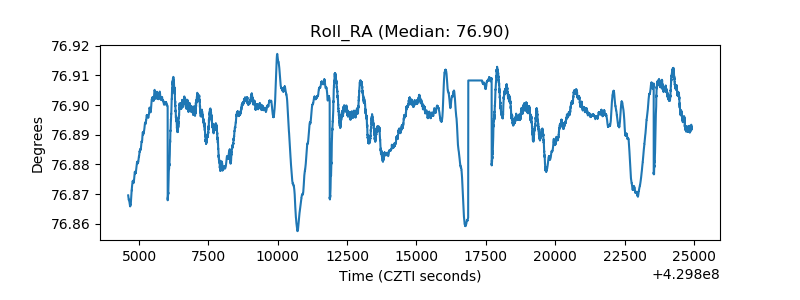 |
| Veto Counter | 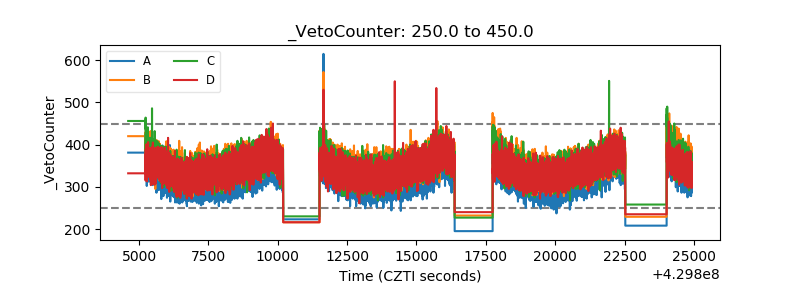 |