| Param | Original file | Final file |
|---|---|---|
| Filename | modeM0/AS1A12_061T07_9000005818_42614cztM0_level2.fits | modeM0/AS1A12_061T07_9000005818_42614cztM0_level2_quad_clean.evt |
| Size (bytes) | 113,935,680 | 23,624,640 |
| Size | 108.7 MB | 22.5 MB |
| Events in quadrant A | 847,231 | 159,152 |
| Events in quadrant B | 757,143 | 161,074 |
| Events in quadrant C | 719,696 | 154,812 |
| Events in quadrant D | 1,775,964 | 131,275 |
| Mode M0 | |||
|---|---|---|---|
| Quadrant | BADHDUFLAG | Total packets | Discarded packets |
| A | 0 | 3435 | 1 |
| B | 0 | 3208 | 1 |
| C | 0 | 3070 | 1 |
| D | 0 | 6333 | 1 |
| Mode SS | |||
|---|---|---|---|
| Quadrant | BADHDUFLAG | Total packets | Discarded packets |
| A | 0 | 30 | 0 |
| B | 0 | 30 | 0 |
| C | 0 | 30 | 0 |
| D | 0 | 30 | 0 |
| Mode M9 | |||
|---|---|---|---|
| Quadrant | BADHDUFLAG | Total packets | Discarded packets |
| A | 0 | 15 | 0 |
| B | 0 | 15 | 0 |
| C | 0 | 15 | 0 |
| D | 0 | 15 | 0 |
| Quadrant | Total seconds | Saturated seconds | Saturation percentage |
|---|---|---|---|
| A | 1475 | 7 | 0.474576% |
| B | 1476 | 14 | 0.948509% |
| C | 1476 | 2 | 0.135501% |
| D | 1476 | 162 | 10.975610% |
Noise dominated data is calculated using 1-second bins in cleaned event files. If a bin has >2000 counts, and if more than 50% of those come from <1% of pixels, then it is considered to be noise-dominated and hence unusable.
| Quadrant | # 1 sec bins | Bins with >0 counts | Bins with >2000 counts | High rate bins dominated by noise | Noise dominated (total time) | Noise dominated (detector-on time) | Marked lightcurve |
|---|---|---|---|---|---|---|---|
| A | 2968 | 1476 | 3 | 3 | 0.10% | 0.20% | 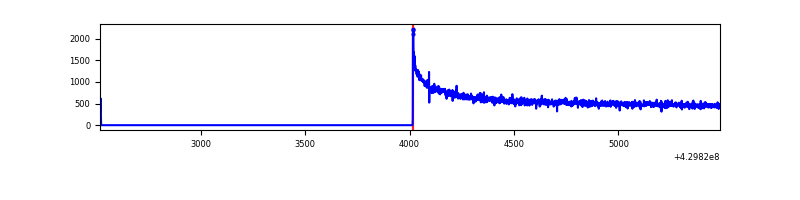 |
| B | 2969 | 1477 | 6 | 6 | 0.20% | 0.41% | 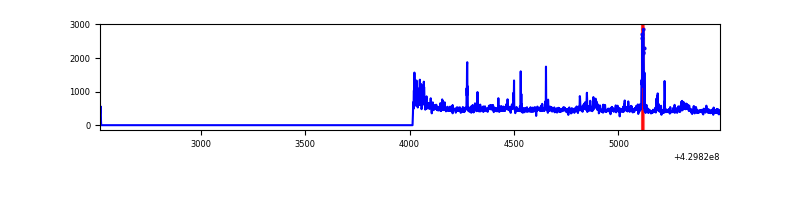 |
| C | 2969 | 1477 | 1 | 1 | 0.03% | 0.07% | 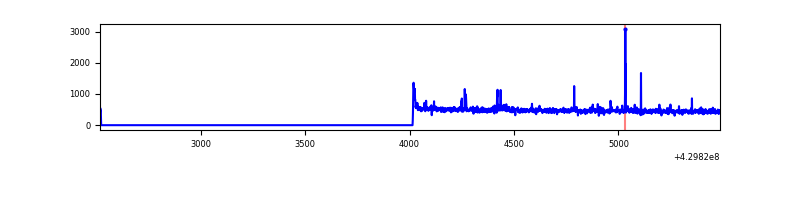 |
| D | 2969 | 1477 | 141 | 141 | 4.75% | 9.55% | 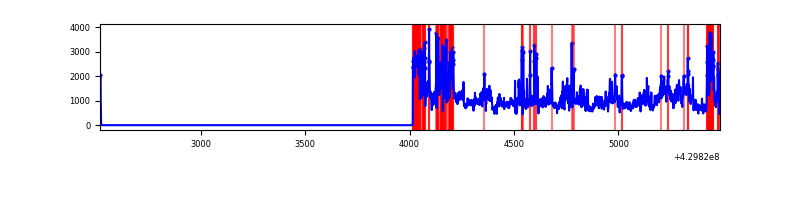 |
Top three noisy pixels from each quadrant. If the there are fewer than three noisy pixels in the level2.evt file, extra rows are filled as -1
| Pixel properties | Quadrant properties | ||||||
|---|---|---|---|---|---|---|---|
| Quadrant | DetID | PixID | Counts | Sigma | Mean | Median | Sigma |
| A | 10 | 83 | 210992 | 5903.61 | 162 | 159 | 35.7 |
| A | 13 | 6 | 3073 | 81.6 | 162 | 159 | 35.7 |
| A | 10 | 67 | 2285 | 59.53 | 162 | 159 | 35.7 |
| B | 0 | 245 | 60023 | 1747.06 | 162 | 157 | 34.3 |
| B | 4 | 141 | 23350 | 676.84 | 162 | 157 | 34.3 |
| B | 0 | 168 | 22254 | 644.85 | 162 | 157 | 34.3 |
| C | 15 | 214 | 64043 | 1657.3 | 157 | 158 | 38.5 |
| C | 14 | 254 | 25813 | 665.54 | 157 | 158 | 38.5 |
| C | 3 | 233 | 12302 | 315.04 | 157 | 158 | 38.5 |
| D | 1 | 52 | 705389 | 18527.82 | 147 | 142 | 38.1 |
| D | 2 | 16 | 445858 | 11709.58 | 147 | 142 | 38.1 |
| D | 12 | 233 | 35491 | 928.67 | 147 | 142 | 38.1 |
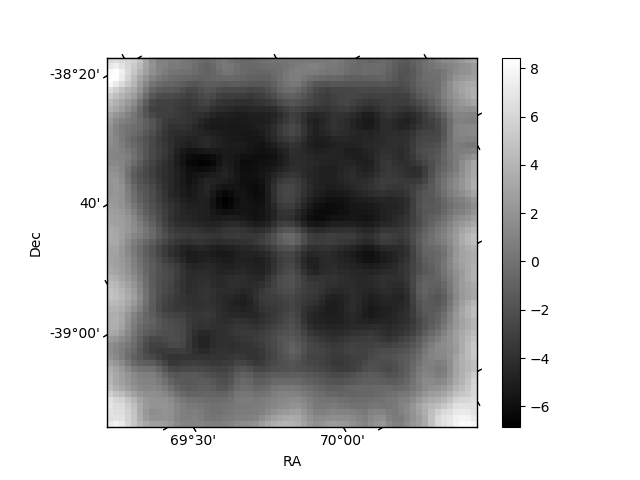
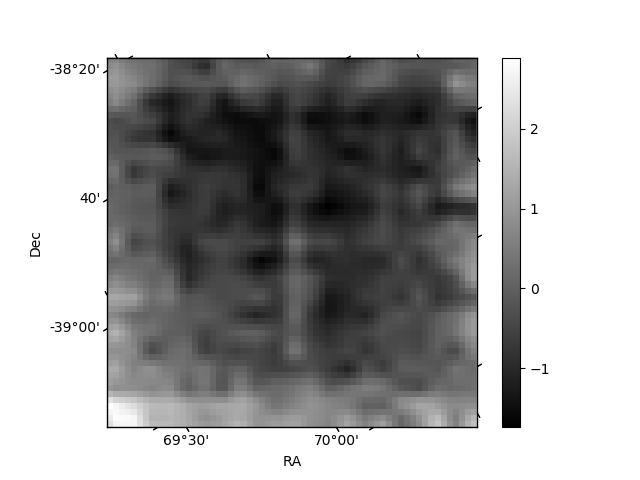
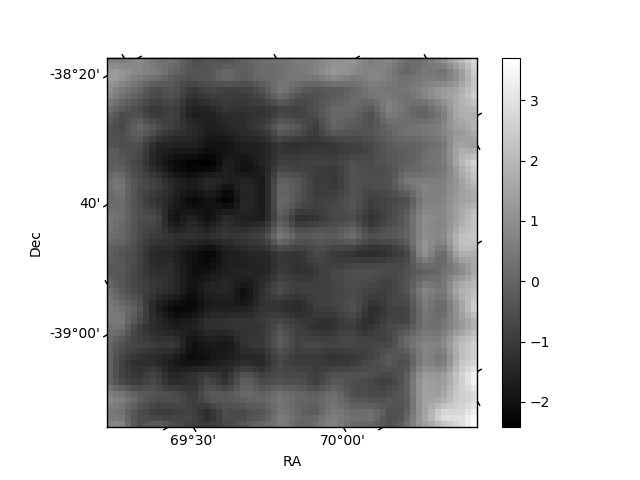
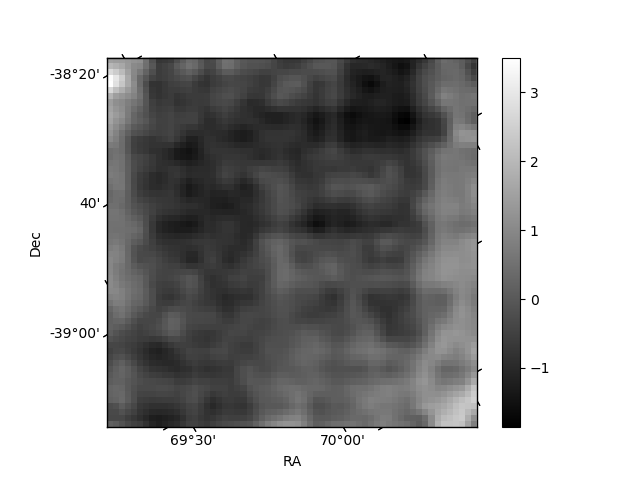
Histogram calculated using DETX and DETY for each event in the final _common_clean file
| Quadrant A | 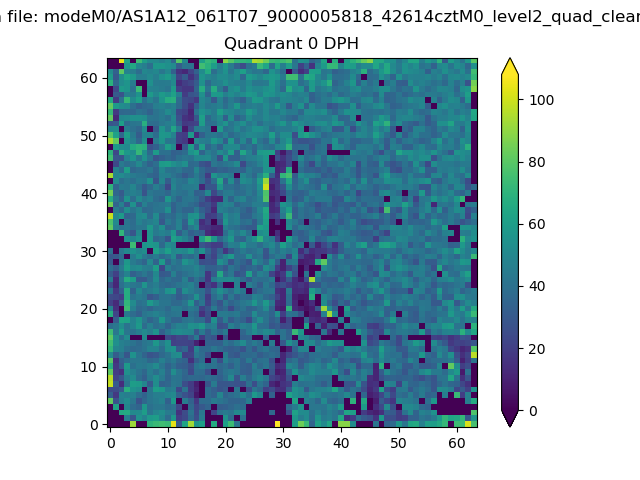 |
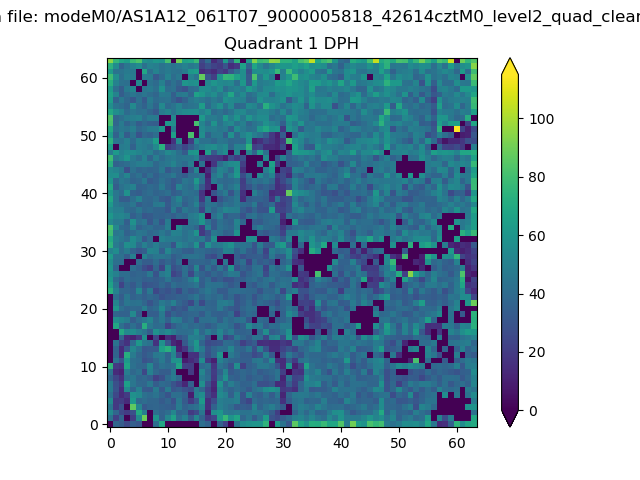 |
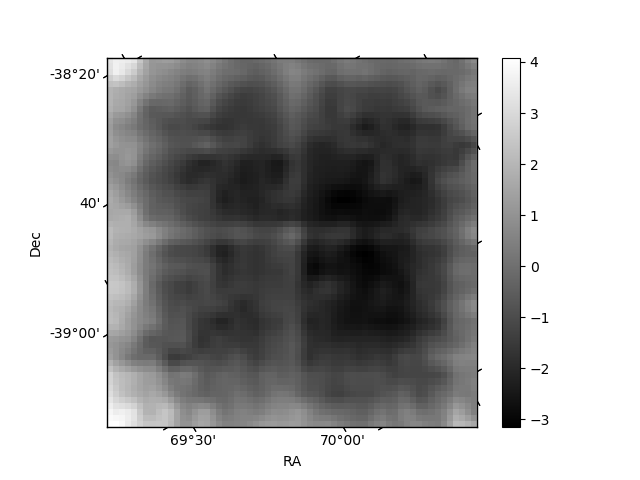
Quadrant B |
|---|---|---|---|
| Quadrant D | 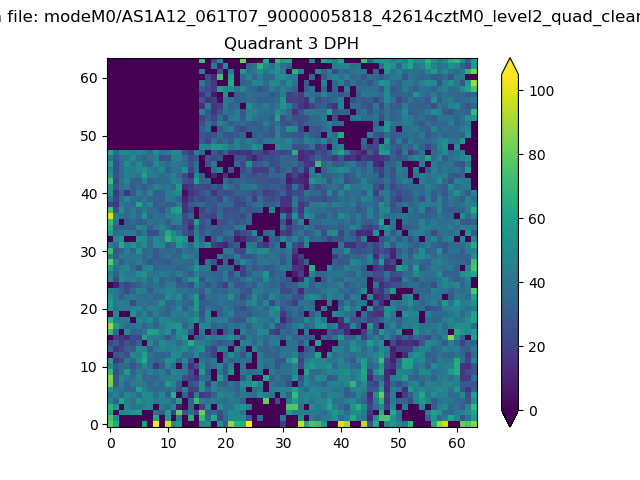 |
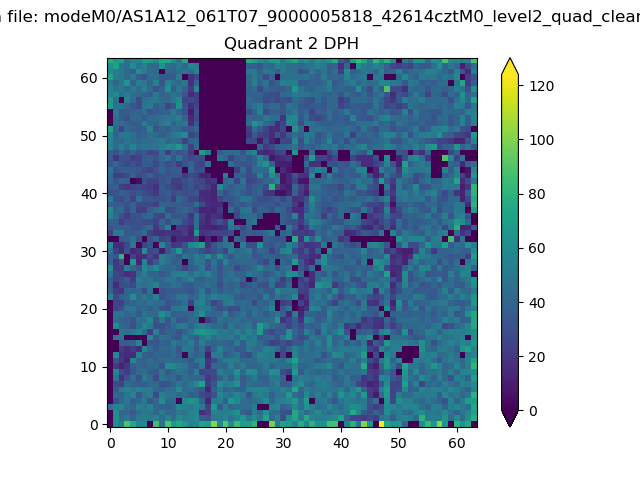 |
Quadrant C |
| Plot type | Count rate plots | Images |
|---|---|---|
| Comparison with Poisson distribution Blue bars denote a histogram of data divided into 1 sec bins. Red curve is a Poisson curve with rate = median count rate of data. |
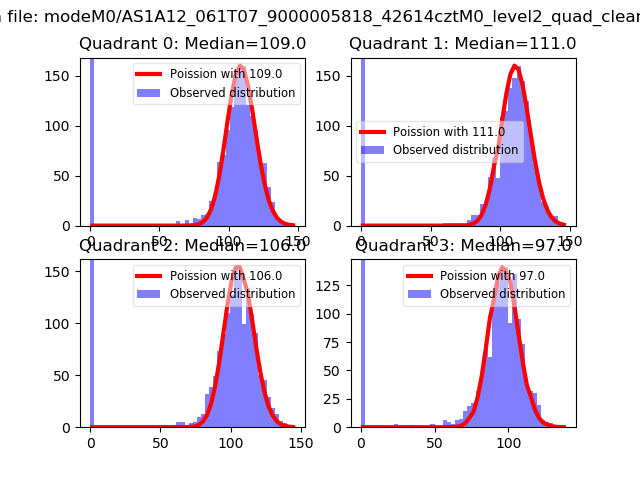 |
 |
| Quadrant-wise count rates Data is divided into 100 sec bins |
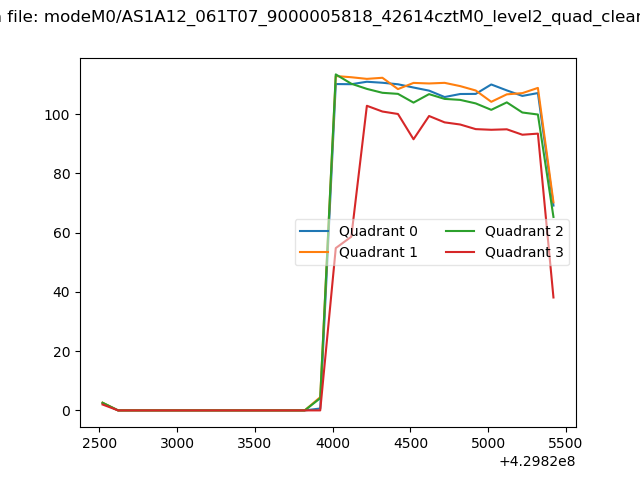 |
|
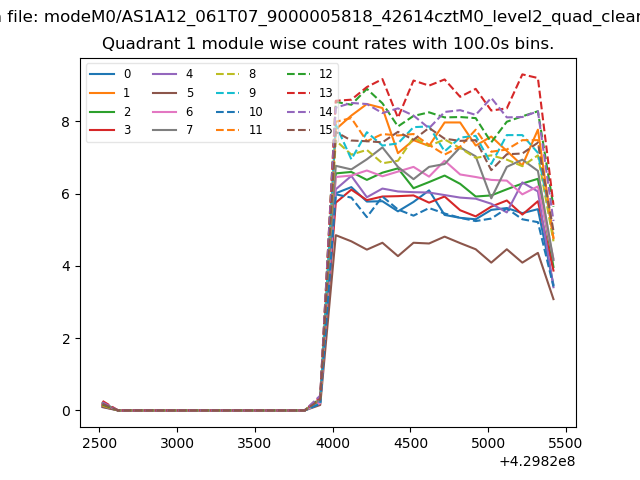
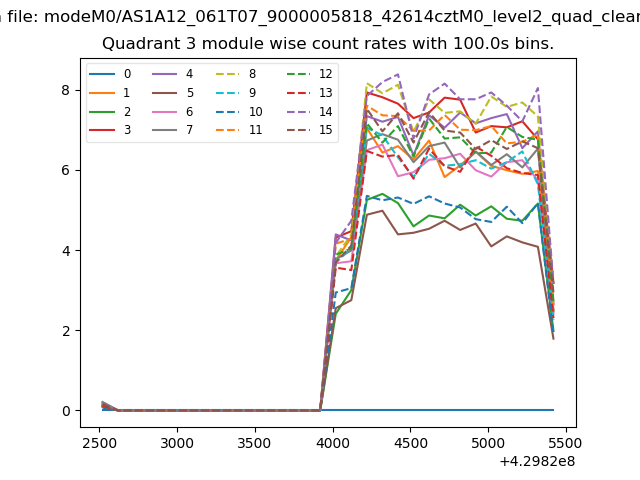
| Module-wise count rates for Quadrant A Data is divided into 100 sec bins |
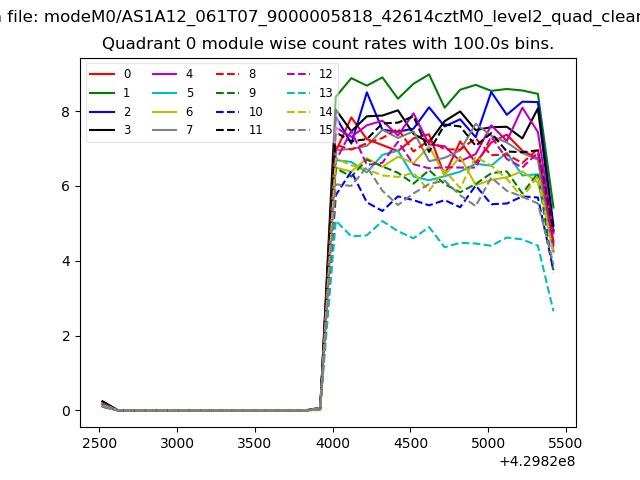 |
 |
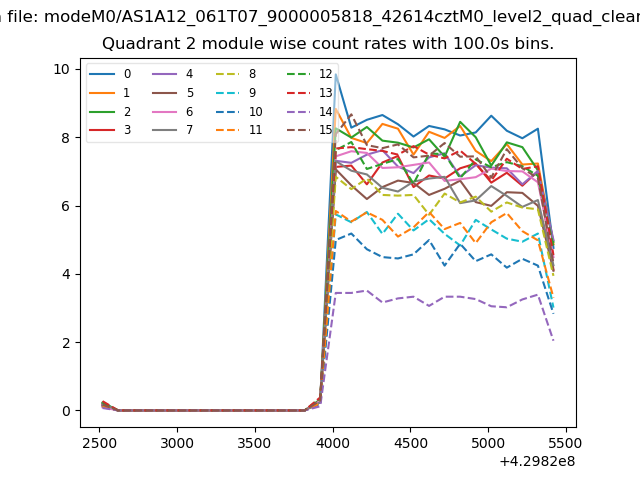
| Module-wise count rates for Quadrant B Data is divided into 100 sec bins |
 |
 |
| Module-wise count rates for Quadrant C Data is divided into 100 sec bins |
 |
 |
| Module-wise count rates for Quadrant D Data is divided into 100 sec bins |
 |
 |
| Parameter | Plot |
|---|---|
| CZT HV Monitor | 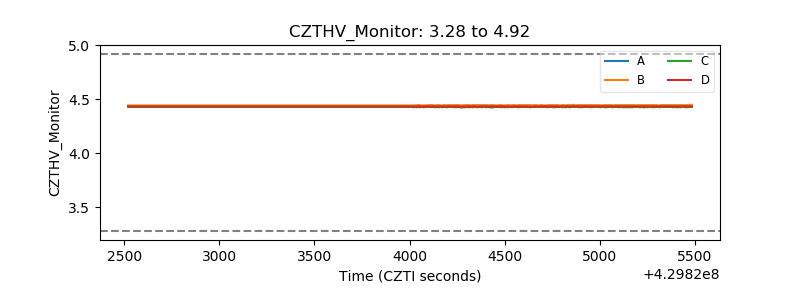 |
| D_VDD | 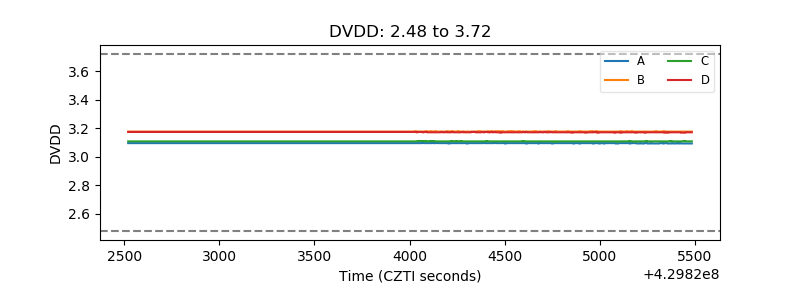 |
| Temperature 1 | 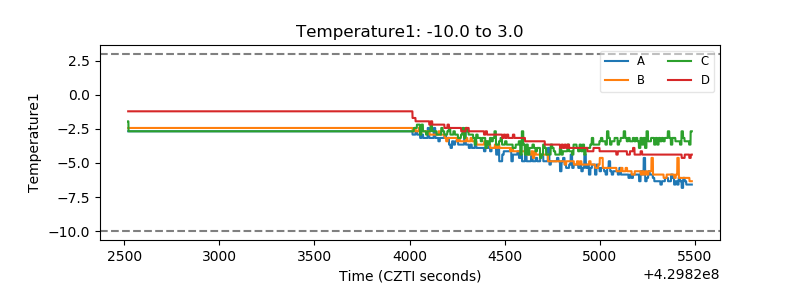 |
| Veto HV Monitor | 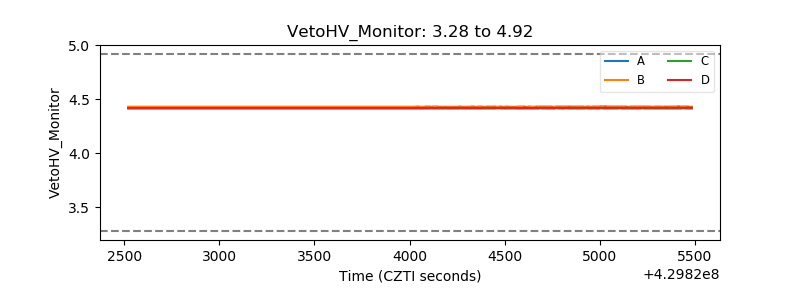 |
| Veto LLD | 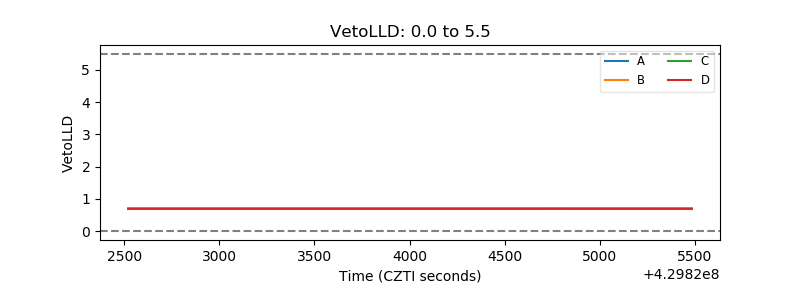 |
| Alpha Counter | 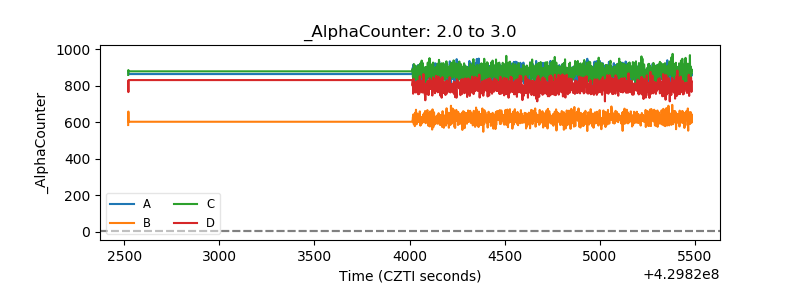 |
| _CPM_Rate |  |
| CZT Counter | 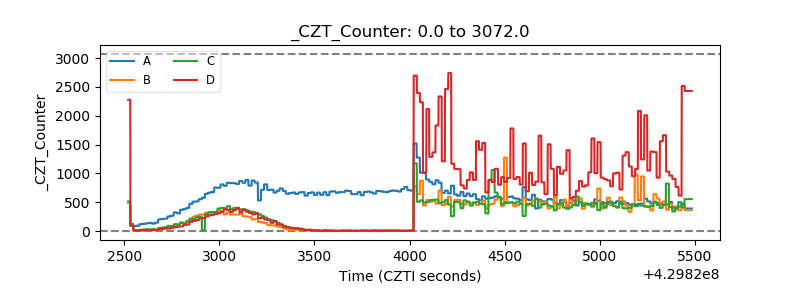 |
| +2.5 Volts monitor | 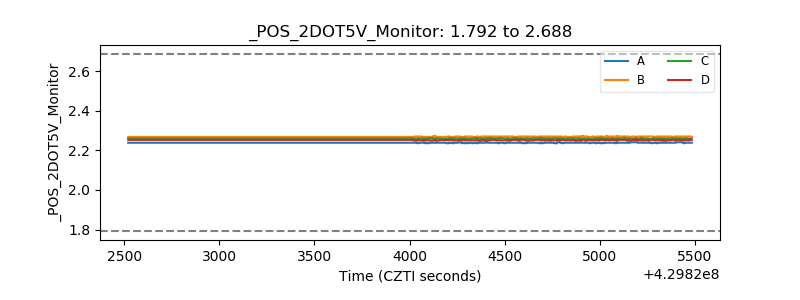 |
| +5 Volts monitor | 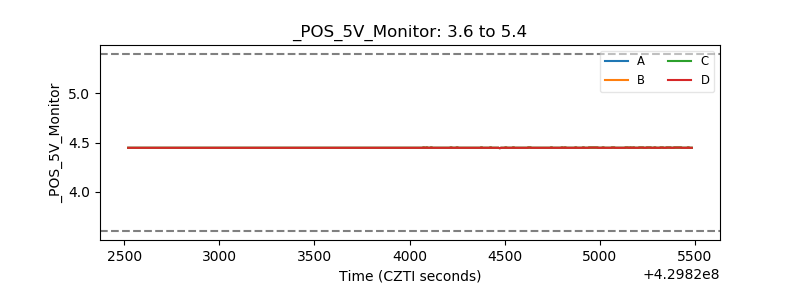 |
| _ROLL_ROT | 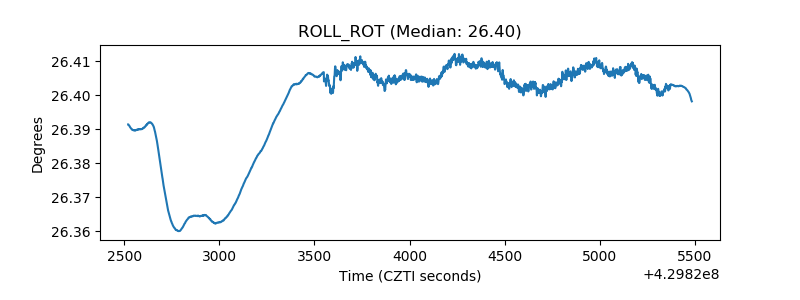 |
| _Roll_DEC | 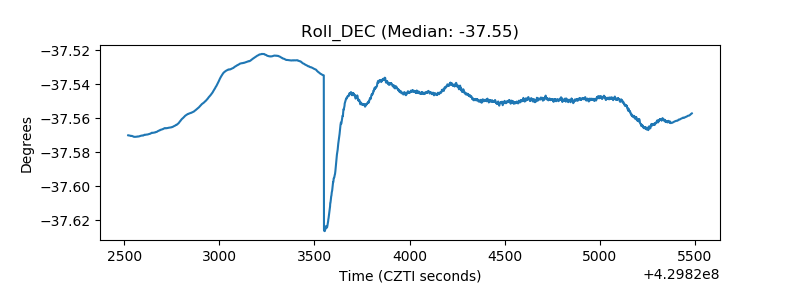 |
| _Roll_RA | 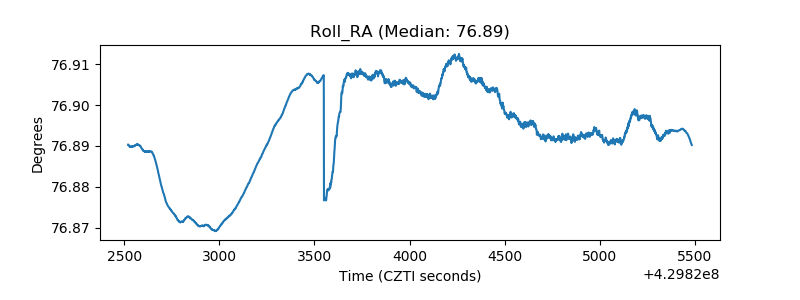 |
| Veto Counter | 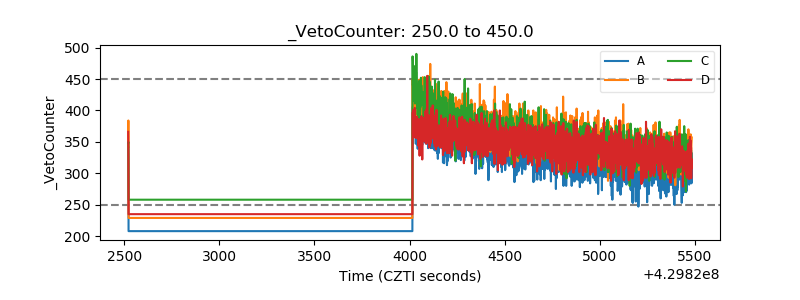 |