| Param | Original file | Final file |
|---|---|---|
| Filename | modeM0/AS1C06_010T01_9000005816_42578cztM0_level2.fits | modeM0/AS1C06_010T01_9000005816_42578cztM0_level2_quad_clean.evt |
| Size (bytes) | 313,963,200 | 83,776,320 |
| Size | 299.4 MB | 79.9 MB |
| Events in quadrant A | 2,688,222 | 567,700 |
| Events in quadrant B | 2,317,611 | 578,158 |
| Events in quadrant C | 2,384,359 | 543,339 |
| Events in quadrant D | 3,837,235 | 492,735 |
| Mode M0 | |||
|---|---|---|---|
| Quadrant | BADHDUFLAG | Total packets | Discarded packets |
| A | 0 | 10854 | 2 |
| B | 0 | 10541 | 2 |
| C | 0 | 10475 | 2 |
| D | 0 | 14962 | 2 |
| Mode M9 | |||
|---|---|---|---|
| Quadrant | BADHDUFLAG | Total packets | Discarded packets |
| A | 0 | 25 | 0 |
| B | 0 | 26 | 0 |
| C | 0 | 26 | 0 |
| D | 0 | 26 | 0 |
| Mode SS | |||
|---|---|---|---|
| Quadrant | BADHDUFLAG | Total packets | Discarded packets |
| A | 0 | 104 | 0 |
| B | 0 | 104 | 0 |
| C | 0 | 104 | 0 |
| D | 0 | 104 | 0 |
| Quadrant | Total seconds | Saturated seconds | Saturation percentage |
|---|---|---|---|
| A | 5060 | 8 | 0.158103% |
| B | 5060 | 34 | 0.671937% |
| C | 5060 | 16 | 0.316206% |
| D | 5060 | 230 | 4.545455% |
Noise dominated data is calculated using 1-second bins in cleaned event files. If a bin has >2000 counts, and if more than 50% of those come from <1% of pixels, then it is considered to be noise-dominated and hence unusable.
| Quadrant | # 1 sec bins | Bins with >0 counts | Bins with >2000 counts | High rate bins dominated by noise | Noise dominated (total time) | Noise dominated (detector-on time) | Marked lightcurve |
|---|---|---|---|---|---|---|---|
| A | 7063 | 5061 | 3 | 3 | 0.04% | 0.06% | 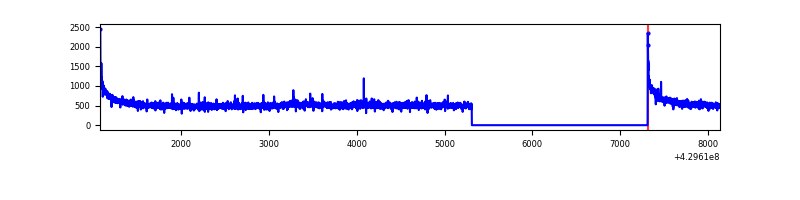 |
| B | 7063 | 5061 | 18 | 18 | 0.25% | 0.36% | 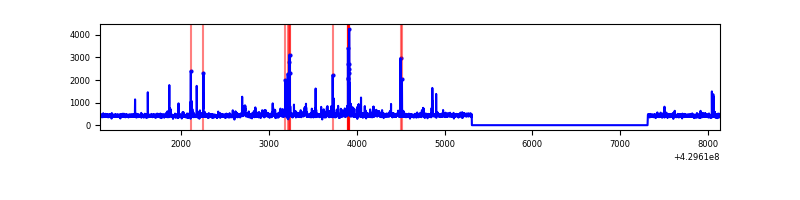 |
| C | 7063 | 5061 | 8 | 8 | 0.11% | 0.16% | 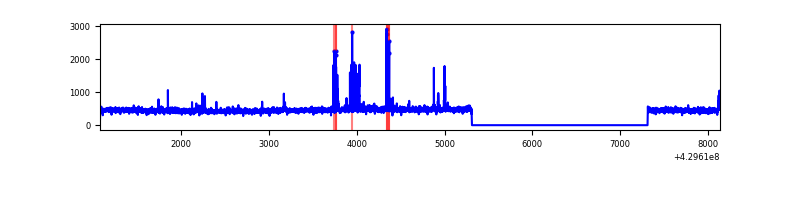 |
| D | 7063 | 5061 | 196 | 196 | 2.78% | 3.87% | 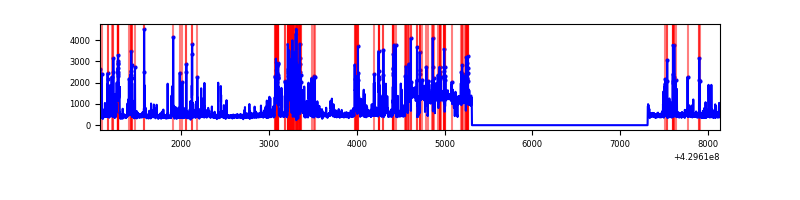 |
Top three noisy pixels from each quadrant. If the there are fewer than three noisy pixels in the level2.evt file, extra rows are filled as -1
| Pixel properties | Quadrant properties | ||||||
|---|---|---|---|---|---|---|---|
| Quadrant | DetID | PixID | Counts | Sigma | Mean | Median | Sigma |
| A | 10 | 83 | 558132 | 4988.5 | 544 | 533 | 111.8 |
| A | 13 | 248 | 8679 | 72.88 | 544 | 533 | 111.8 |
| A | 13 | 6 | 8424 | 70.6 | 544 | 533 | 111.8 |
| B | 5 | 255 | 62345 | 599.35 | 536 | 520 | 103.2 |
| B | 0 | 245 | 40190 | 384.57 | 536 | 520 | 103.2 |
| B | 3 | 112 | 38064 | 363.96 | 536 | 520 | 103.2 |
| C | 15 | 214 | 216095 | 1772.2 | 522 | 525 | 121.6 |
| C | 7 | 220 | 82726 | 675.77 | 522 | 525 | 121.6 |
| C | 3 | 233 | 28059 | 226.36 | 522 | 525 | 121.6 |
| D | 2 | 16 | 540700 | 4319.59 | 520 | 507 | 125.1 |
| D | 1 | 52 | 456805 | 3648.73 | 520 | 507 | 125.1 |
| D | 13 | 249 | 320424 | 2558.18 | 520 | 507 | 125.1 |
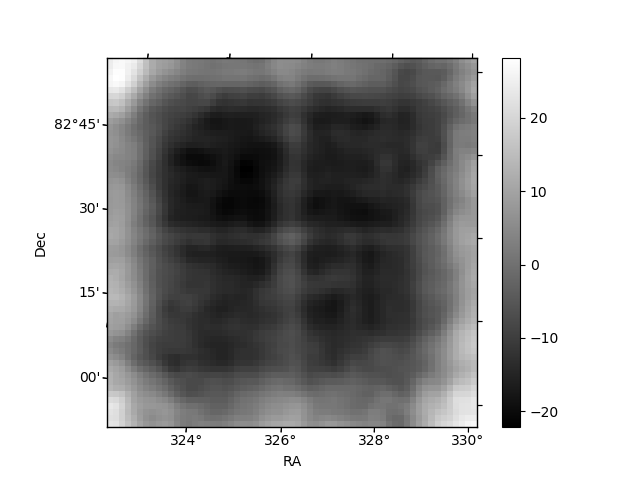
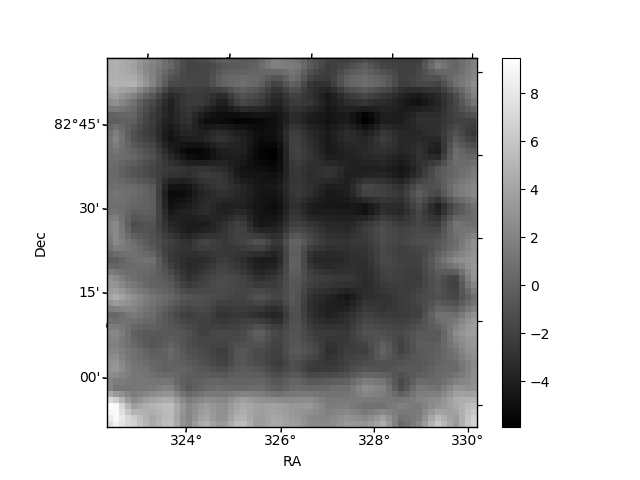
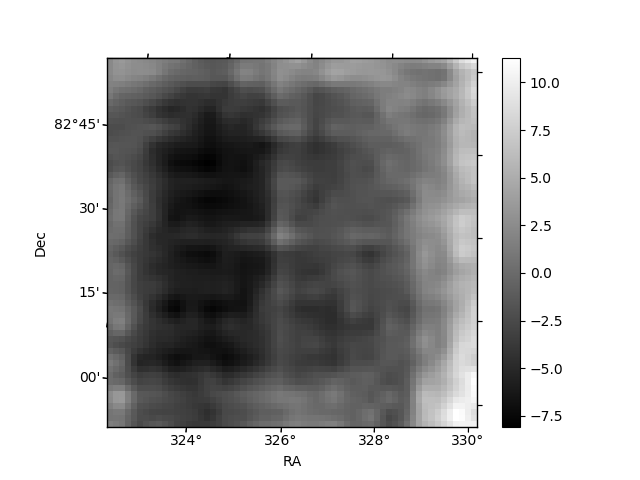
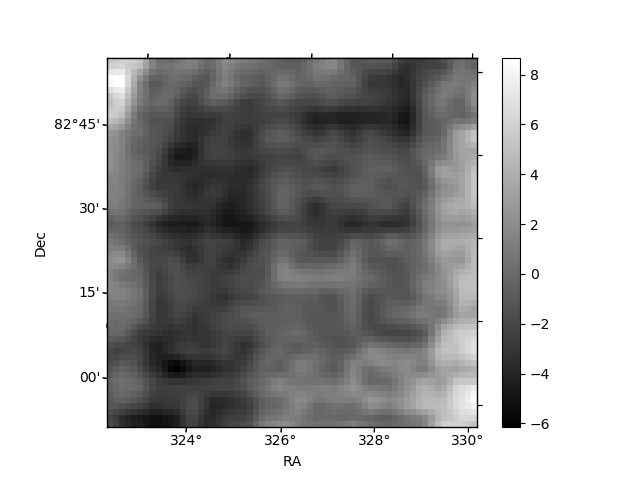
Histogram calculated using DETX and DETY for each event in the final _common_clean file
| Quadrant A | 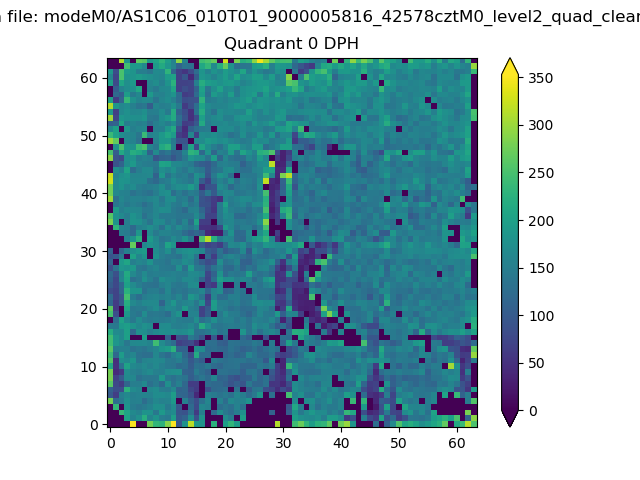 |
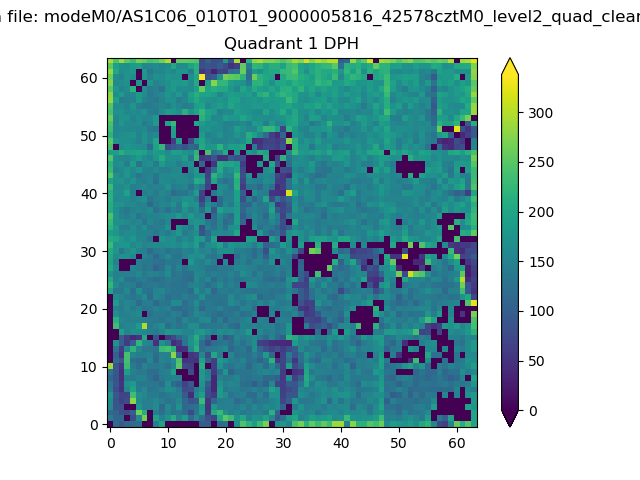 |
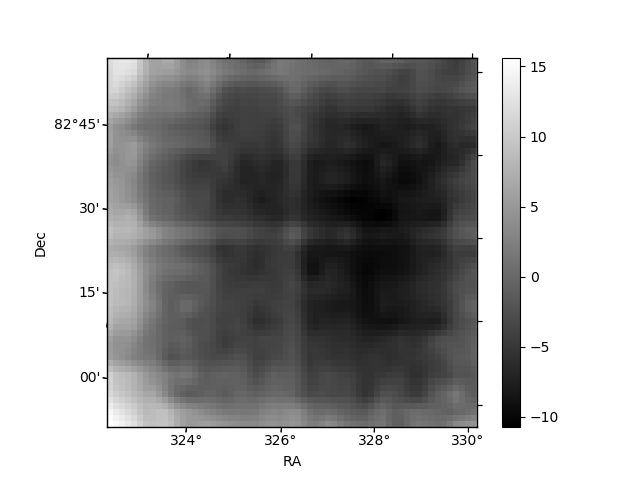
Quadrant B |
|---|---|---|---|
| Quadrant D | 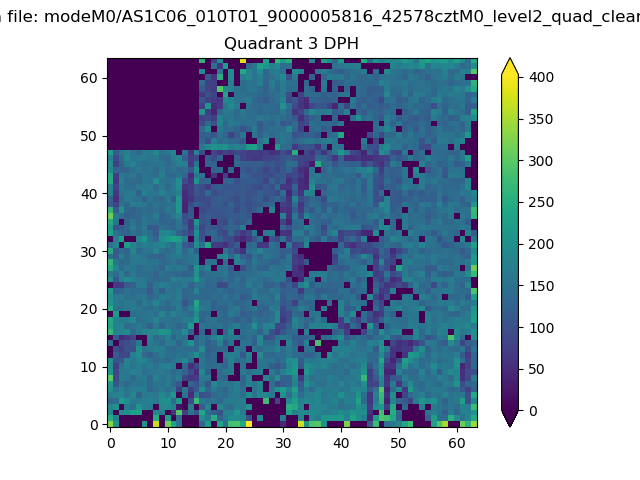 |
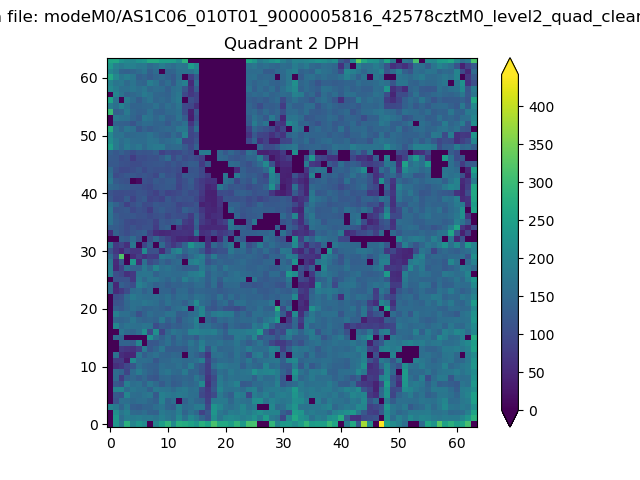 |
Quadrant C |
| Plot type | Count rate plots | Images |
|---|---|---|
| Comparison with Poisson distribution Blue bars denote a histogram of data divided into 1 sec bins. Red curve is a Poisson curve with rate = median count rate of data. |
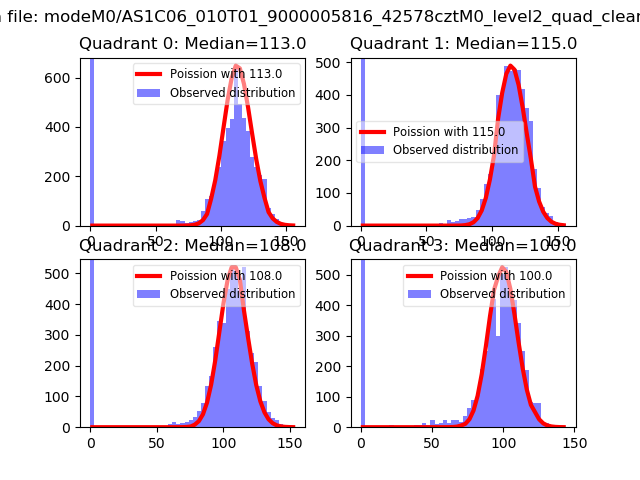 |
 |
| Quadrant-wise count rates Data is divided into 100 sec bins |
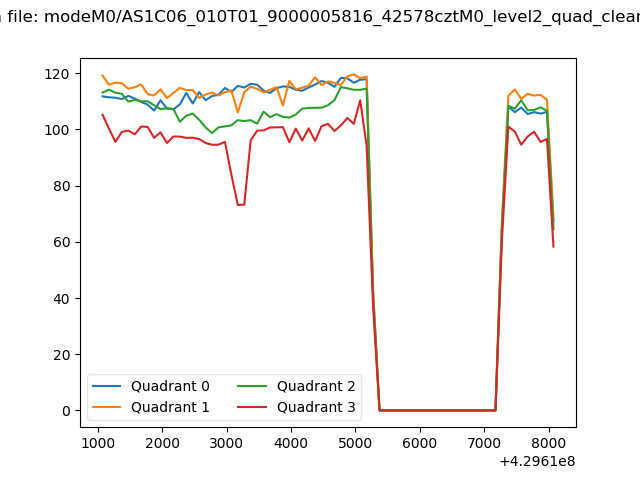 |
|
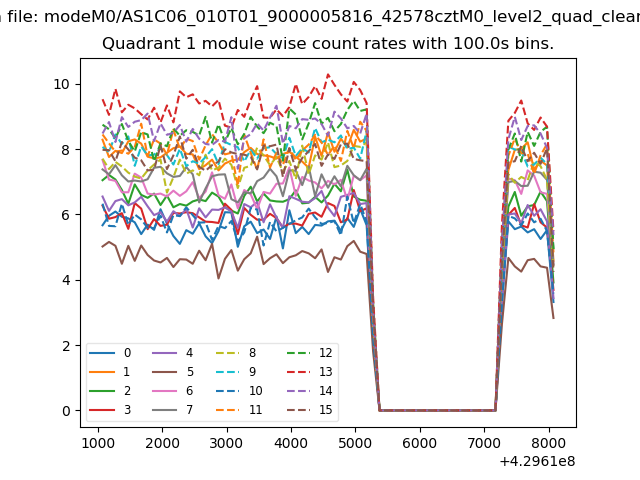
| Module-wise count rates for Quadrant A Data is divided into 100 sec bins |
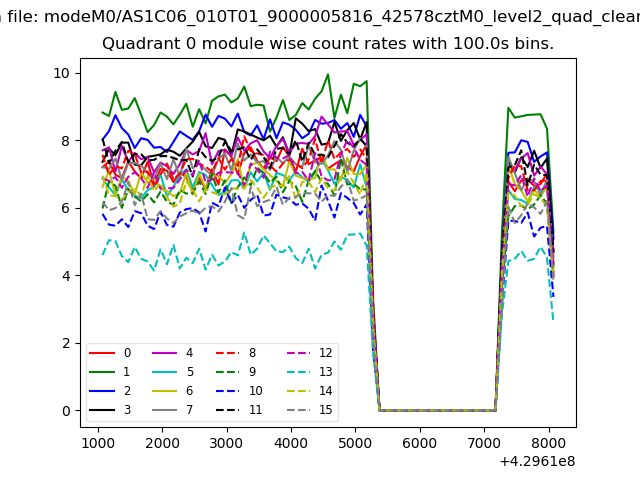 |
 |
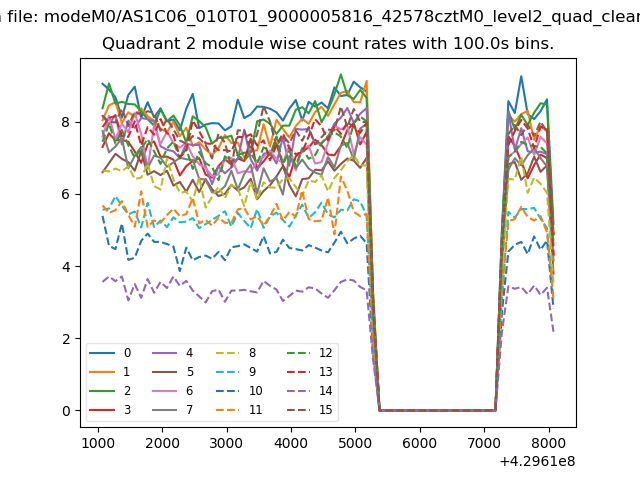
| Module-wise count rates for Quadrant B Data is divided into 100 sec bins |
 |
 |
| Module-wise count rates for Quadrant C Data is divided into 100 sec bins |
 |
 |
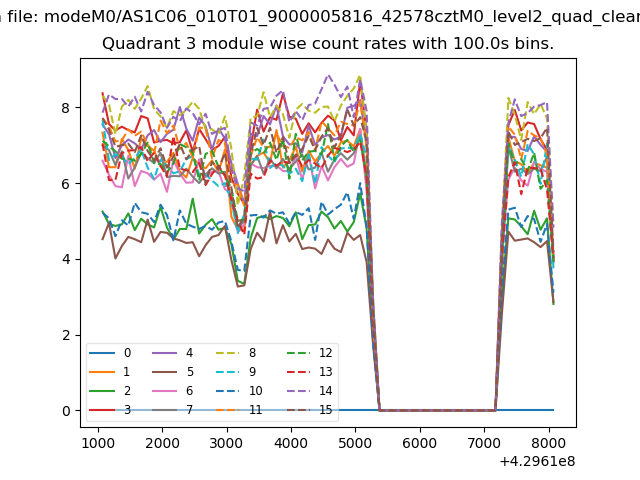
| Module-wise count rates for Quadrant D Data is divided into 100 sec bins |
 |
 |
| Parameter | Plot |
|---|---|
| CZT HV Monitor | 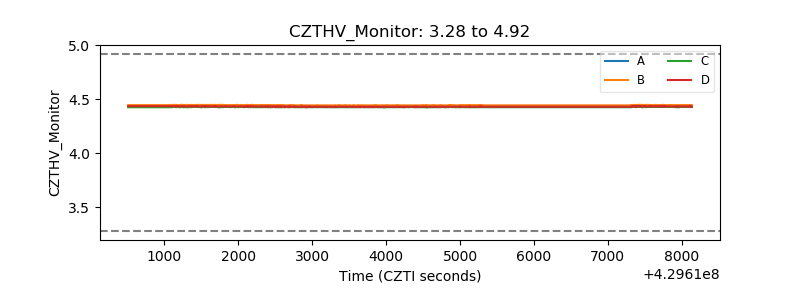 |
| D_VDD | 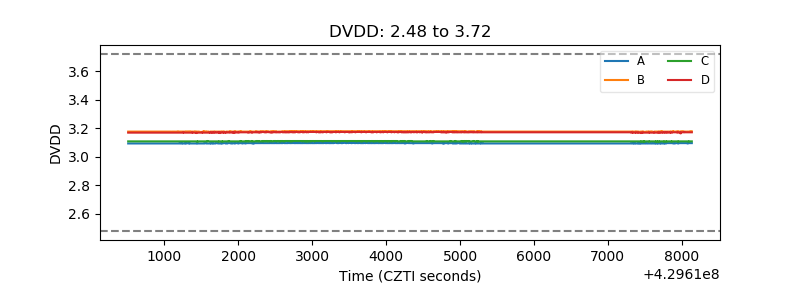 |
| Temperature 1 | 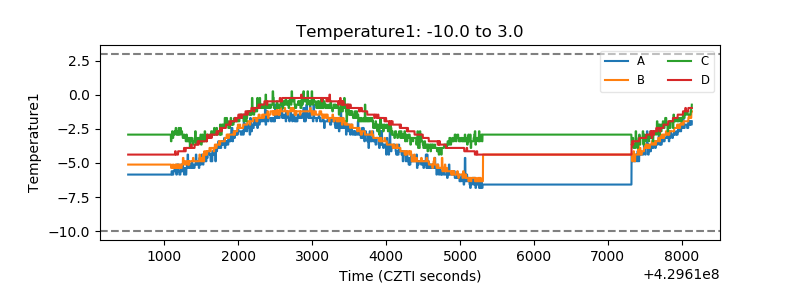 |
| Veto HV Monitor | 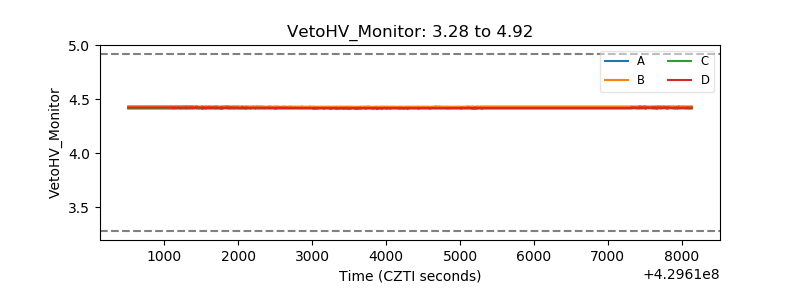 |
| Veto LLD | 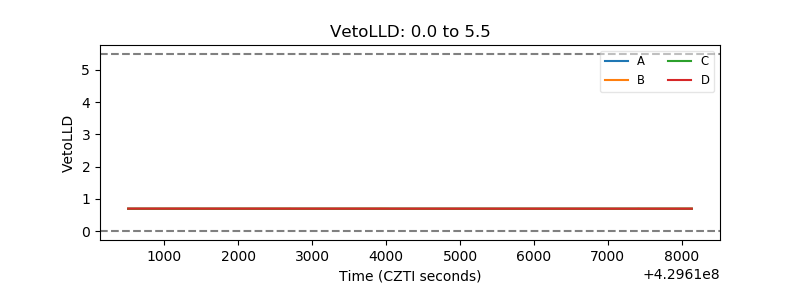 |
| Alpha Counter | 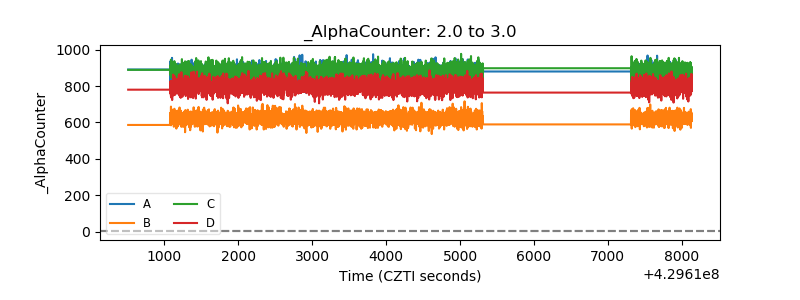 |
| _CPM_Rate | 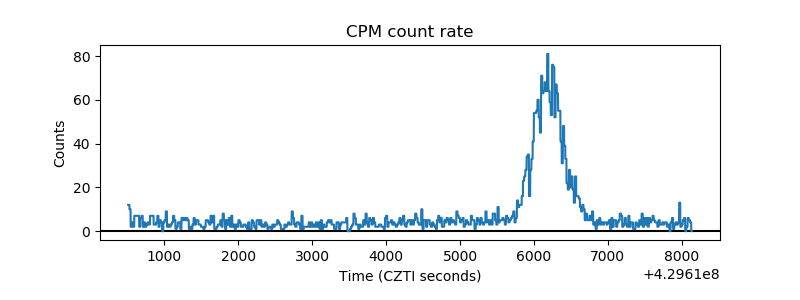 |
| CZT Counter | 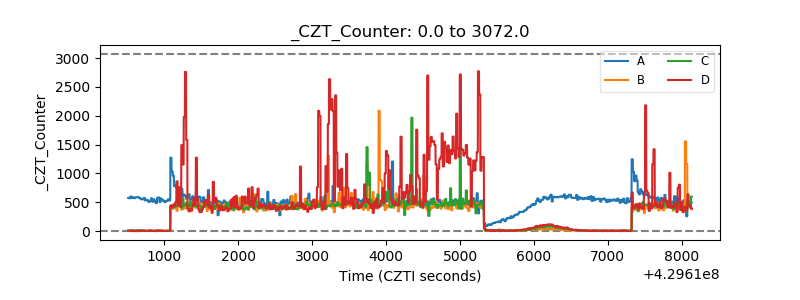 |
| +2.5 Volts monitor | 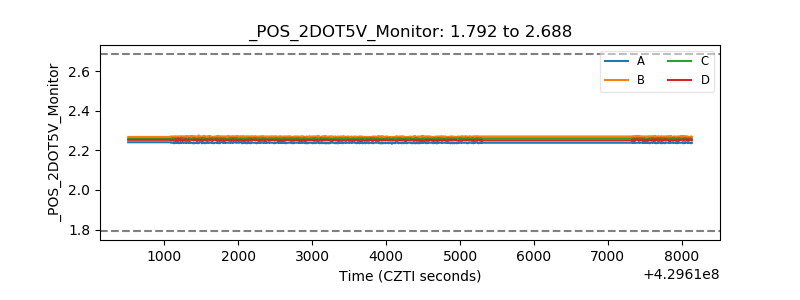 |
| +5 Volts monitor | 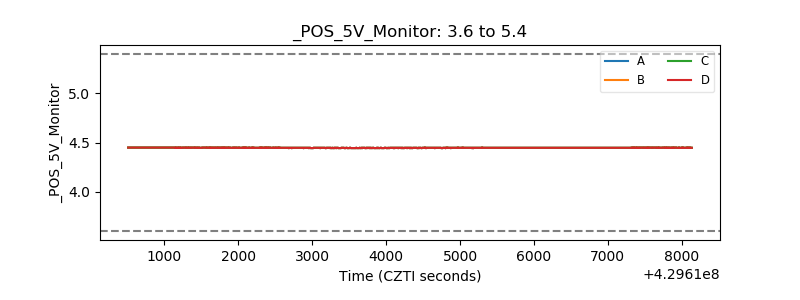 |
| _ROLL_ROT | 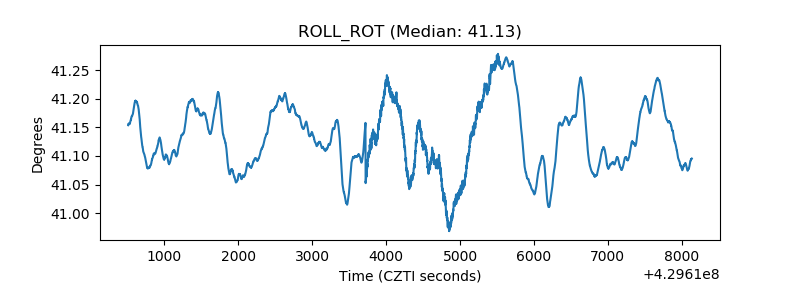 |
| _Roll_DEC | 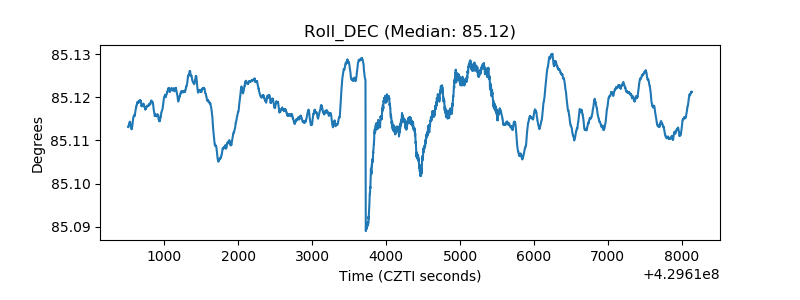 |
| _Roll_RA | 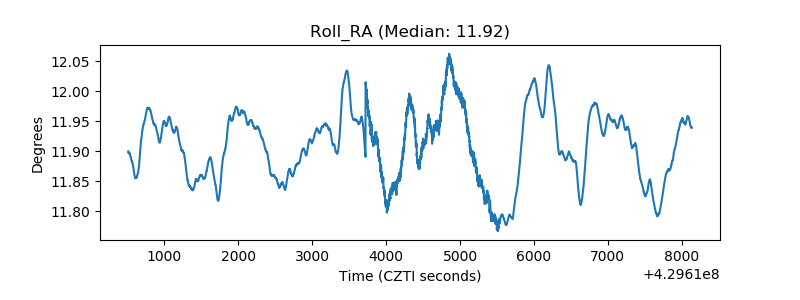 |
| Veto Counter | 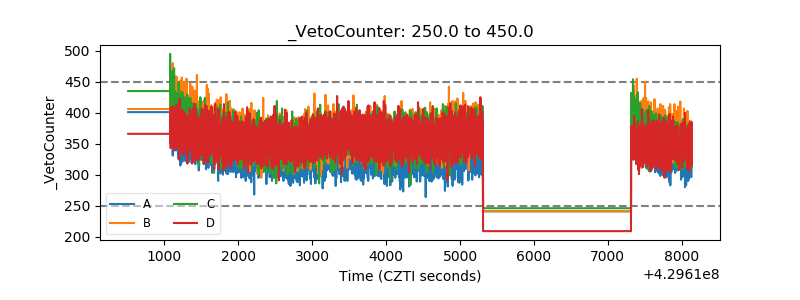 |